XRT response function modification
----- due to stray light and filter contamination
(Aki Takeda, 19 March 2021, initial version. )
(Aki Takeda, 6 October 2021, modified for the 2nd XRT calibration
meeting 2021.)

0. Introduction
Review of the status as of the previous meeting
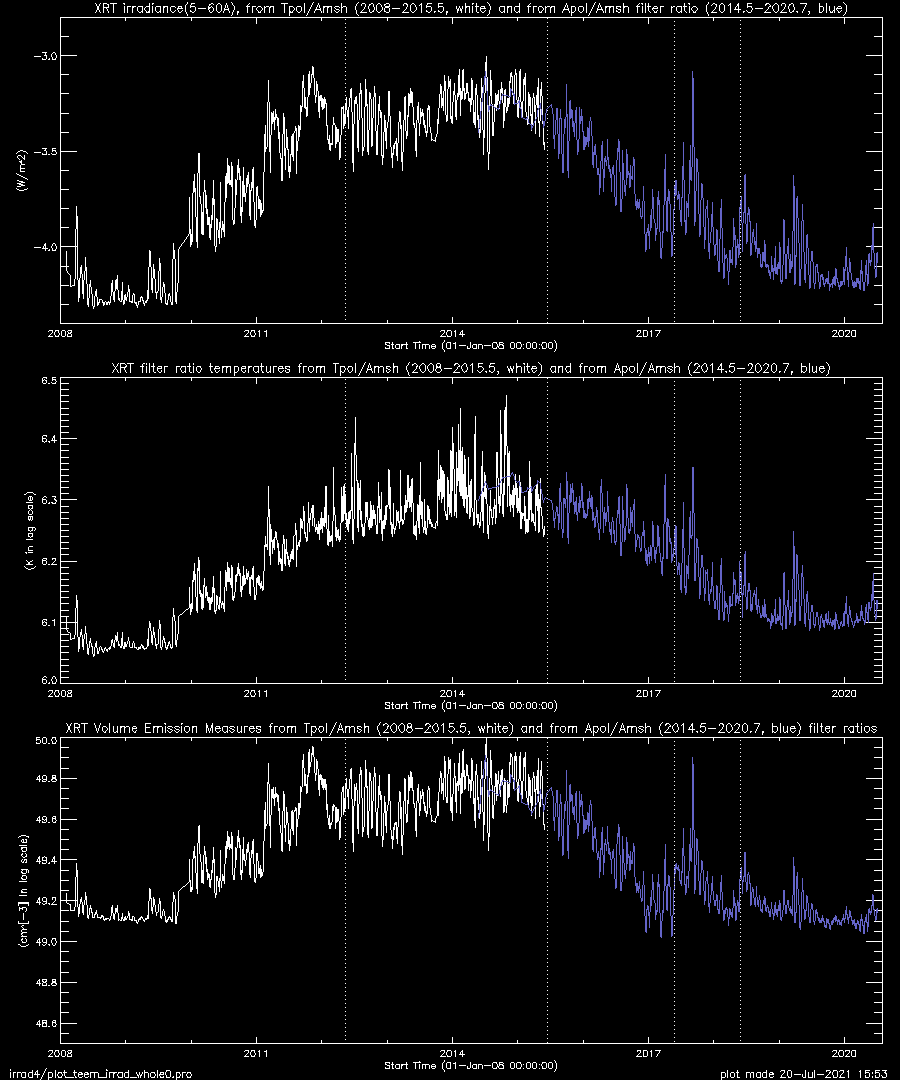
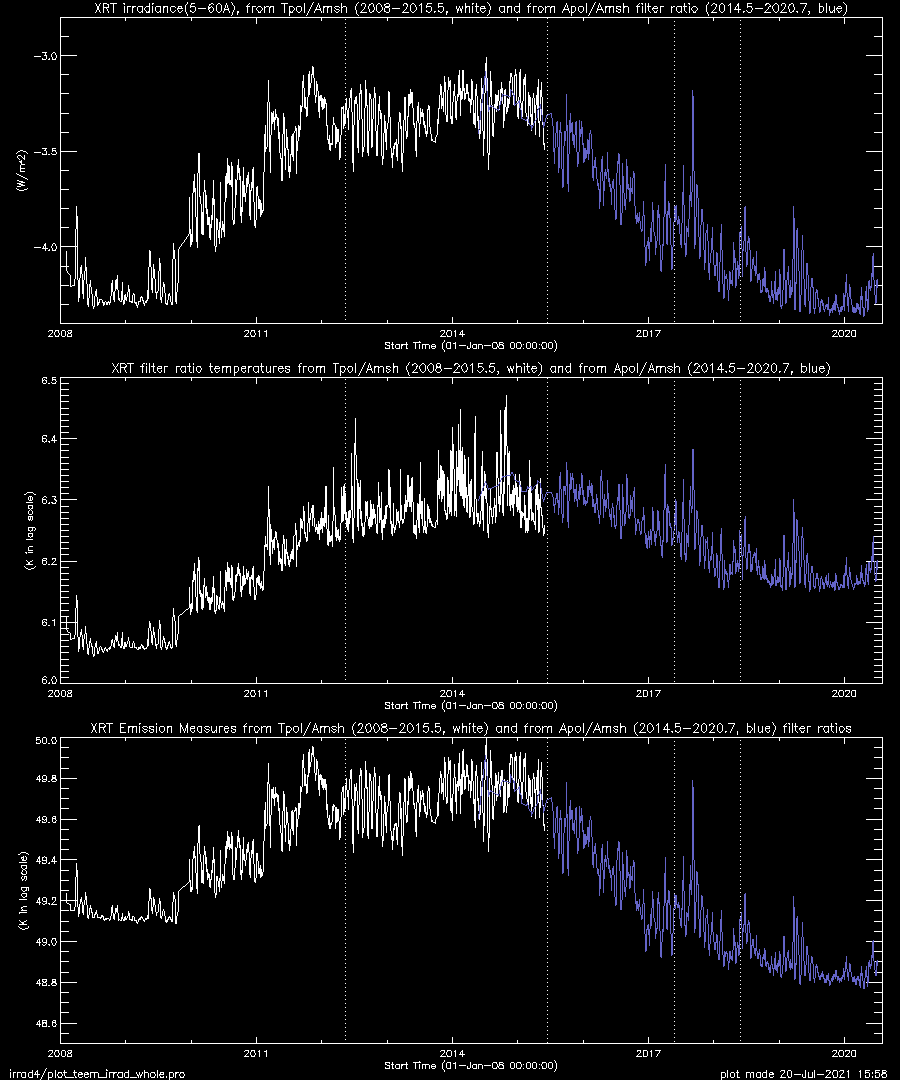
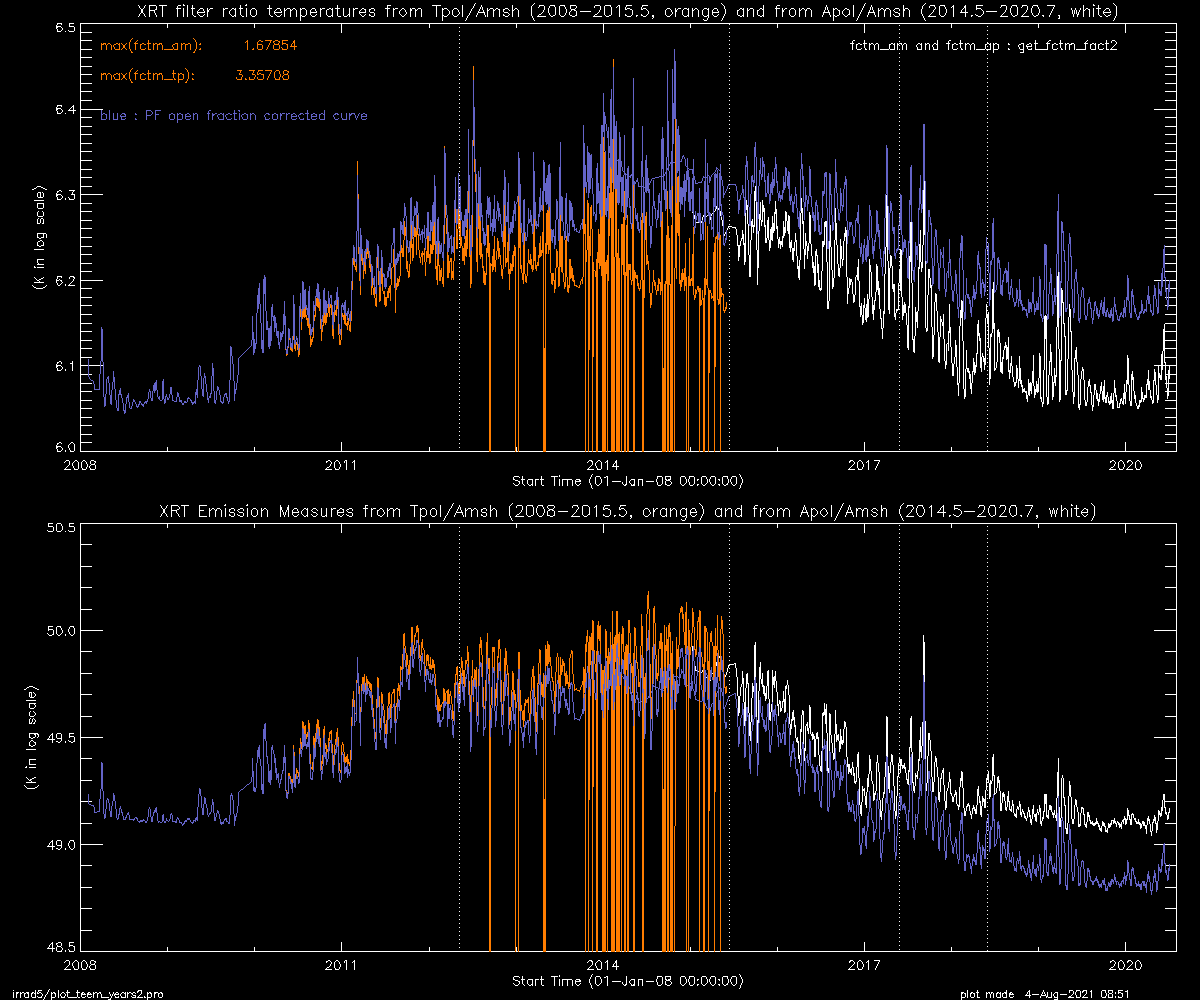
XRT irradiance (5-60A), filter ratio Te and EM
- Stray light image subtraction done : No correction of effective
area functions.
We initially tried to determine the pre-filter opening ratio by
comparing the XRT irradiance with other instruments, like GOES/XRS
and TIMED/SEE. Suman contributed to prepare the daily averaged
data set from GOES-15/XRS (1-8A) and TIMED/SEE (1-10A and 1-60A).
However, this method did not work: it turned out that the irradiances
from different instruments are not similar enough to correct the
deviation of XRT irradiance curve from that supposed to be without
pre-filter failure. Later we figured out other method using G-band
images to determine the pre-filter opening ratios.
- Image subtraction done : effective area modification(pre-filter opening
ratio below are assumed) done.
- Pre-filter open fraction obtained from G-band data analysis:
- open_fraction at phase 1 (after 9-May-2012 12:00) : 0.001
- open_fraction at phase 2 (after 14-Jun-2015 12:30) : 0.033
- open_fraction at phase 3 (after 27-May-2017 11:00) : 0.075
- open_fraction at phase 4 (after 29-may-2018 00:00) : 0.099
Despite our current best effort of correction, the above plots have
serious problems, which need to be further corrected.
- significant difference in Te in two solar minimums(cycle 23 & 24).
- significant difference in EM in two solar minimums(cycle 23 & 24).
These results indicate that there is still a missing piece of puzzle
to fully (quantitatively) correct the visible stray light contamination
included in our X-ray images.
1. New attempts
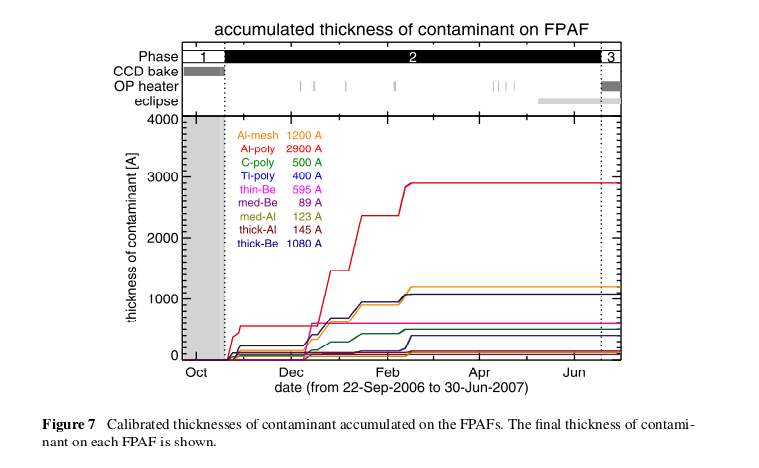
Considering the contamination on Focal Plane Analysis Filters(FPAFs)
Applying the similar corrections as those performed in Narukage et al.(2011),
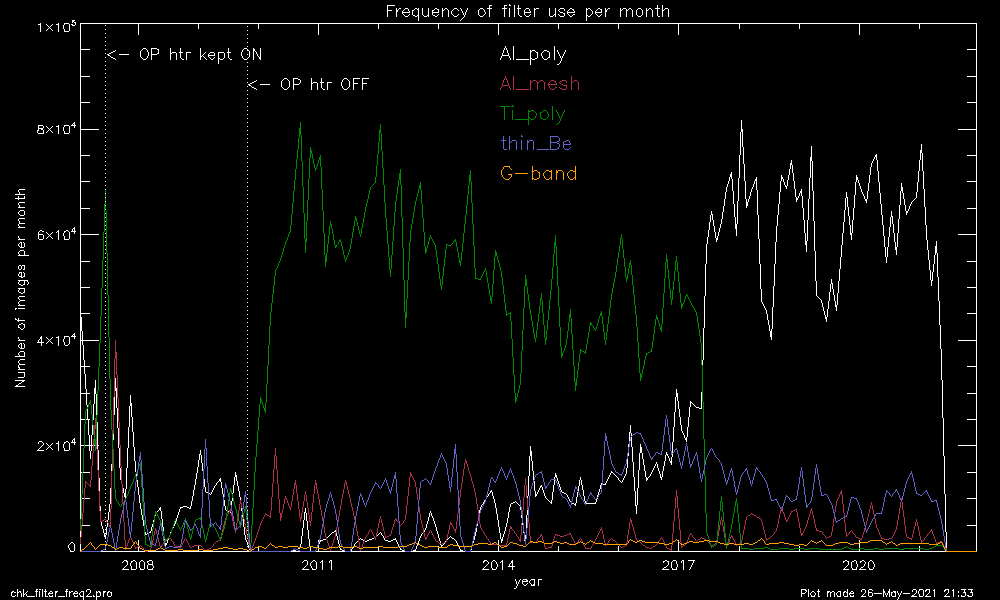
in which the temperature around the FPAFs and the frequency of the filter use
are key factors.
[Note about XRT's THERMAL phases defined by Narukage et al (2011)] (not stray light phase)
- phase 1 : 22-Sep-2006(launch) --- 19-Oct-2006 : CCD bakeout heater ON.
- phase 2 : 19-Oct-2006 --- 18-Jun-2007 :
CCD bakeout htr OFF, Operational heater ENABLED.
- phase 3 : 18-Jun-2007 --- 24-Oct-2009 : OP heater kept ON.
- phase 4 : 24-Oct-2009 --- present. : OP heater OFF. (added by AT)
| Fig. 7 from Narukage etal 2011 | Fig.37 from Narukage etal (2011) | $SSW data readings |
|

|

|
- Variation of temperature around FPAF after the thermal phase 3
Te and EM with FPAF contamination
--- First Attempt ---
We assume that the additional contamination layer was built during
the period the FPAF temperature was low (roughly < 10C) after the
OP hearter kept turned OFF in the late November, 2009.
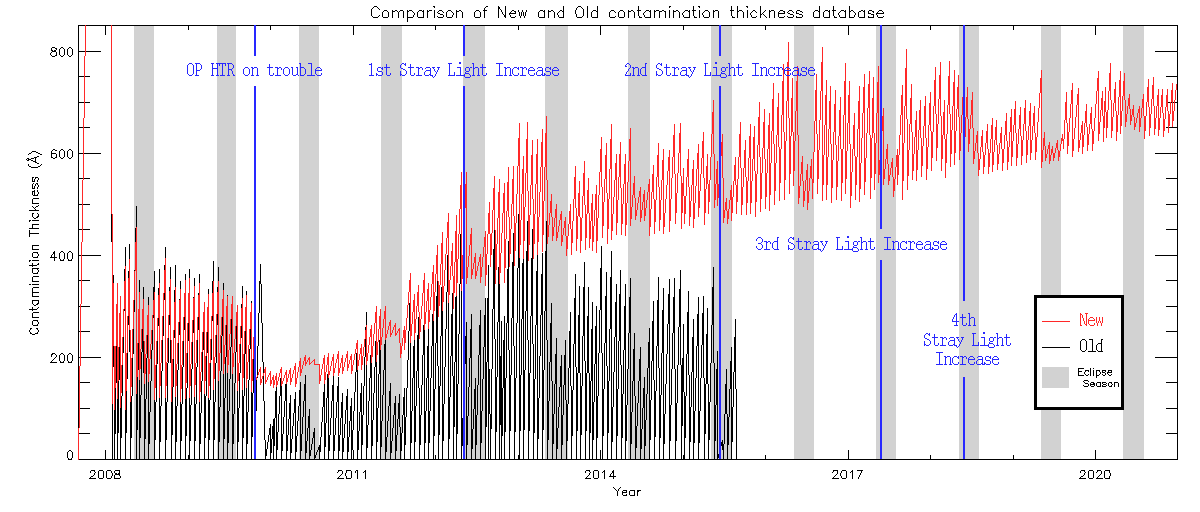
First, we assumed the similar growing curve as the CCD contamination.
extracted CCD growth curve
assumed growth curve for X-ray filters
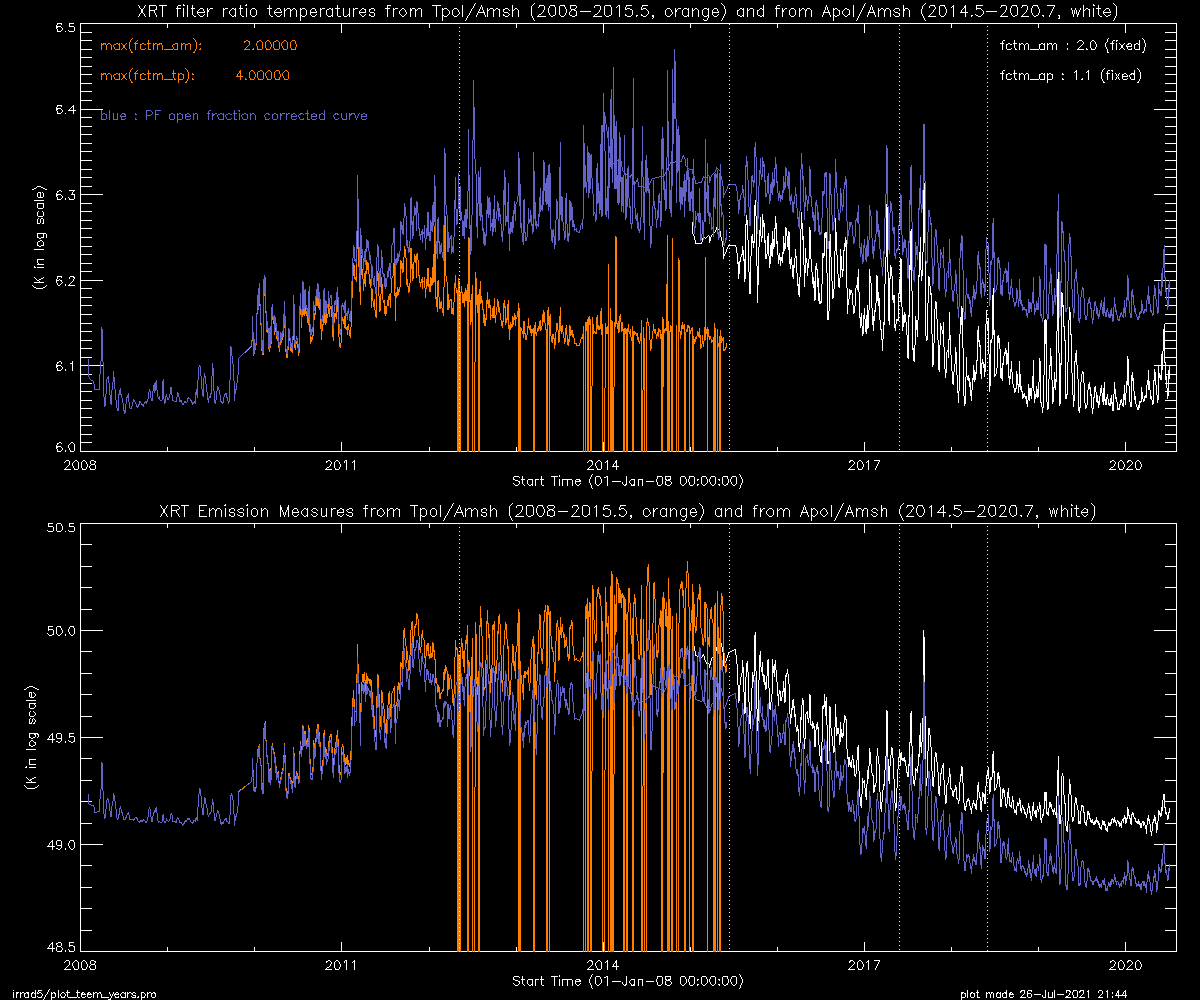
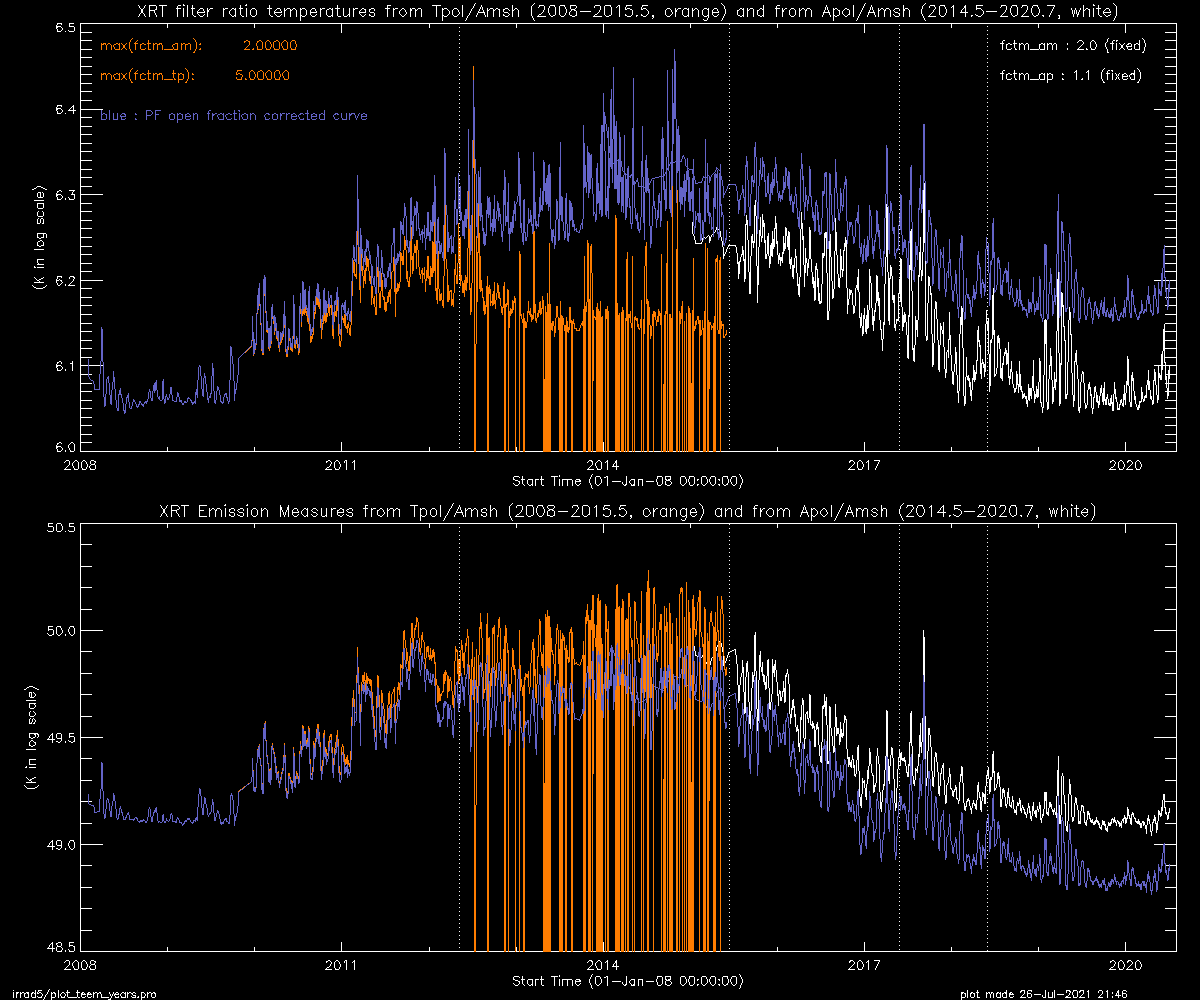
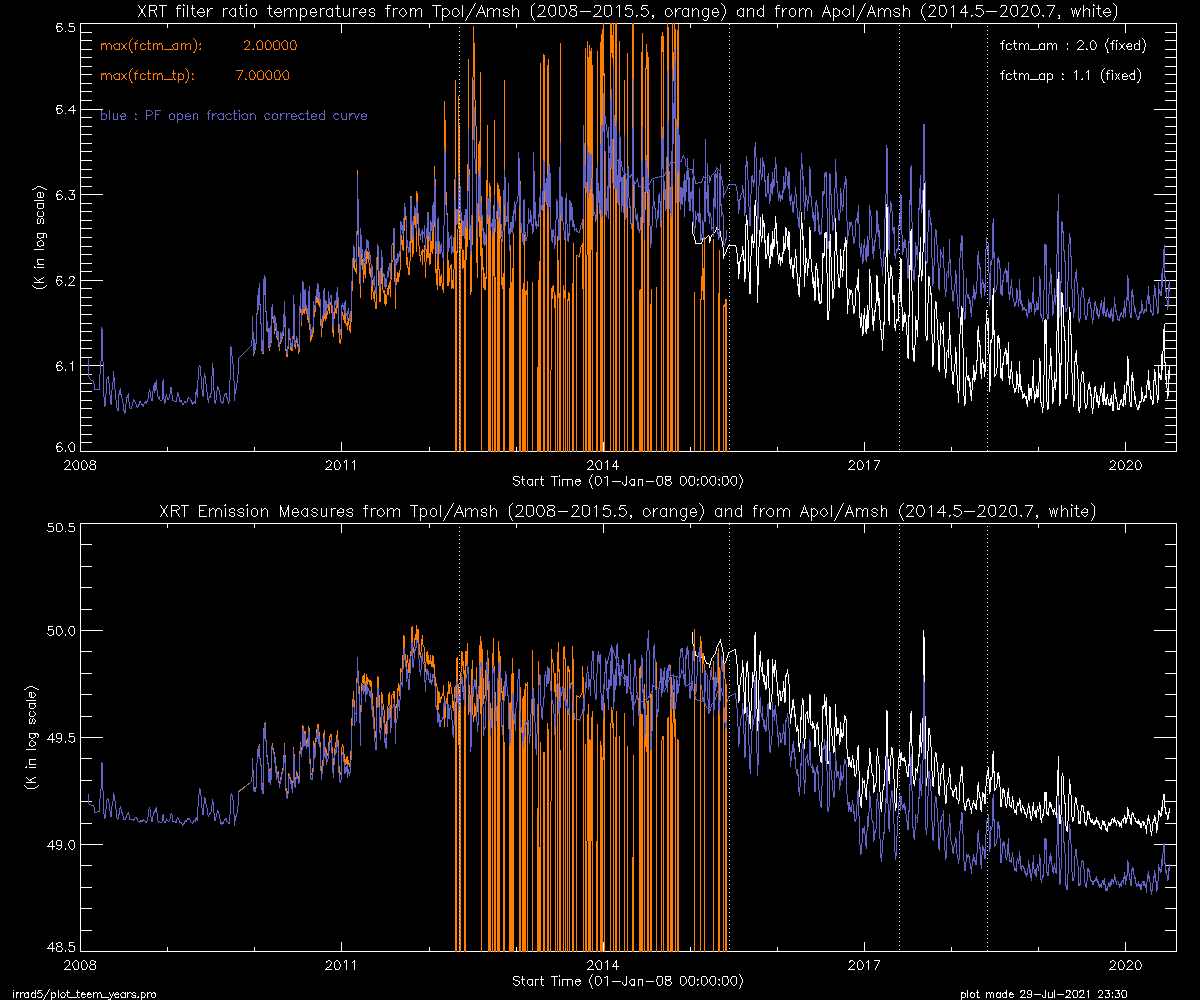
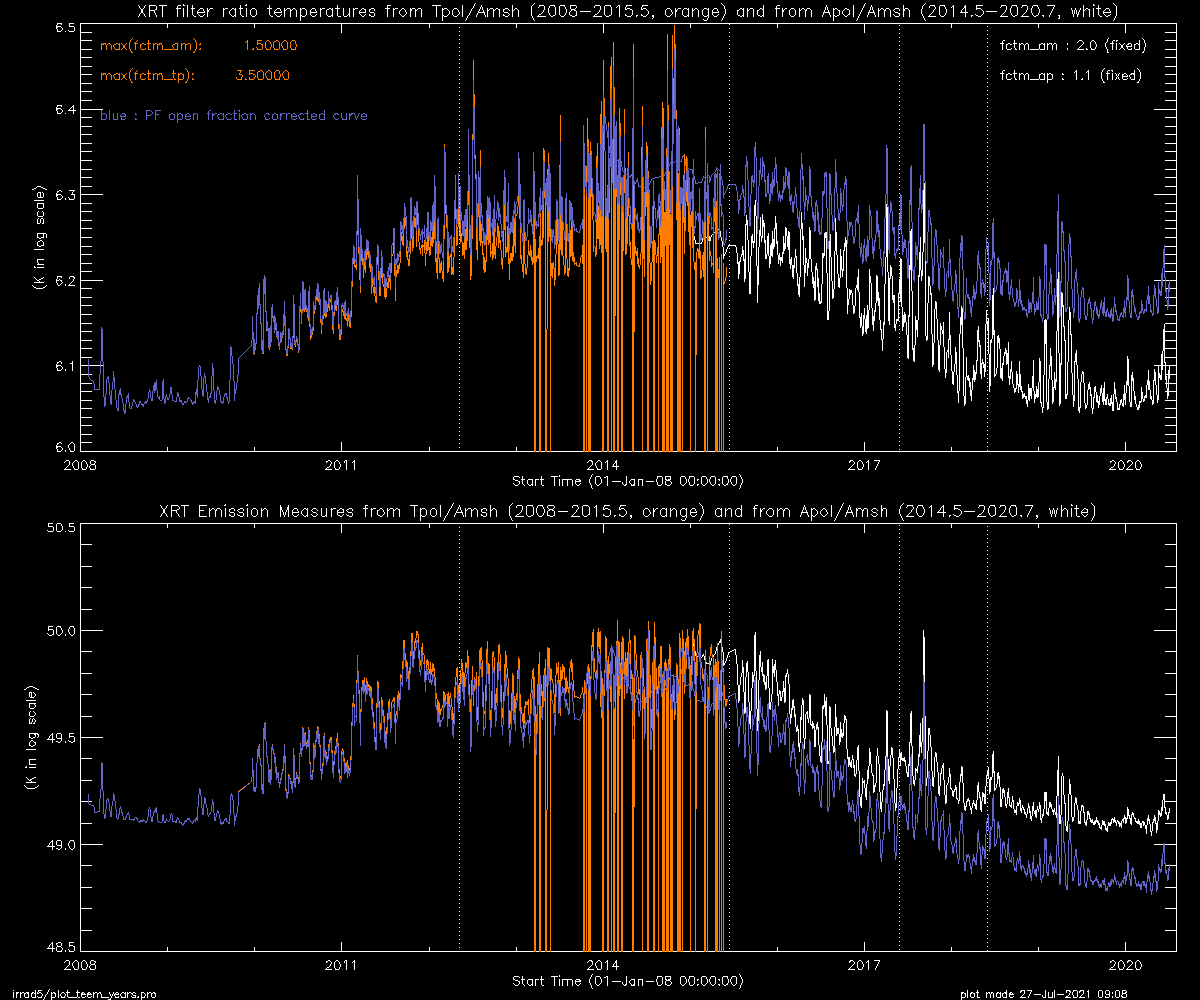
- fixed filter contamination factors for Al_mesh : 2.0, Al_poly: 1.1
correct Te & EM curves at the solar minimum (around 2019-2020).
- contamination layer thickness for Ti_poly was assumed the same
level as Al_mesh (by thickness not factor, e.g.,
Ti_poly factor becomes 4.0 when Al_mesh factor is 2.0).
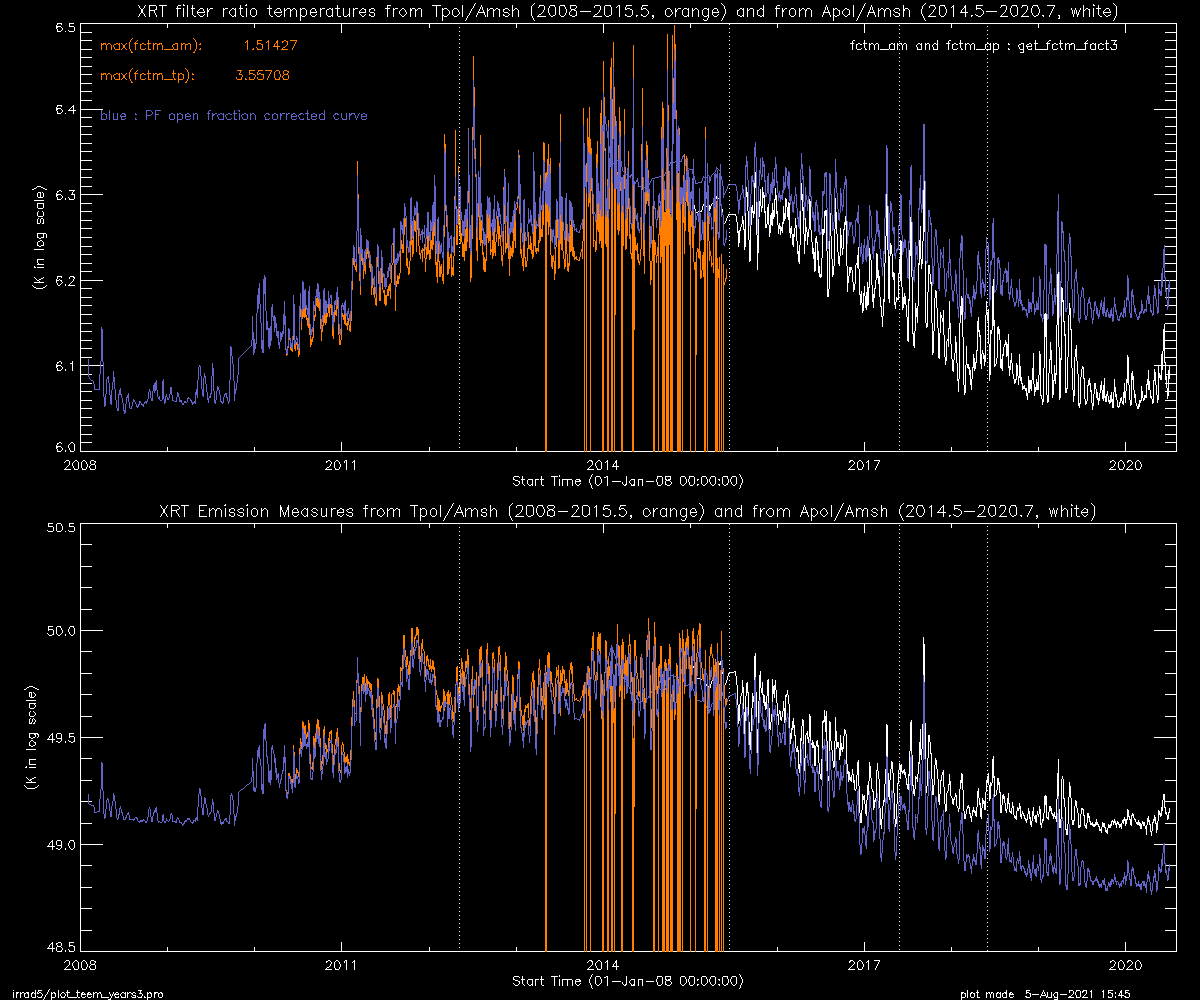
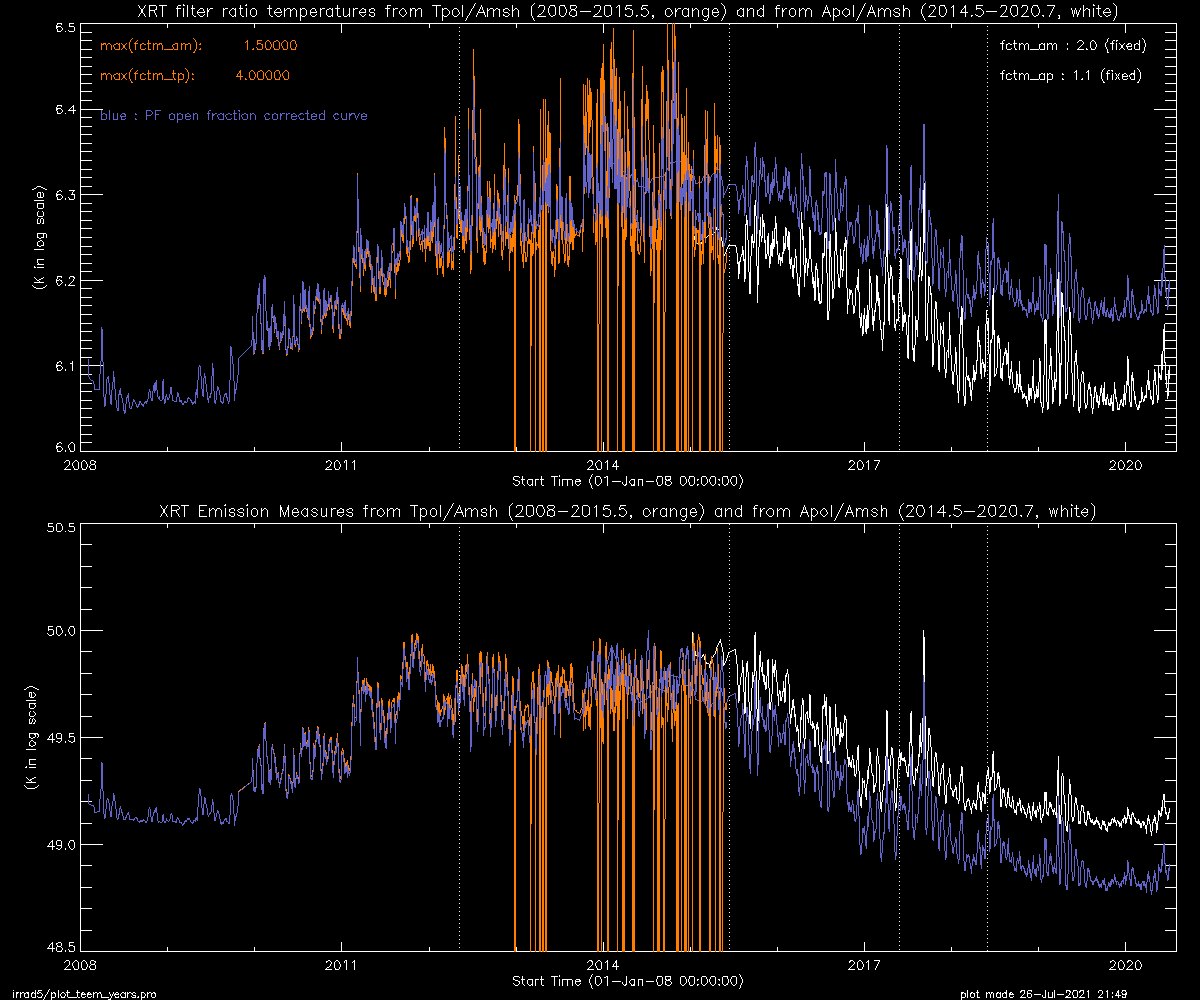
- max layer thickness for Al_mesh:2.0 does not work for 2010-2015.
- increasing Al_mesh factor turning the filter ratio curve
to a multiple-value function (examples
1
and 2 ).
max filter contam. factor :
2.0(Alms) & 4.0(Tpol) |
2.0(Alms) & 5.0(Tpol) |
2.0(Alms) & 7.0(Tpol) |
|
|
|
|
|
max filter contam. factor :
1.5(Alms) & 3.0(Tpol) |
1.5(Alms) & 3.5(Tpol) |
1.5(Alms) & 4.0(Tpol) |
1.5(Alms) & 5.0(Tpol) |

|
|
|

|
--- Second Attempt ---
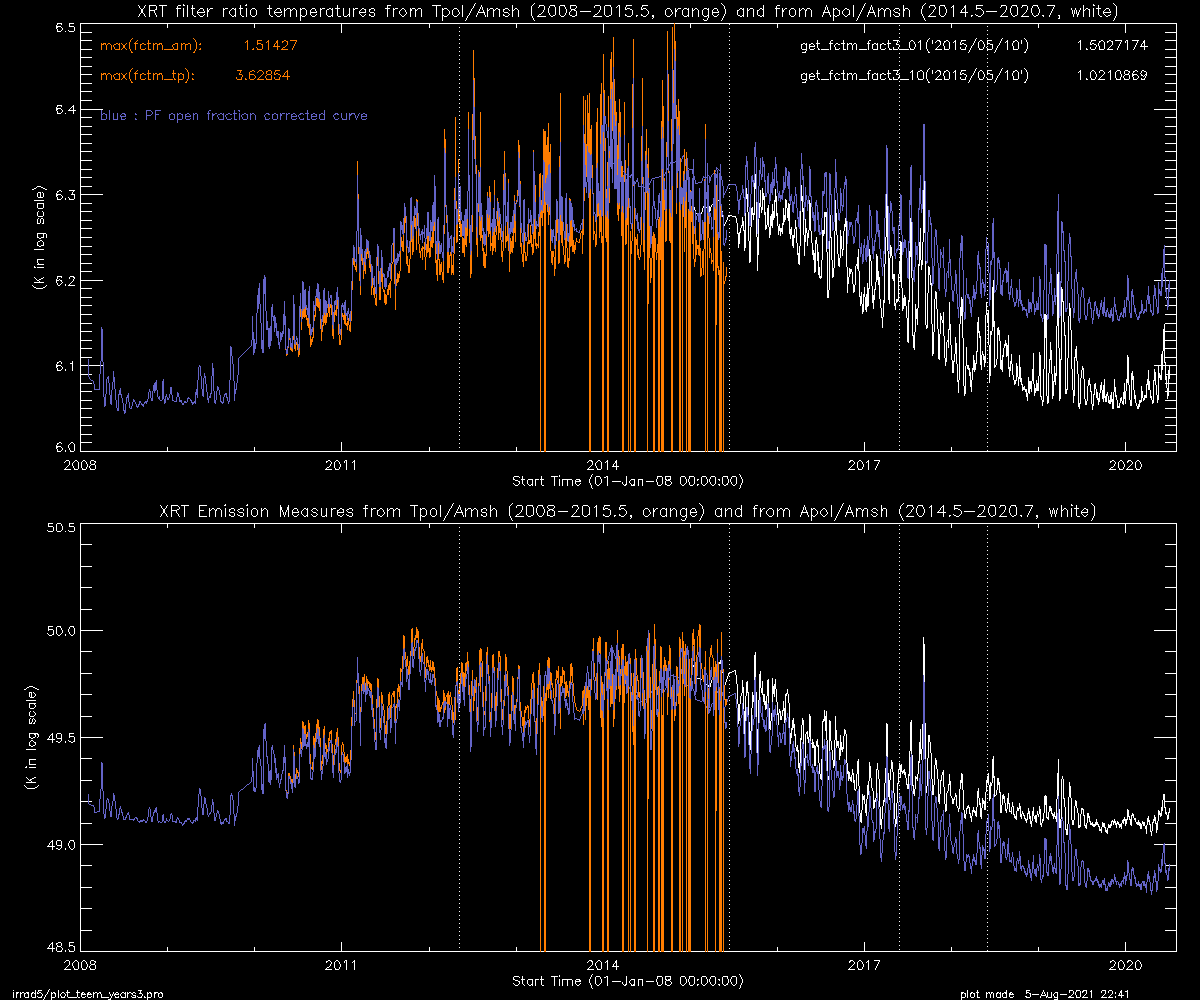
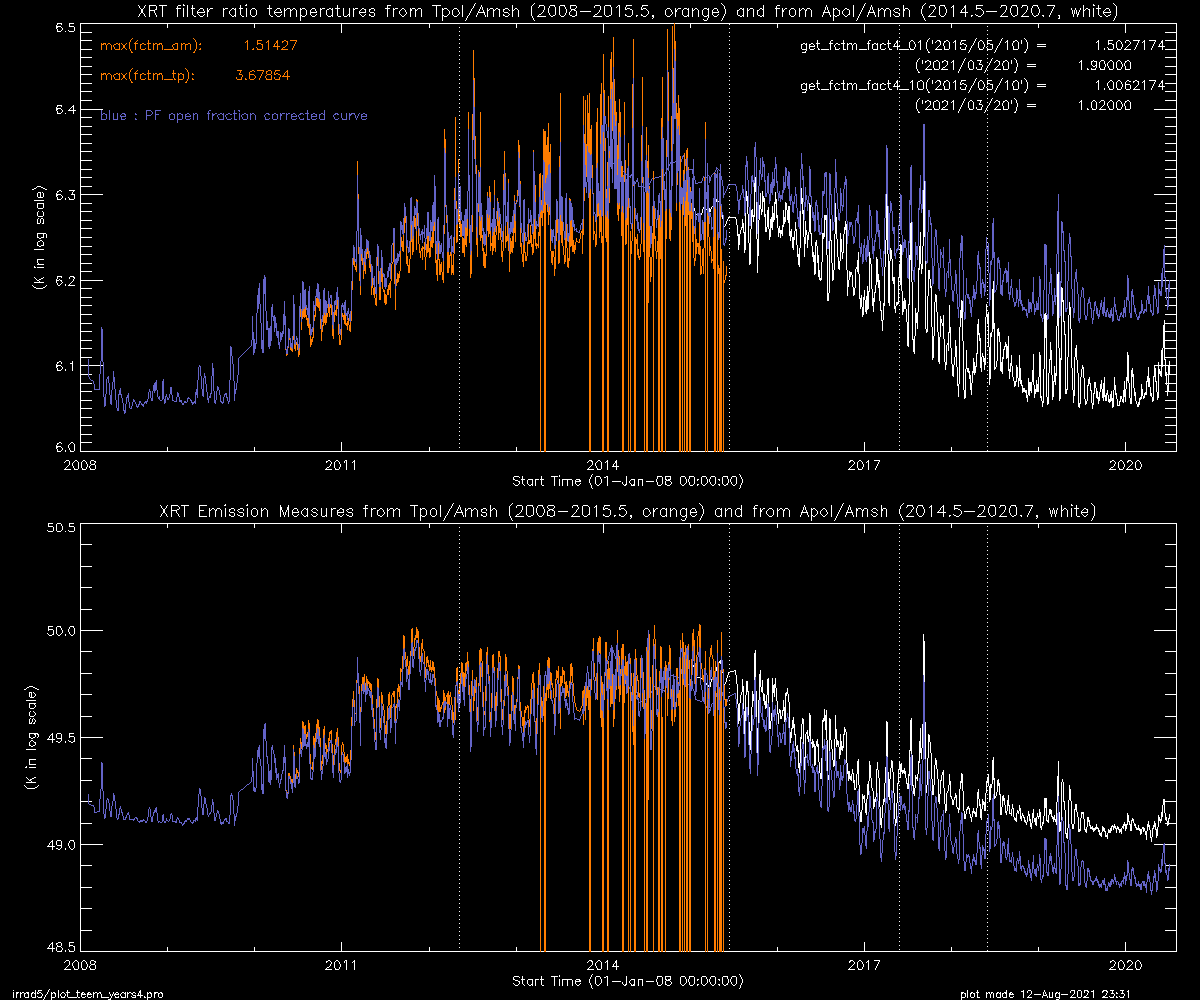
Assuming that the contamination grows only during the eclipse season
from 2010 to 2017 (when the FPAF temperature less than 5C).
- factor relative to the last value of curent DB :
type 1
type 2
- converted to the thickness of the contamination layer :
type 1
type 2
| type 1 (teem_*_ofrac_fctm3_ series) |
type 2 (teem_*_ofrac_fctm4_ series) |

|
|
other try and errors
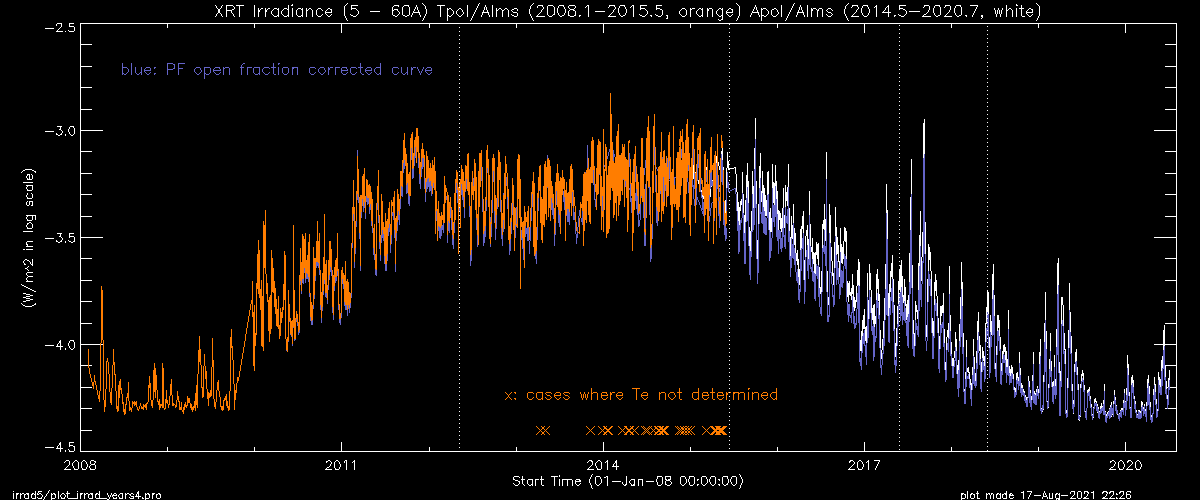
derived irradiance
2. Follow-up analysis by K. Reeves
XRT_lightleak_calibration (29-Sep-2021)
3. If we have time for it ...
Report of the 2021 stray light analysis
Extended study using the corrected response functions
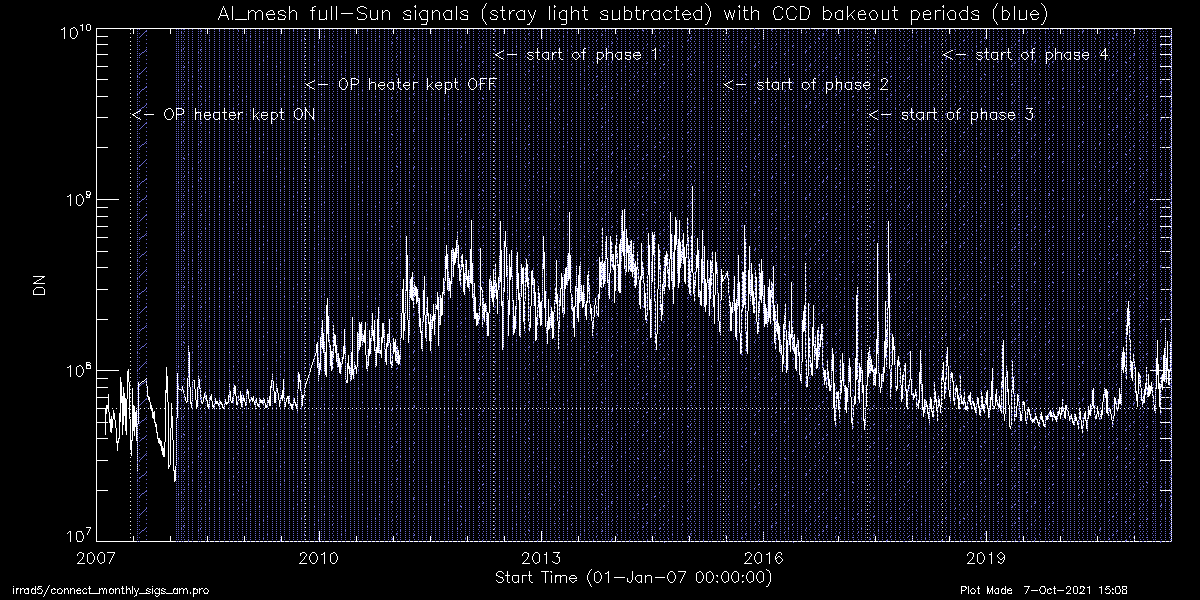
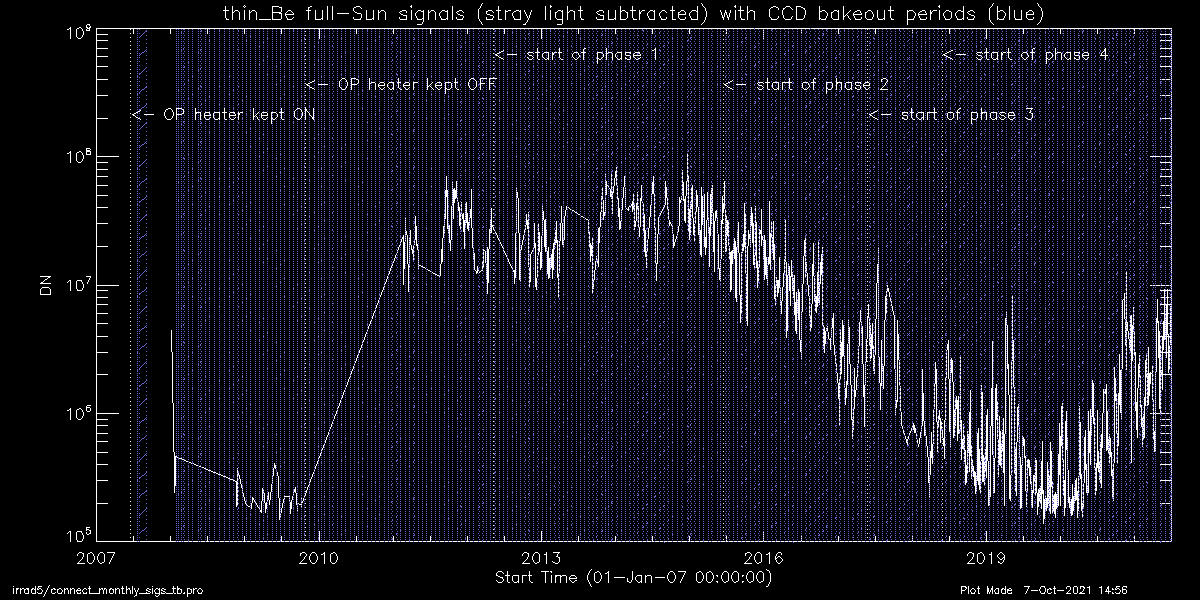
Variation of the full-Sun signals with different filters (7-Oct-2021)
* Al_mesh, Ti_poly and Al_poly plots were made from the
current irradiance study.
* Thin_Be signals were measured by my 2021 REU student, Stefanie Davis.
* Al_poly data points (2008-2015) can be increased by additional work.
* Al_mesh singals are prone to attenuate by the contamination.
| Al_mesh | Ti_poly |
|

|
| Al_poly | Thin_Be |

|
|
--- Third Attempt ---
The stray light correction turned out to shift the temperature too high
and EM too low. But the opening factors are very small until the phase 2,
so its effect to effective area function might be smaller.
In this attempt, prefilter open fraction was set to the half value of
those obtained from GET_PF_OPENFRAC.PRO.
try'n error plot Te 1
EM 1
fctm factor 5_1
fctm in Å 5_1
try'n error plot Te 2
EM 2
try'n error plot Te 3
EM 3
try'n error plot Te 4
EM 4
try'n error plot Te 5
EM 5
fctm factor 5_5
--- 4th Attempt ---
It turned out that the reduced pre-filter open fraction tried in the above
causes unnatural EM curve in the phase 3 and 4: EM in 2017 becomes lower
than that of 2019-2020(solar min.). We thus bring a little back the open
fraction values.
1: ofrac(i)=0
2: ofrac(i)=work*0.50
3: ofrac(i)=work*0.65
4: ofrac(i)=work*0.80
else: ofrac(i)=work*1.0
Te 6_1
EM 6_1
fctm factor 6_1
1: ofrac(i)=0
2: ofrac(i)=work*0.50
3: ofrac(i)=work*0.60
4: ofrac(i)=work*0.70
else: ofrac(i)=work*1.0
Te 6_2
EM 6_2
fctm factor 6_2
Te 6_3
EM 6_3
fctm factor 6_3
Te 6_4
EM 6_4
fctm factor 6_4
Te 6_5
EM 6_5
fctm factor 6_5
Te 6_6
EM 6_6
fctm factor 6_6
Te 6_7
EM 6_7
fctm factor 6_7
