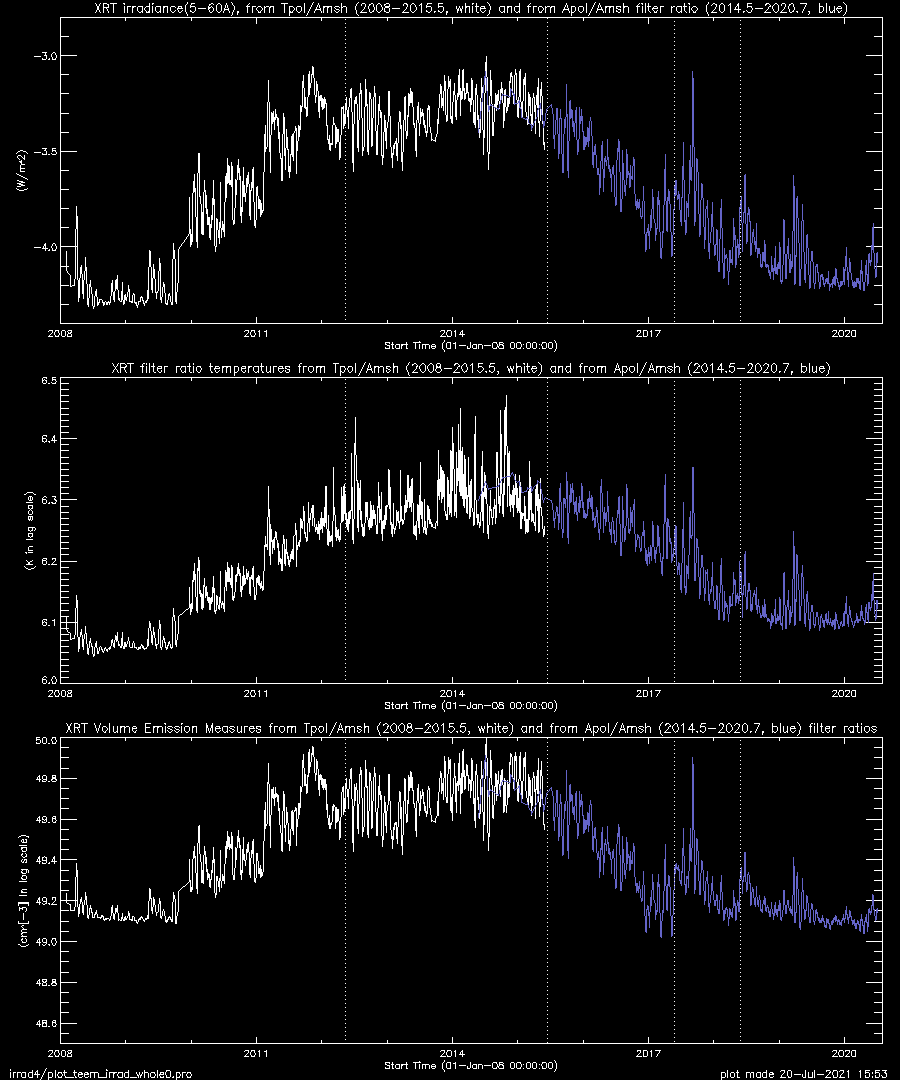
Despite our current best effort of correction, the above plots have
serious problems, which need to be further corrected.
- significant difference in EM in two solar minimums(cycle 23 & 24).
These results indicate that there is still a missing piece of puzzle
to fully (quantitatively) correct the visible stray light contamination
included in our X-ray images. [status as of Dec-2020]
1. How to better correct effective area functions
approach 1: Assume additional contamination on Focal Plane Analysis
Filters(FPAFs)
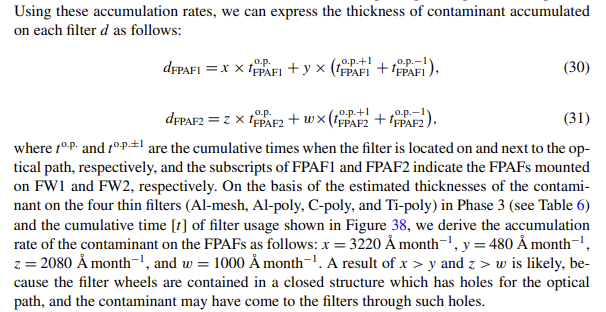
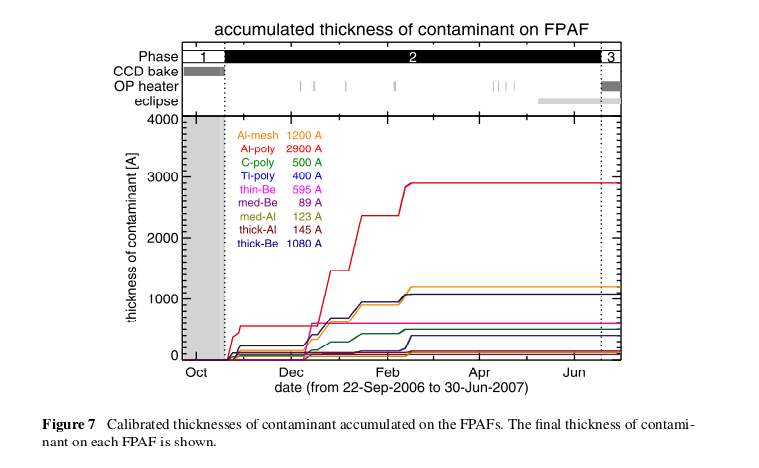
Applying the similar corrections as those performed in Narukage et al.(2011),
in which the temperature around the FPAFs and the frequency of the filter use
are key factors.
| Fig. 7 from Narukage etal 2011 | Fig.37 from Narukage etal (2011) |
|

|
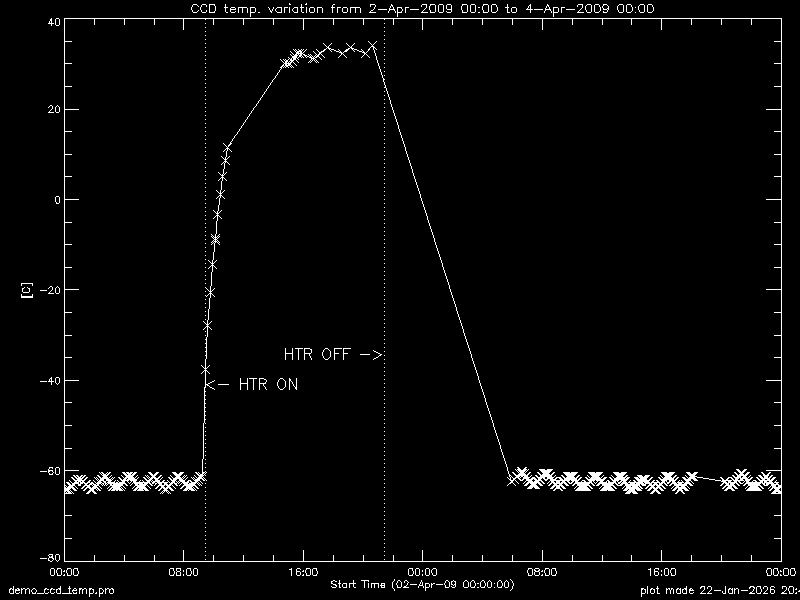
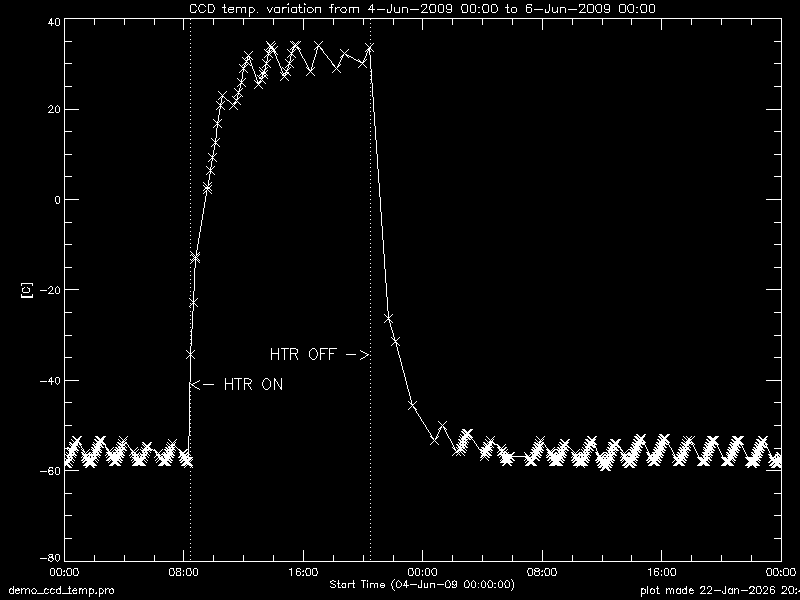
- Variation of CCD temperature in around CCD bakeout :
heated from -60C (during observation) to +30C (during bakeout).
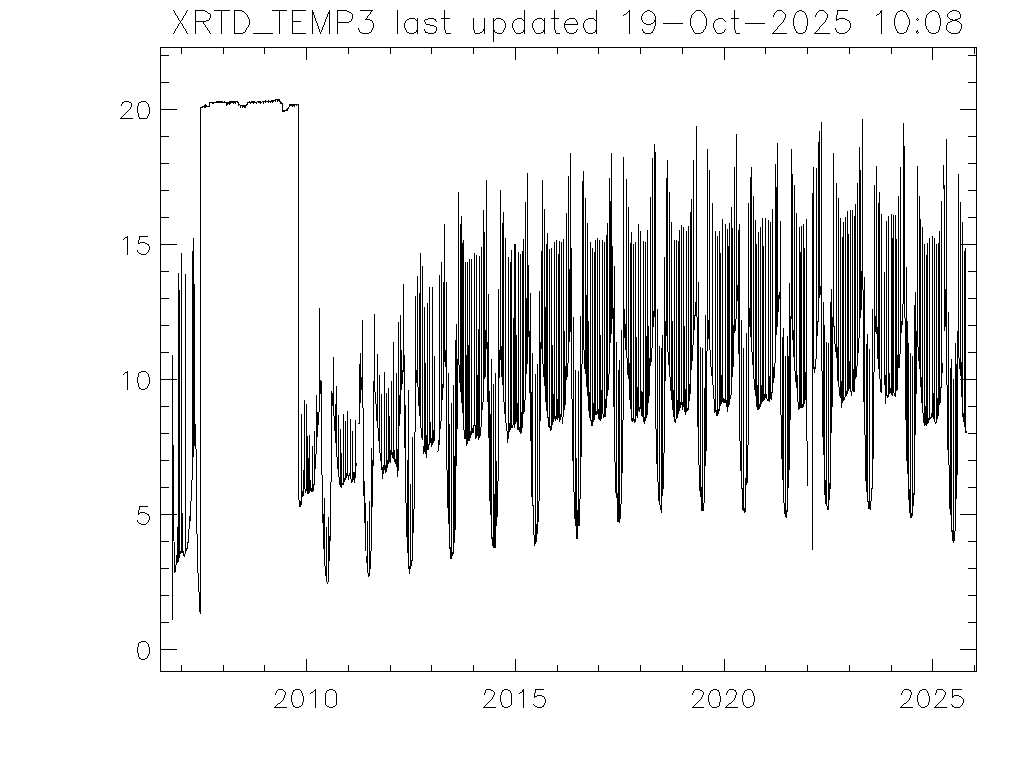
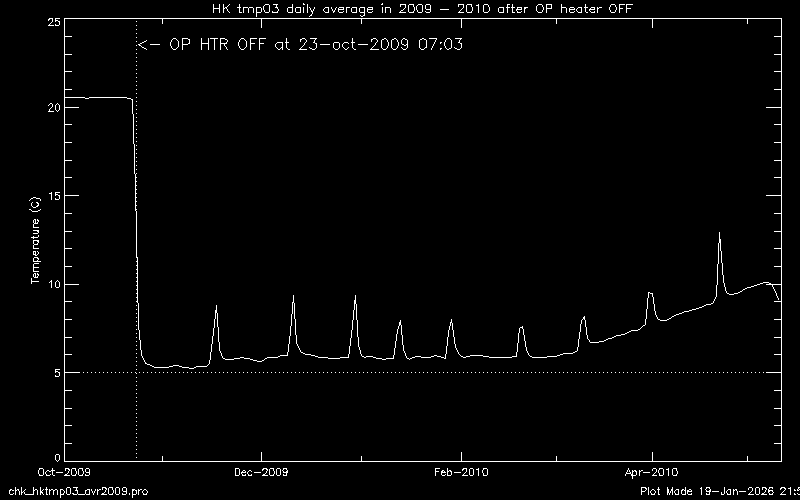
- Variation of temperature around FPAF after the thermal phase 3
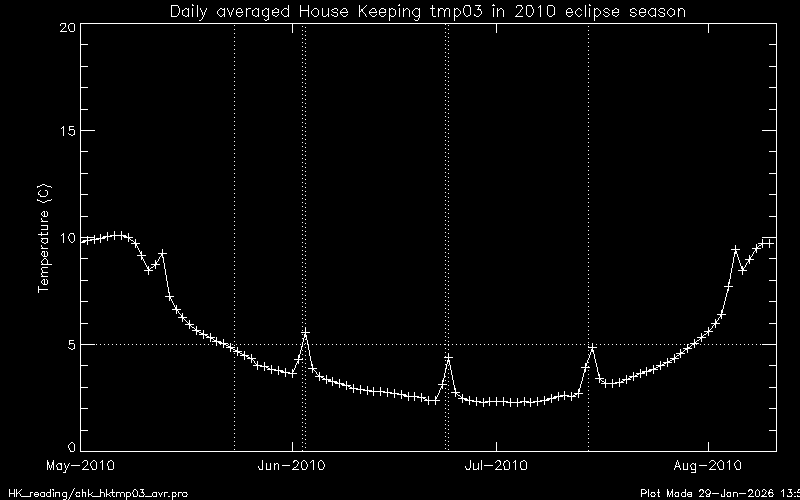
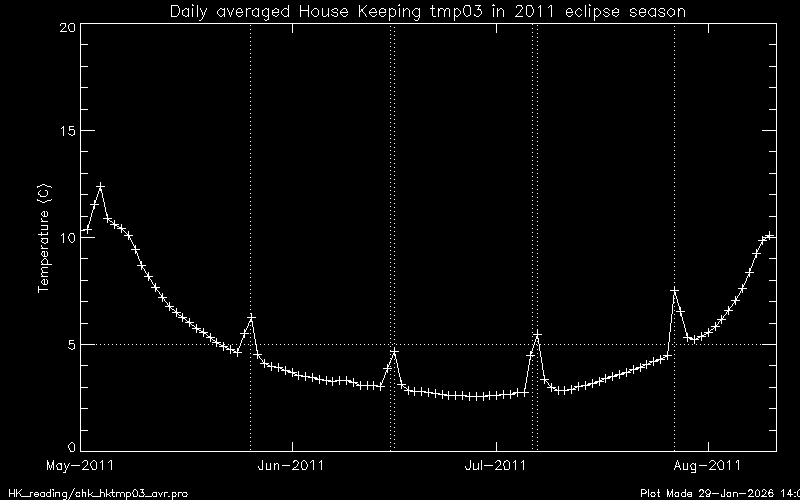
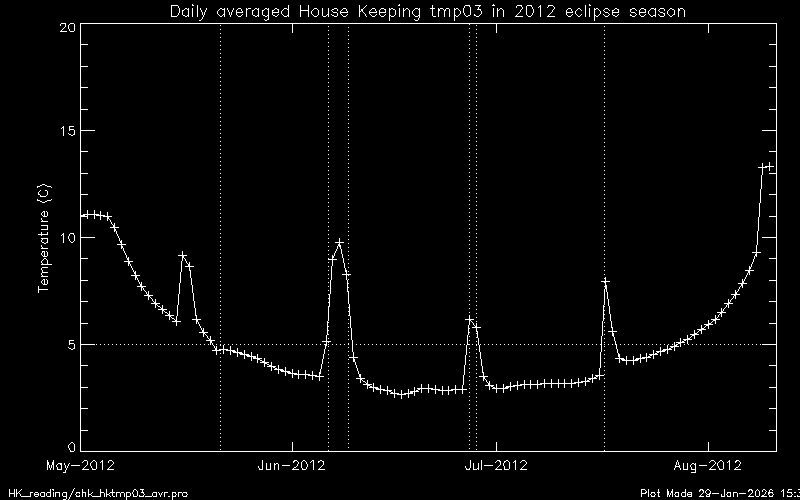
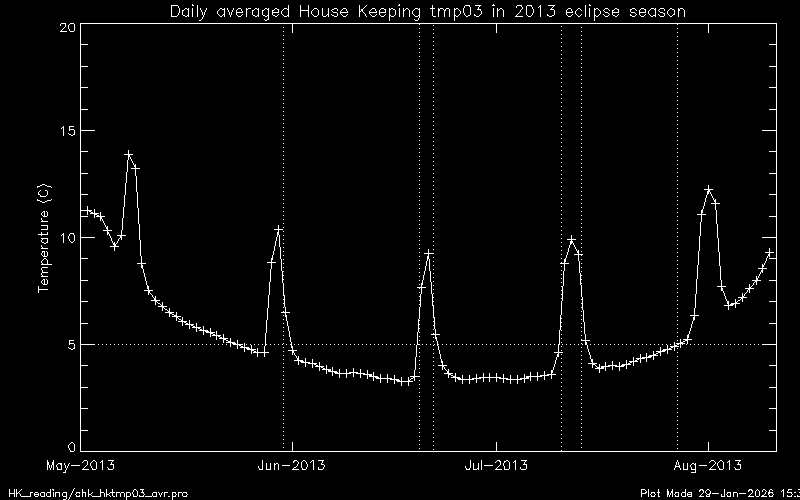
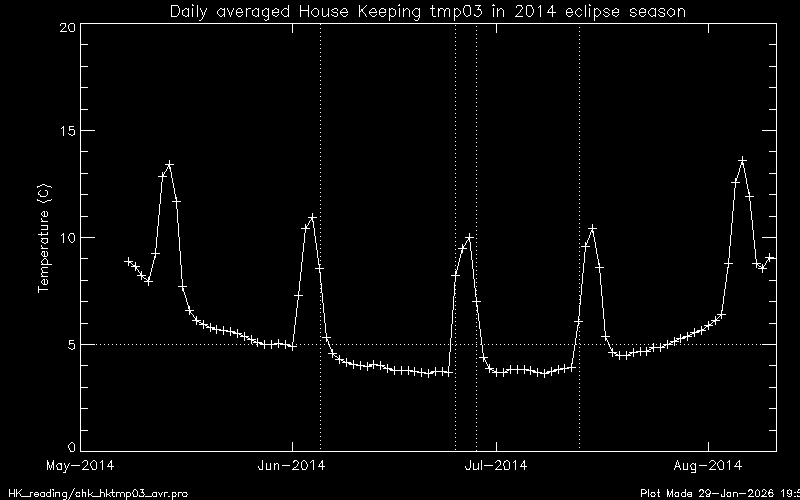
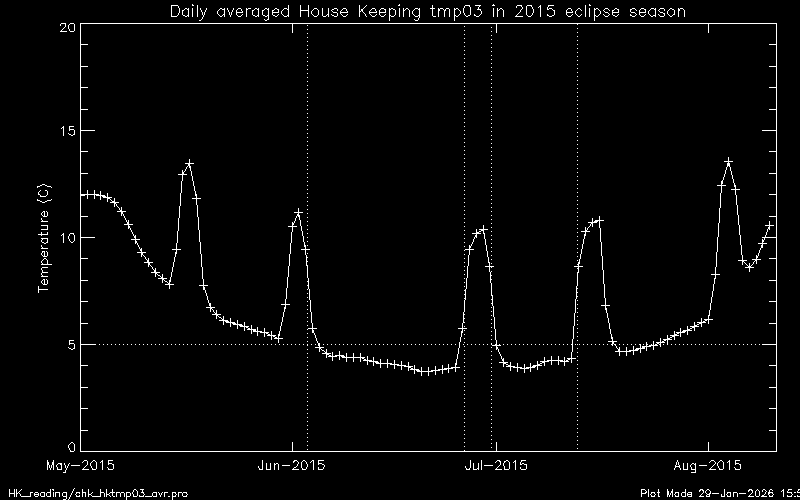
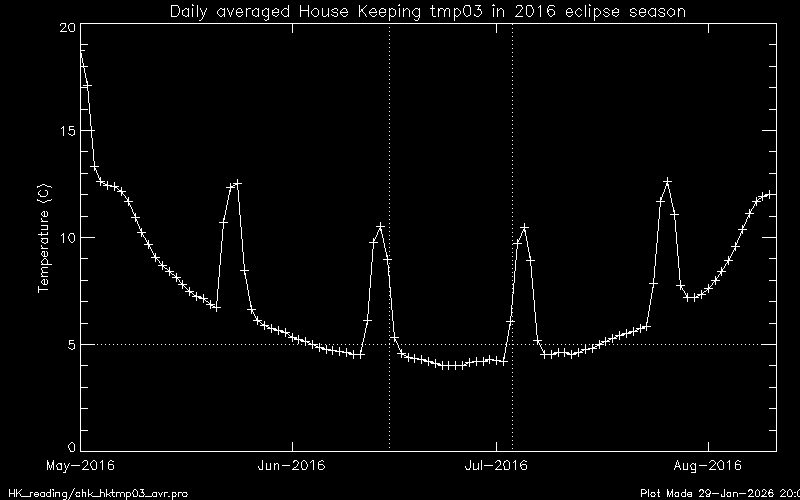
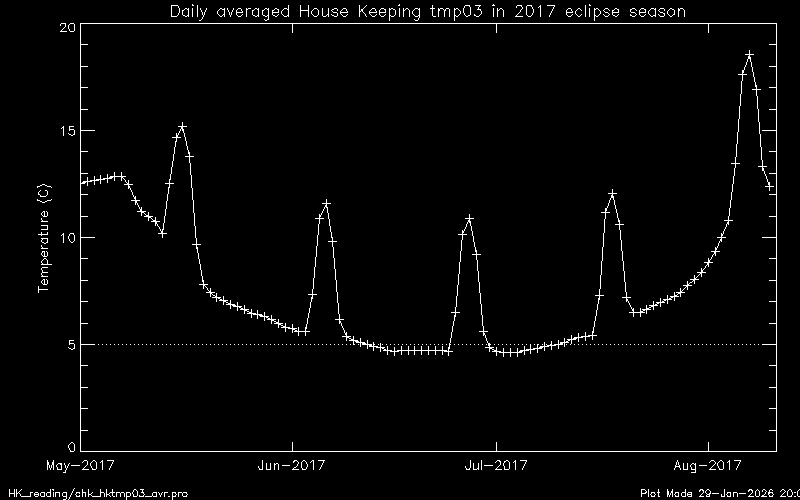
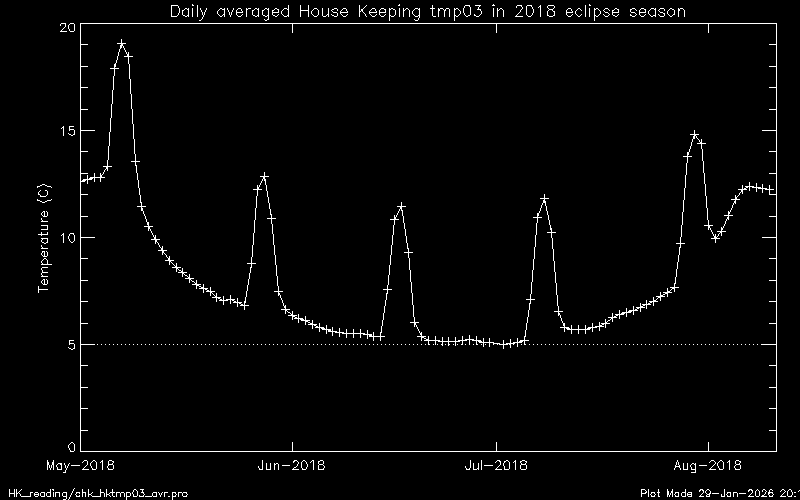
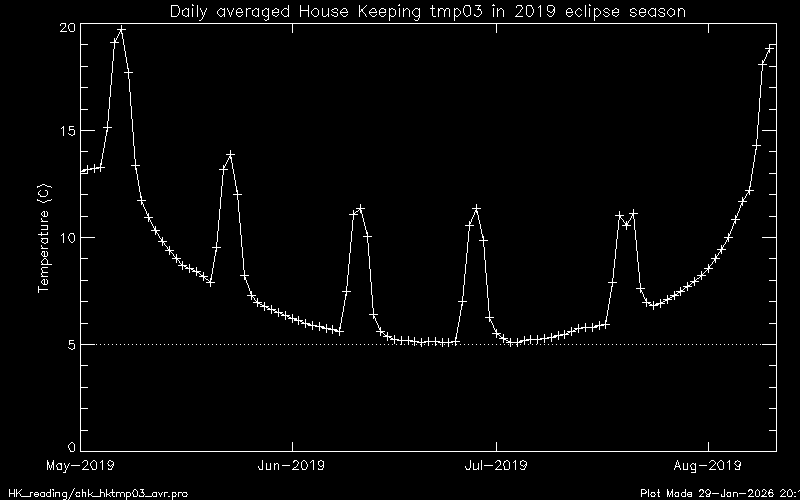
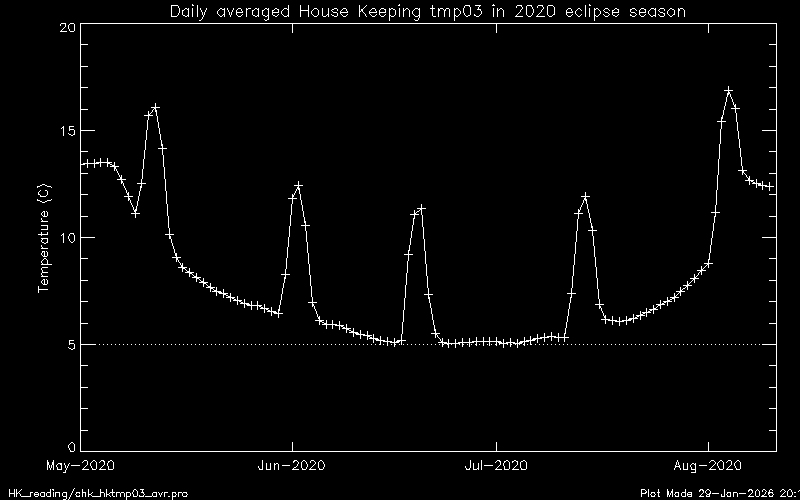
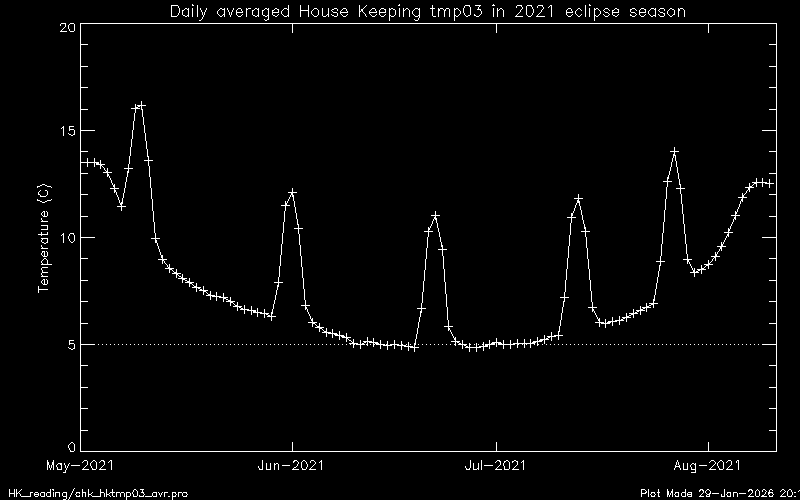
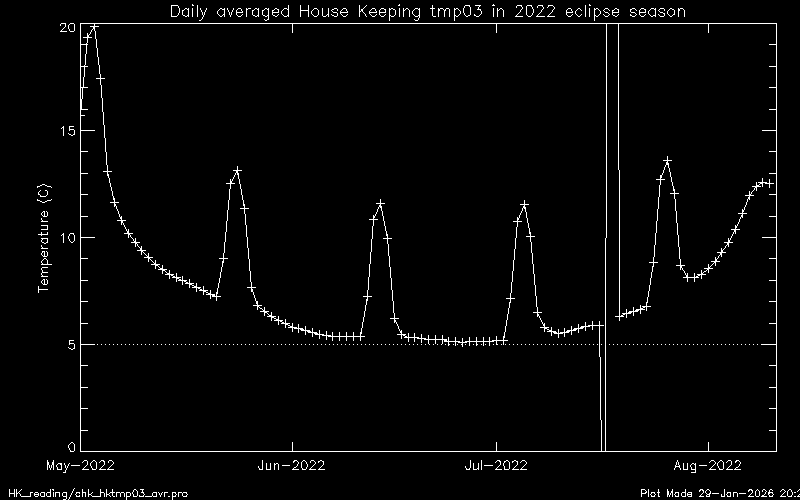
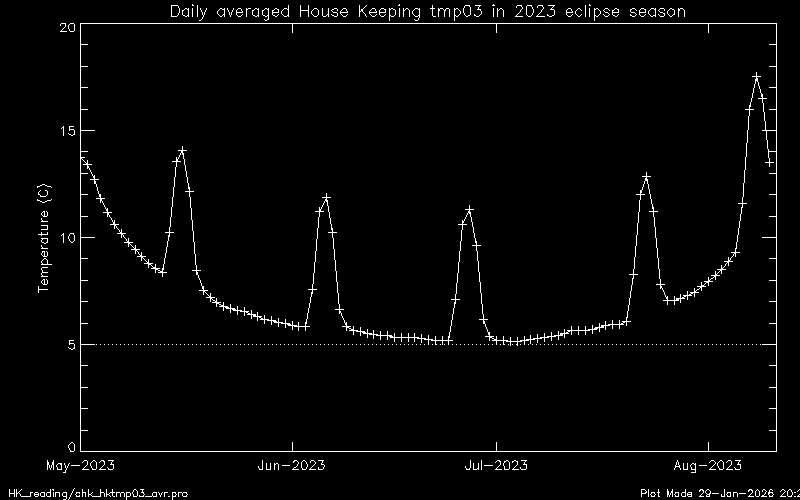
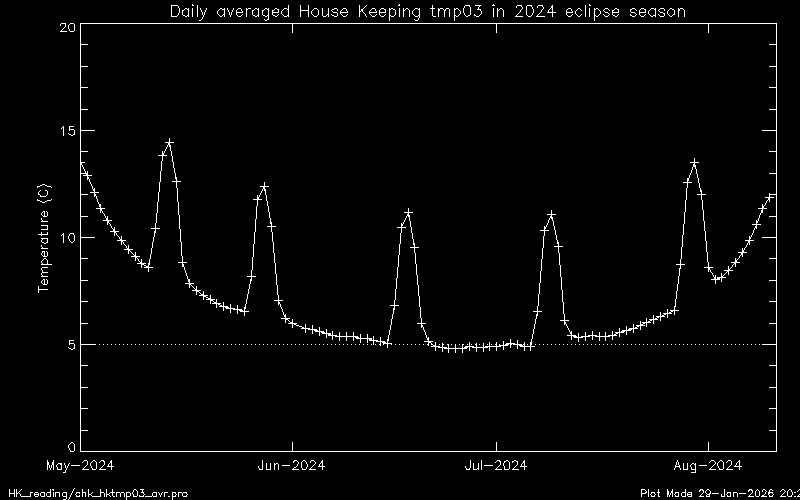
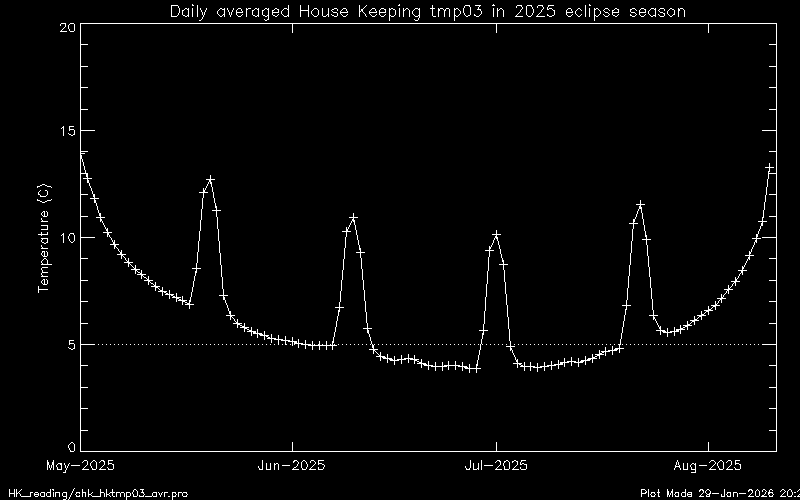
- Frequency of filter use during cool period (HK TMP03 < 5C)
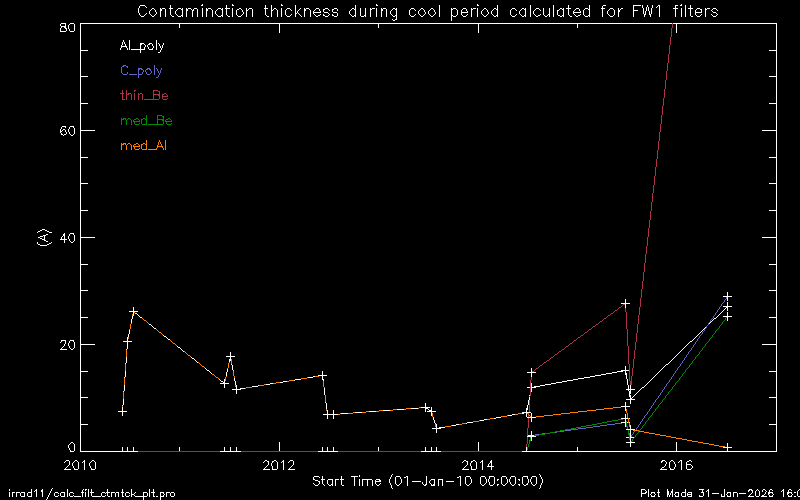
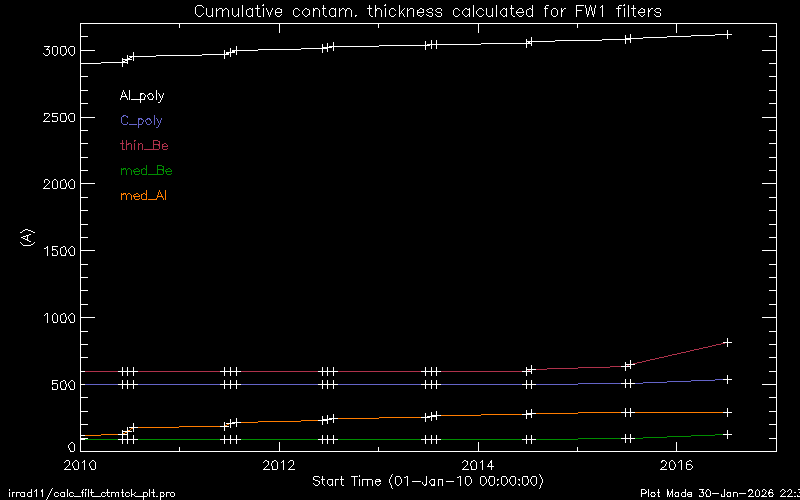
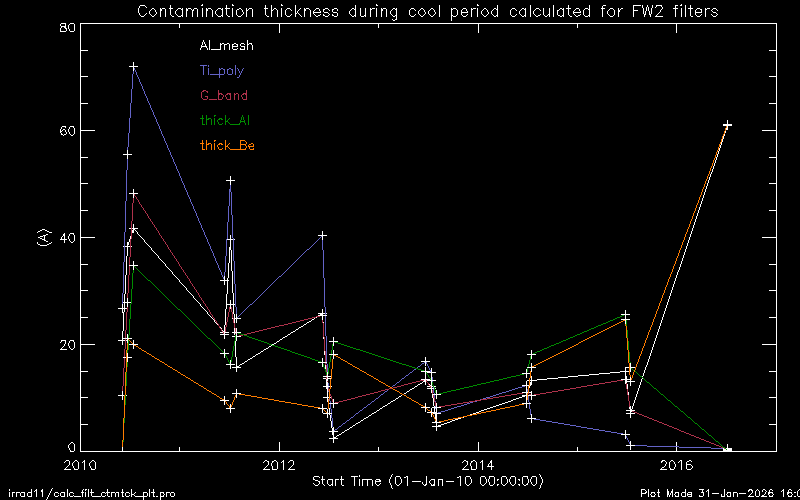
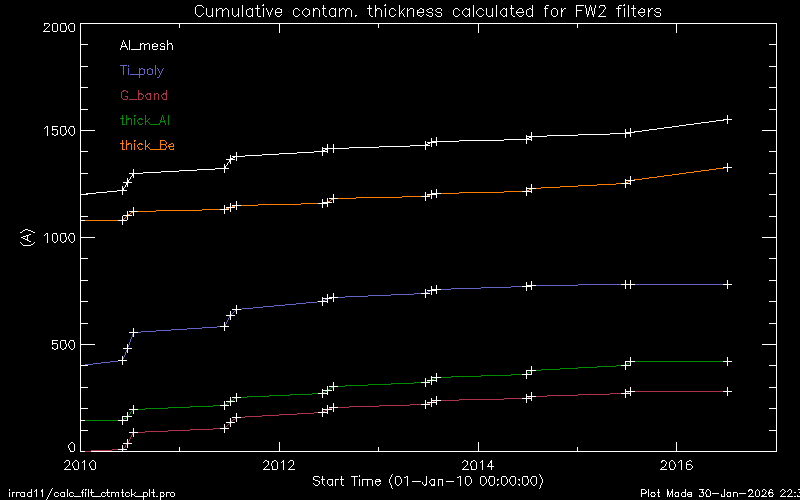
cumlative thickness in A
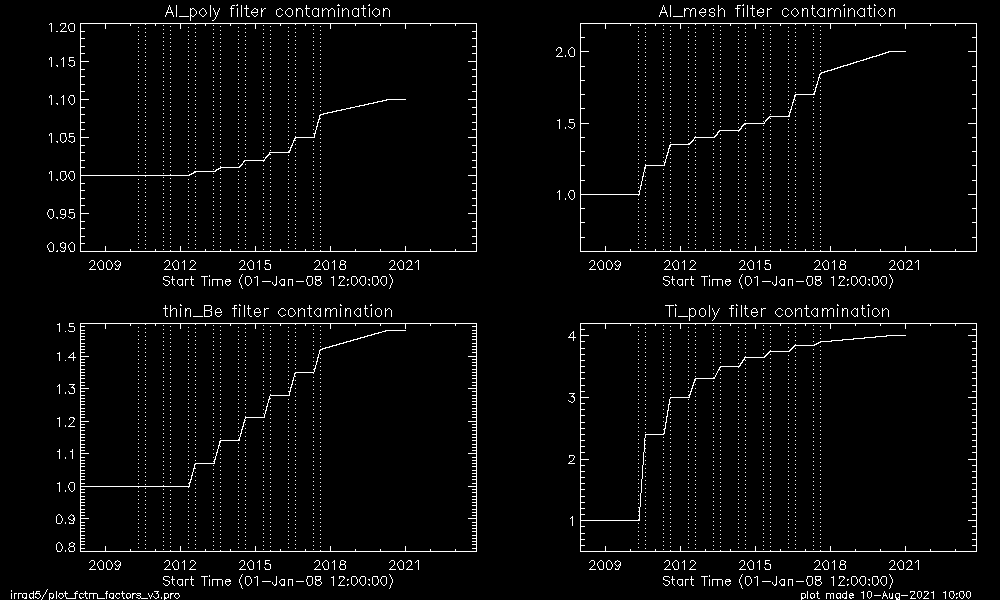
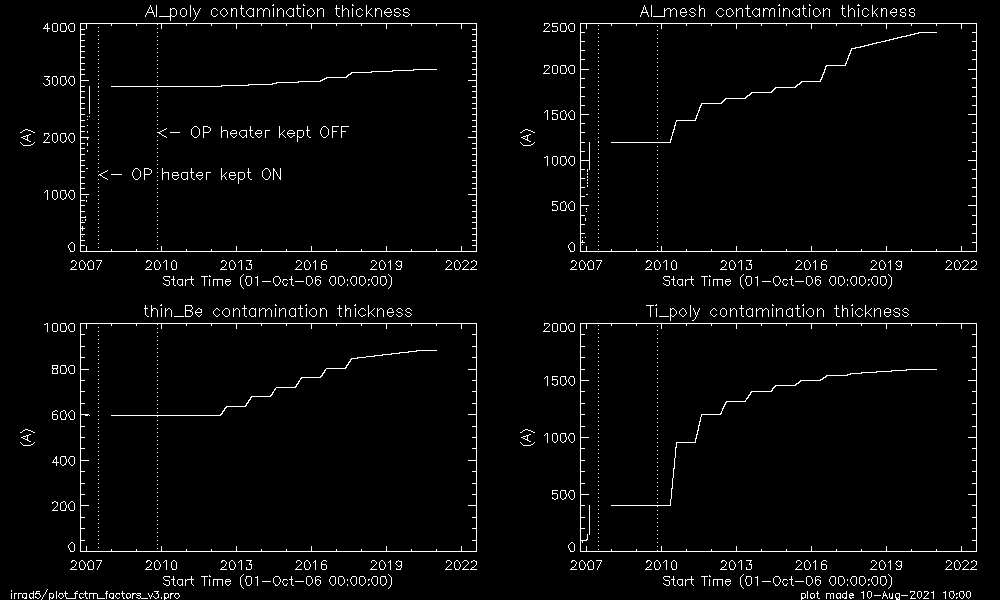
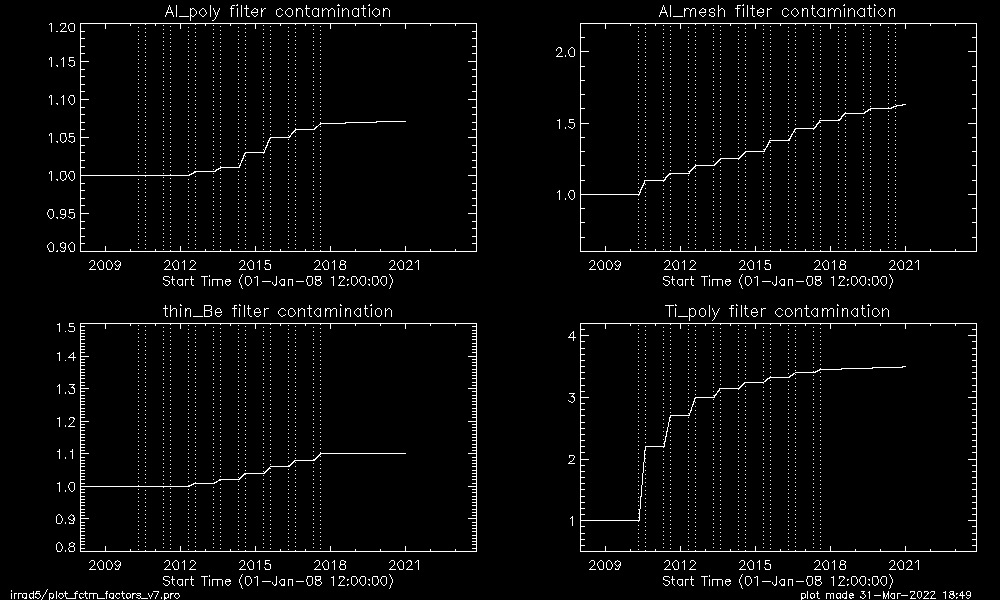
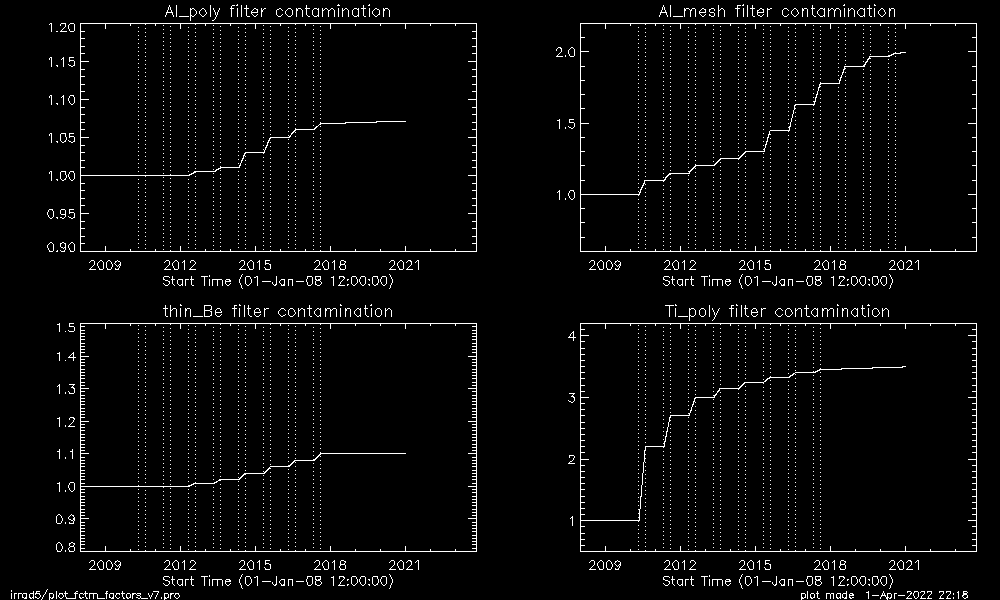
Attempt 1 : full stray light correction + strong filter contam.
Assumed FPAF contamination thickness:
| factor relative to the last value of curent DB |
converted to the thickness |
|
|
Derived Te, EM and irradiance (5-60A)
multi-plot (irrad, Te & EM)
* Ti_poly/Al_mesh filter ratio curve problem with large amount of contamination:
examples 1
and 2 .
We could barely determine the pairs of filter contamination thickness that
yield reasonable curves of Te, EM, and Irrad.
[status as of the 2021/10/26 meeting]
approach 2: Stray light might not affect XRT effective area
Possibility 1: It is possible that entrance filter holes cause
higher apparent visible light open area than X-ray open
area, because of differences in how white light and X-rays
scatter in the telescope.
(a comment from Engineering team,
via K. Reeves on 29-Sep-2021)
However,
we should apply the stray light correction
to some extent , otherwise results in unrealistic EM variation
(the lowest values in 2017 are lower than those during the solar minimum,
2019-2020, as shown in the above left plot).
[Follow-up of the 6-Oct meeting]
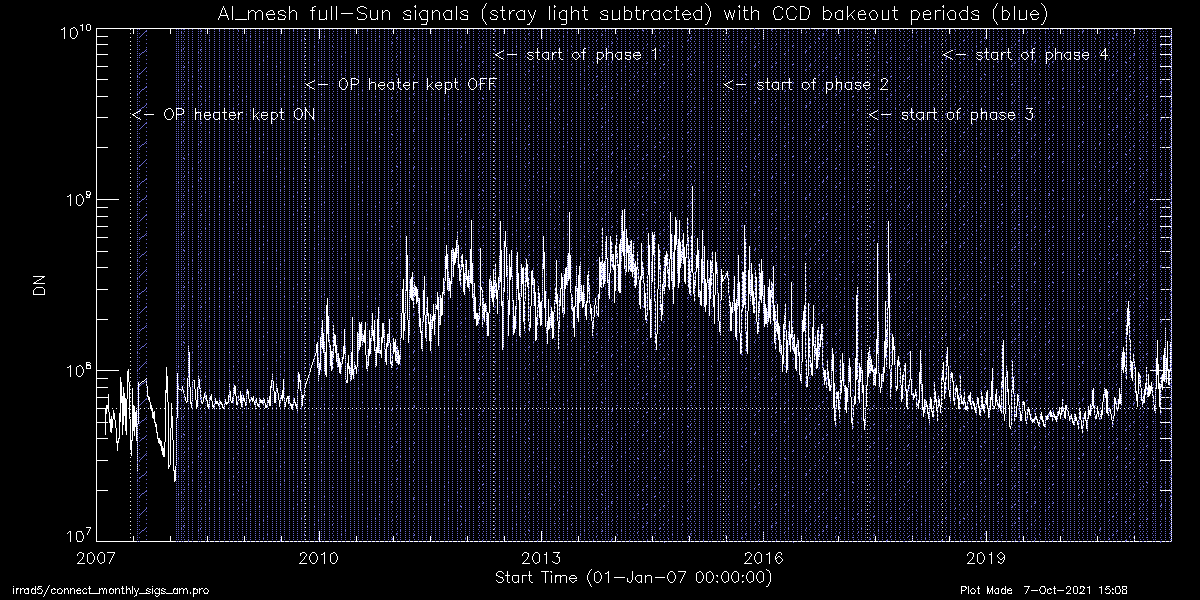
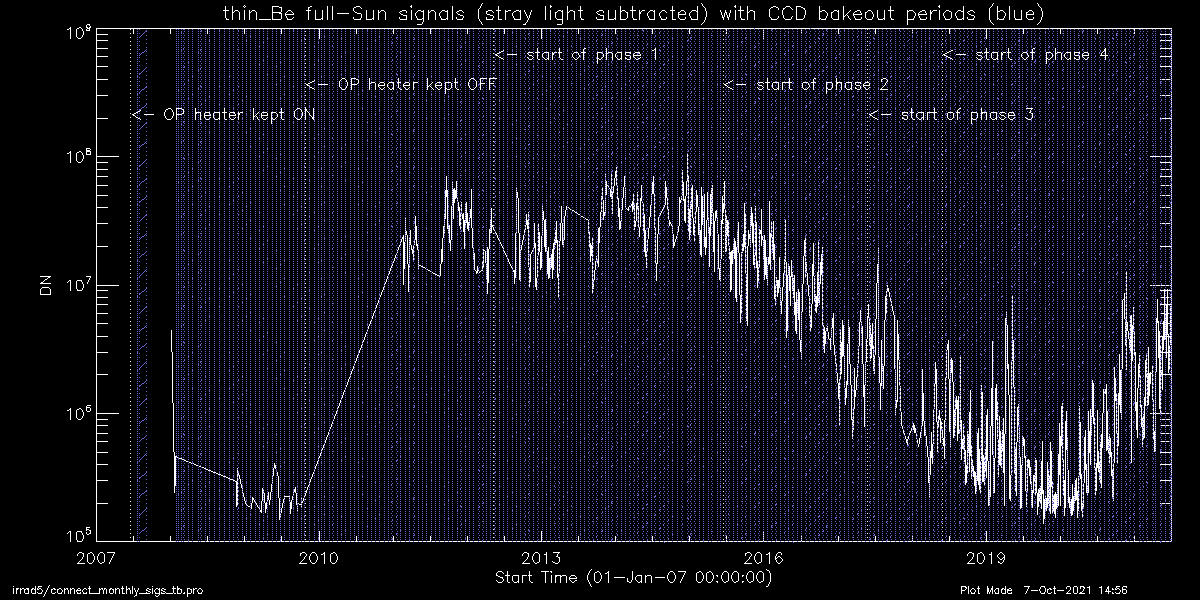
Variation of the full-Sun signals(DNs) with different filters :
Al_mesh singals are prone to attenuate by contamination
(after 2017).
* Al_mesh, Ti_poly and Al_poly plots were made from the
current irradiance study.
* Thin_Be signals were measured by my 2021 REU student, Stefanie Davis.
* Al_poly data points (2008-2015) can be increased by additional work.
| Al_mesh | Ti_poly |
|

|
| Al_poly | Thin_Be |

|
|
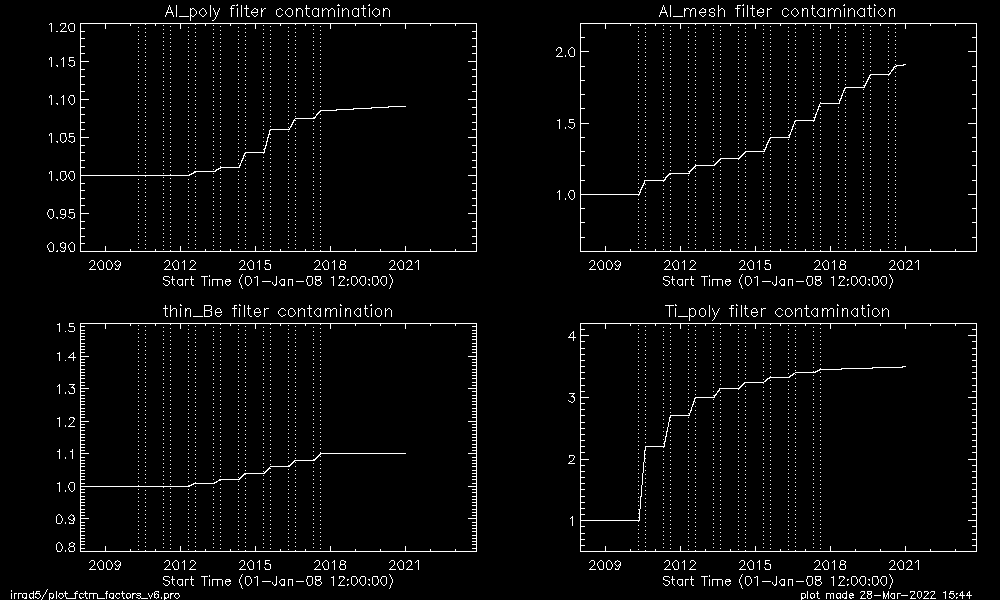
Attempt 2 : mild stray light correction + mild filter contam.
Chianti 9.0 version NOT tried.
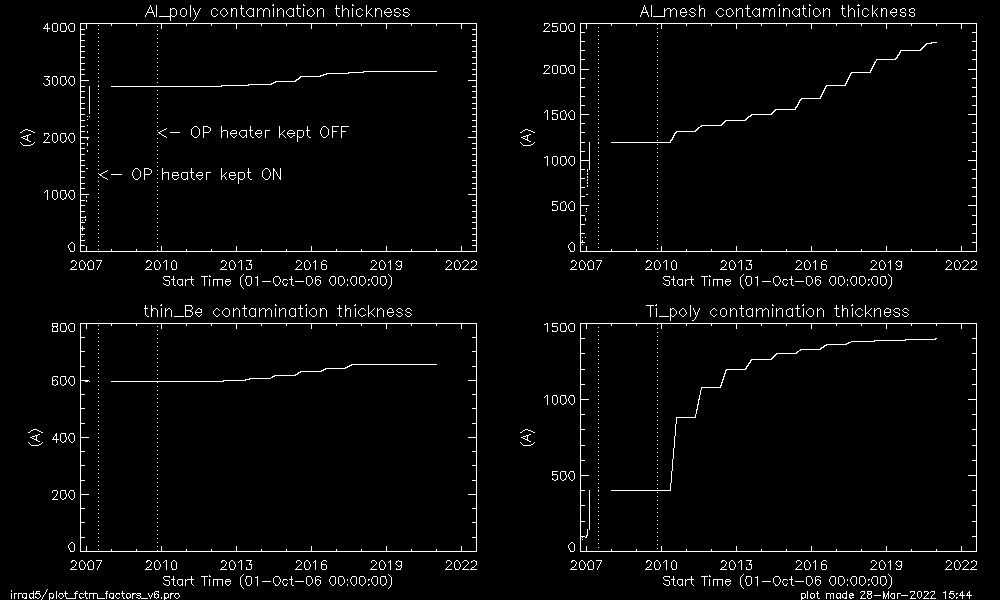
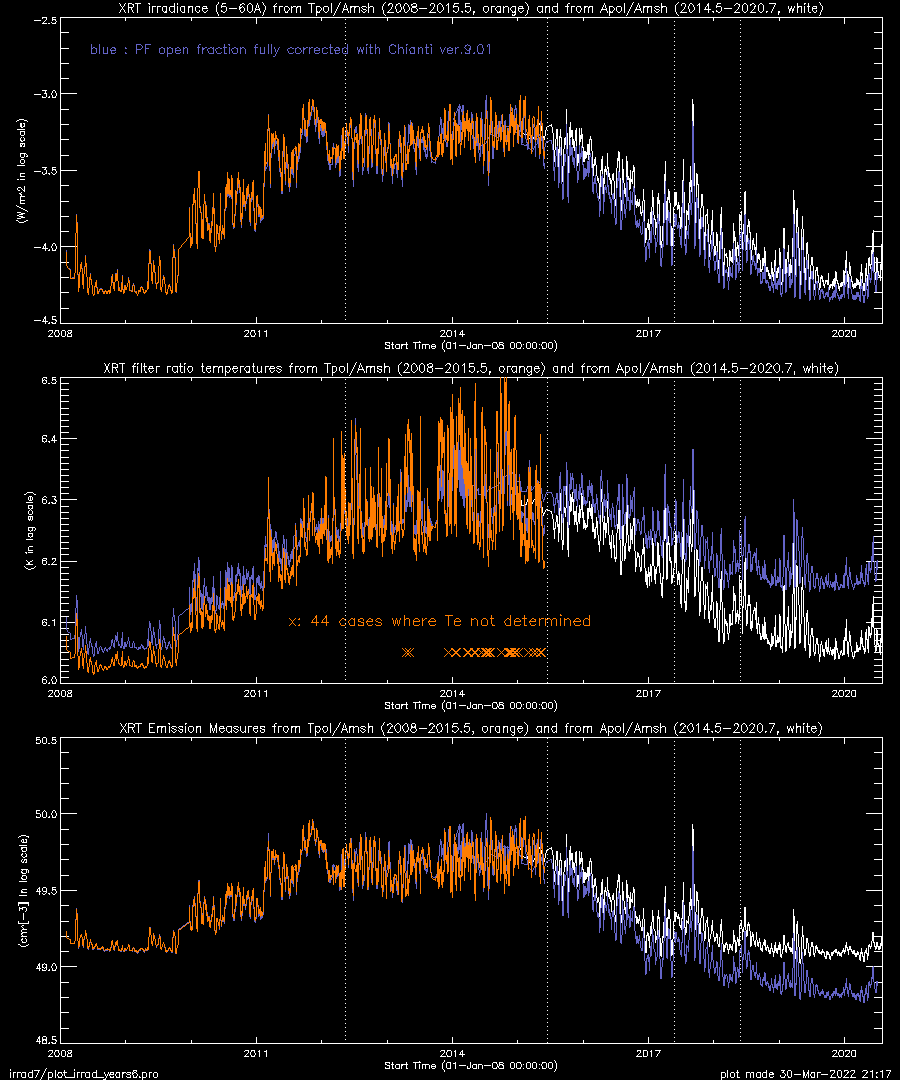
Attempt 3 : mild stray light correction + mild filter contam.
with Chianti ver.10.0
Reduced pre-filter open fraction applied:
phase 0: ofrac(i)=0
phase 1: ofrac(i)=0.001 --> 0
phase 2: ofrac(i)=0.033 --> 0.033*0.50
phase 3: ofrac(i)=0.075 --> 0.075*0.70
phase 4: ofrac(i)=0.099 --> 0.099*0.80
| factor relative to the last value of curent DB |
converted to the thickness |
|
|
| Fig. IrTeEM_3 |
|
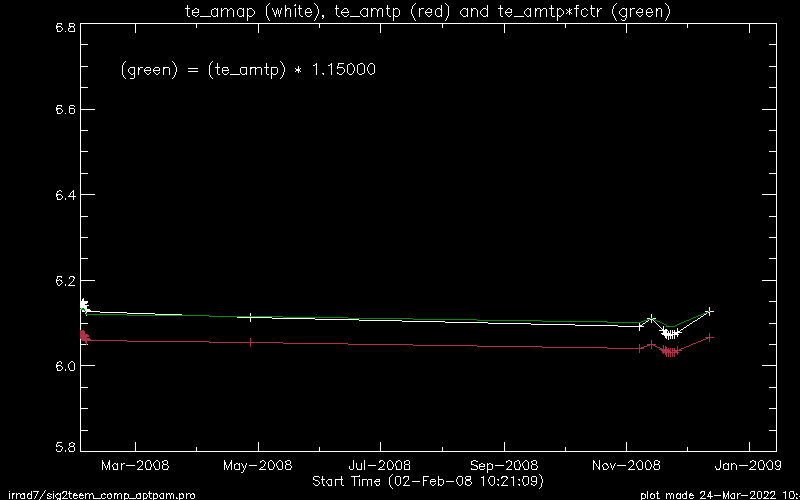
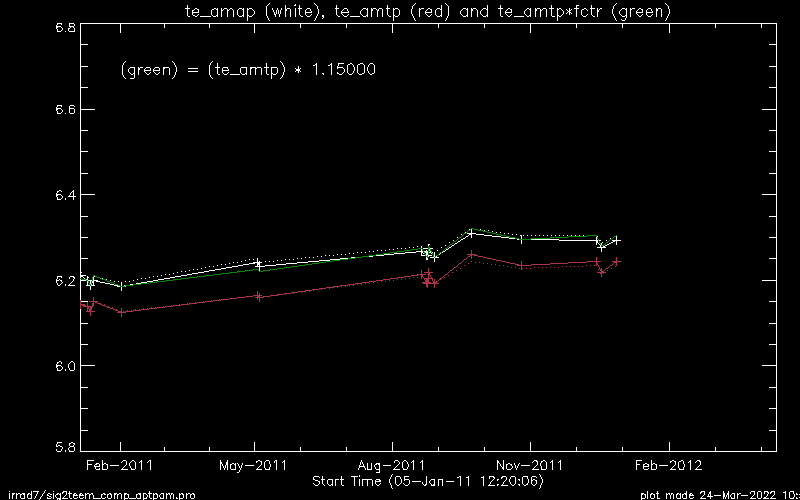
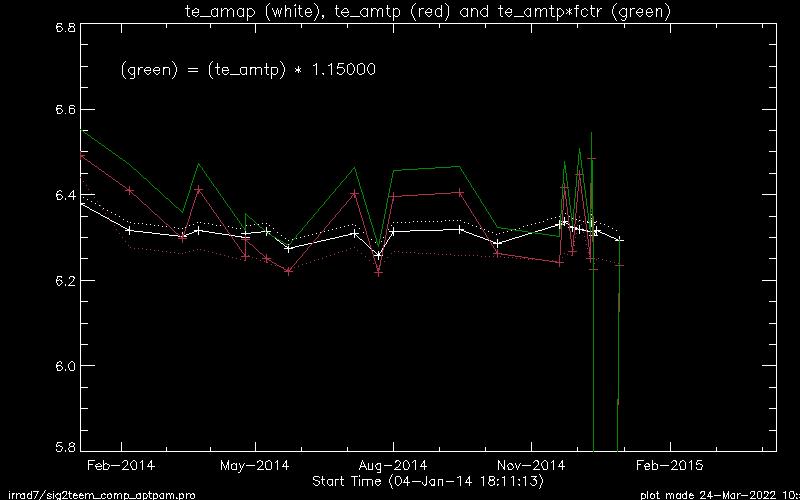
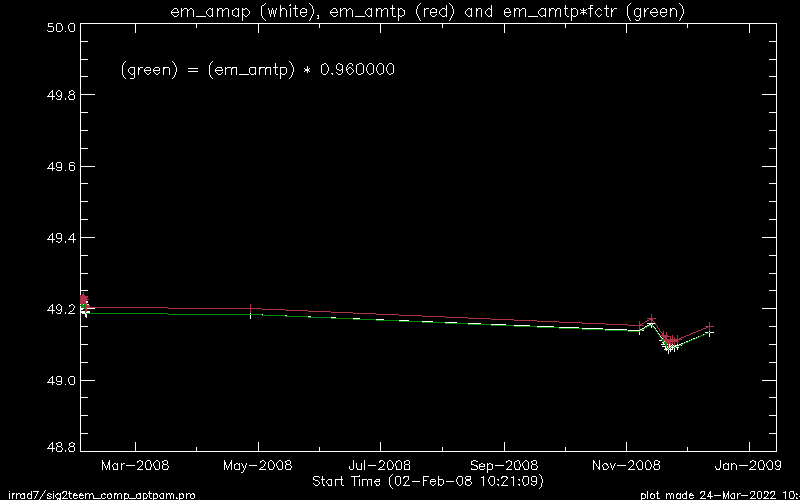
Attempt 4 : Consideration of different filter pairs used before/after
phase 2
So far it has implicitly been assumed that the filter pairs Ti_poly/Al_mesh
(used for phase 0 and 1) and Al_poly/Al_mesh (phase 2 to present) will
give consistent Te and EM without any correction. But recently a comparison
of Te and EM obtained from Ti_poly/Al_mesh and Al_poly/Al_mesh filter
using the data all obtained +/- 7 minutes was made.
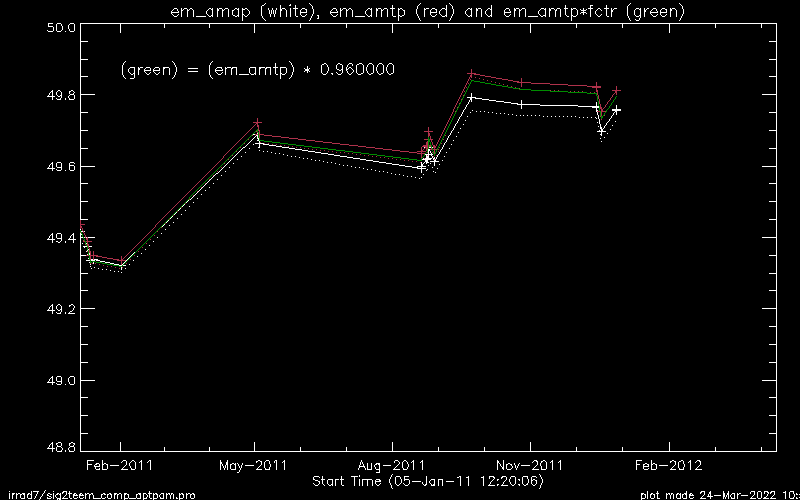
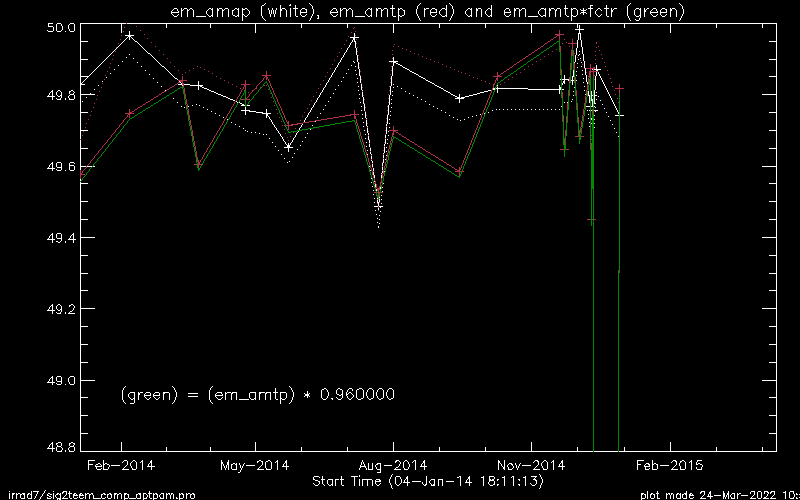
| 2008 (phase 0) | 2011 (phase 0) |
2014 (phase 1) |
|
|
|
|
|
|
| Calc. with Chianti ver.9
Te
and EM
| Calc. with Chianti ver.9
Te
and EM
| Calc. with Chianti ver.9
Te
and EM
|
An attempt to get the
mission-long Al_poly/Al_mesh equivalent Te and EM .
- phase 0
- [new Te] = [Te_tpam] * 1.15
(→ 1.10 modified in the plot below)
- [new EM] = [EM_tpam] * 0.96
(→ 0.98 modified in the plot below)
- phase 1 : no change
- phase 2-4 : no change (of course)
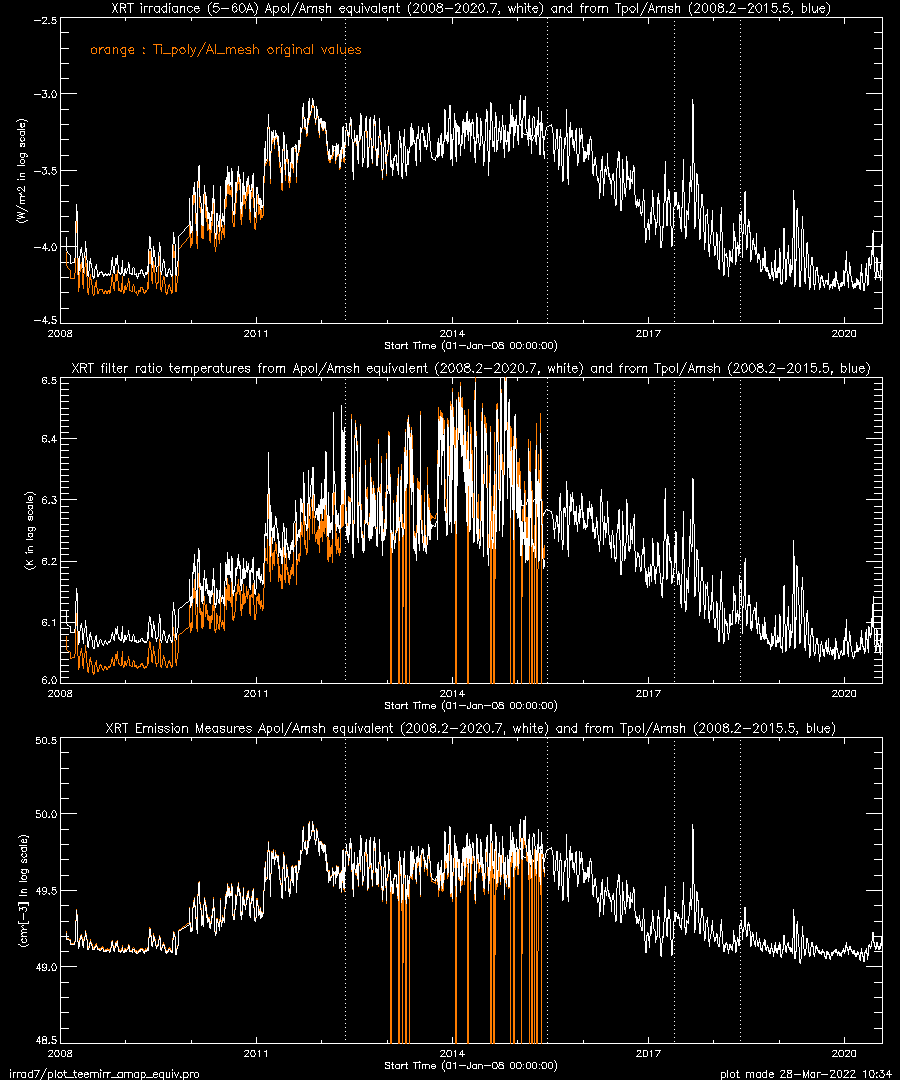
The new irradiance for the phase 0 is to be calculated from the new Te and EM.
It turns out that this attempt fails:
Te and irradiacne become too high
(even with the reduced version of the factor).
| Fig. IrTeEM_4 |
|
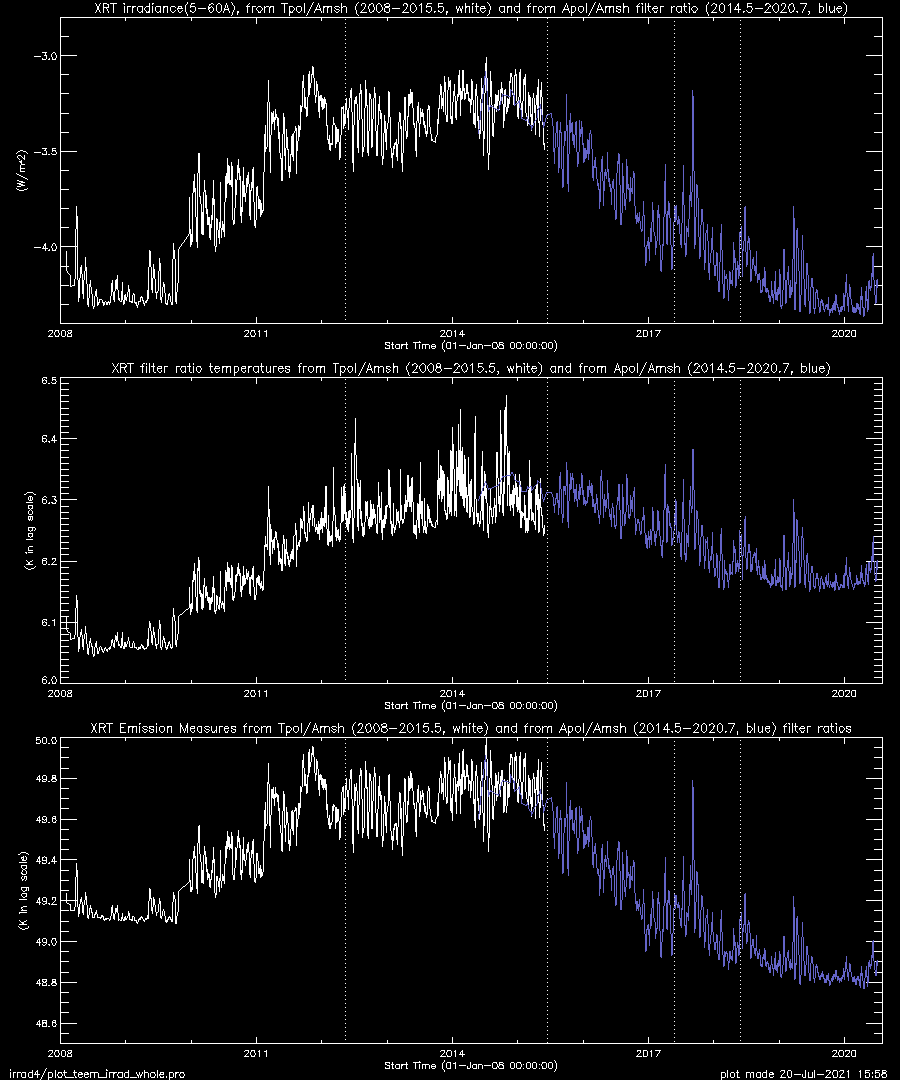
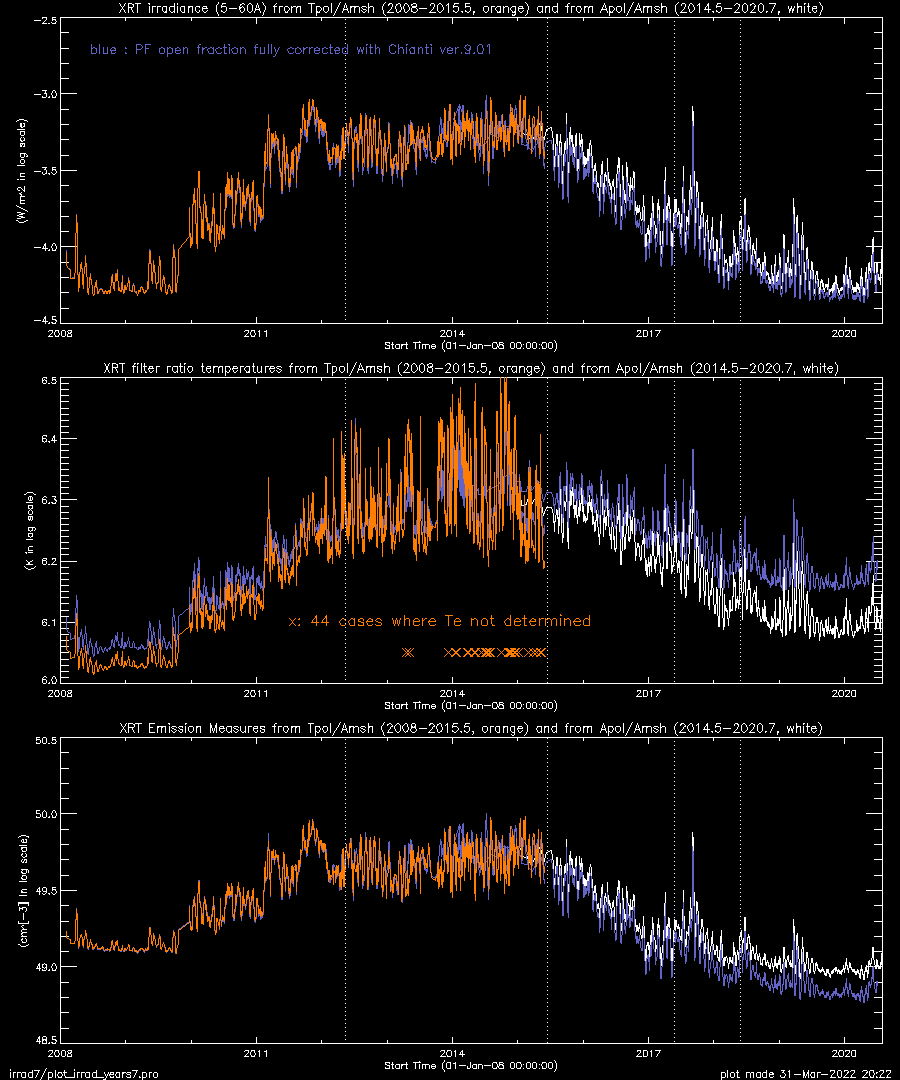
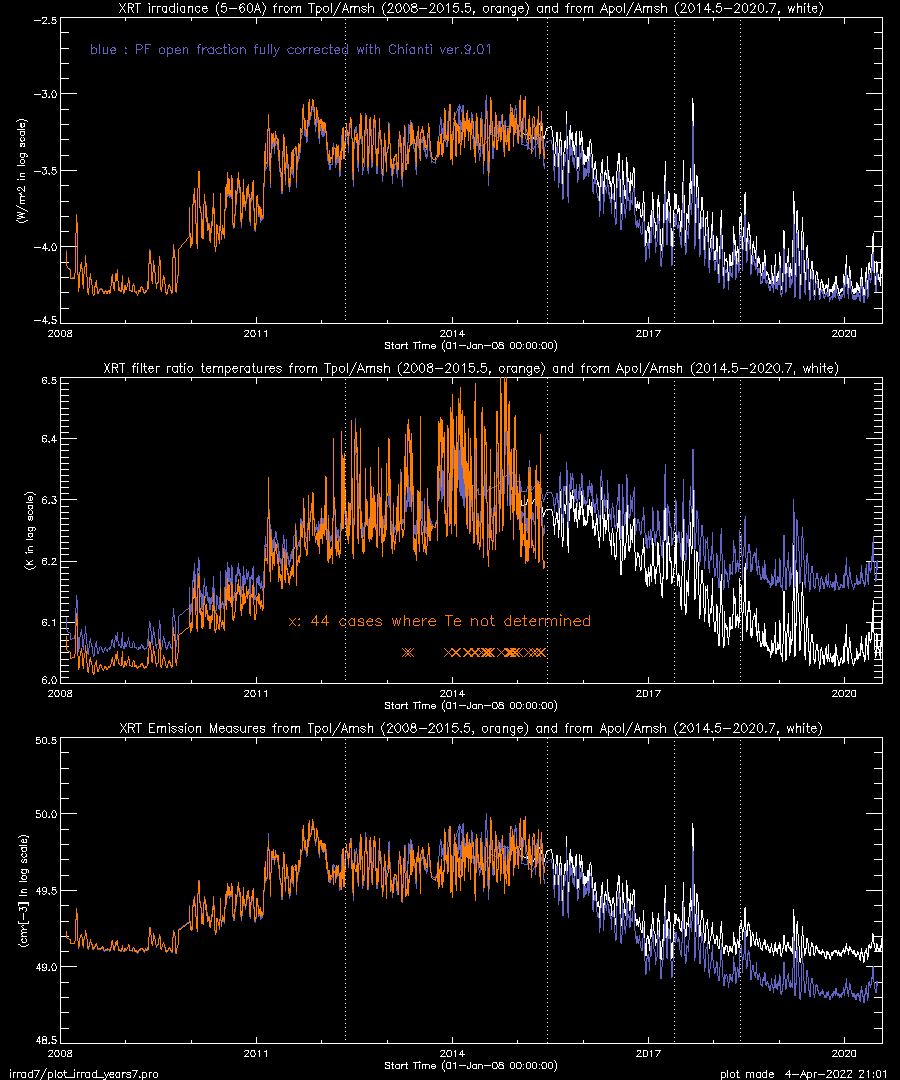
Attempt 5: Back again to full
stray light correction.
| get highest Te but EM too low (ver. b) |
get low Te and highest EM (ver. a) |
|
|
| Fig. IrTeEM_5b | Fig. IrTeEM_5a |
|
|
Both versions (a and b) turned out not favorable for the idea of
"Al_poly/Al_mesh equivalent irradiance". But ver.(a) gives the
same level of Te, EM, and irradiance for the past two minimum
periods (around 2008 and around 2019), so a good candiate
of our final irradiance products.
New addition
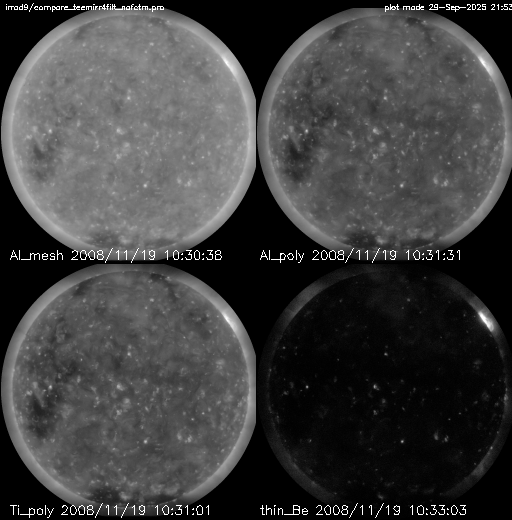
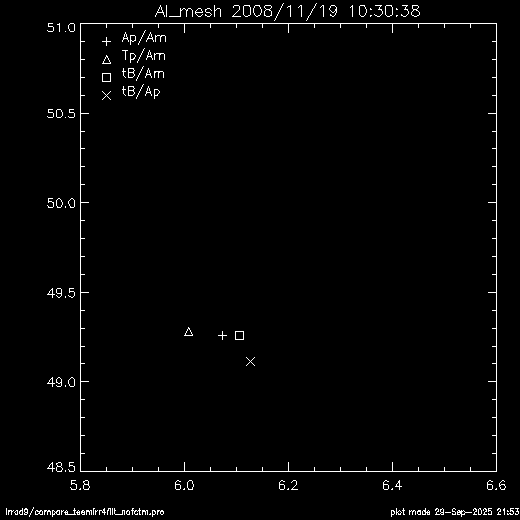
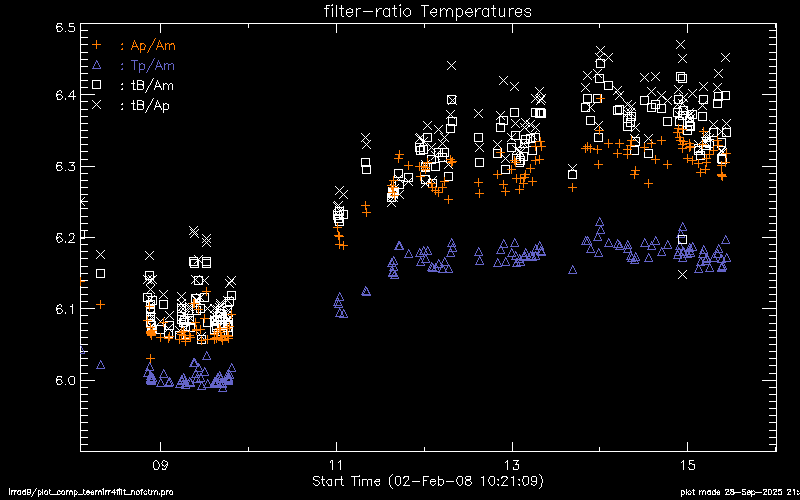
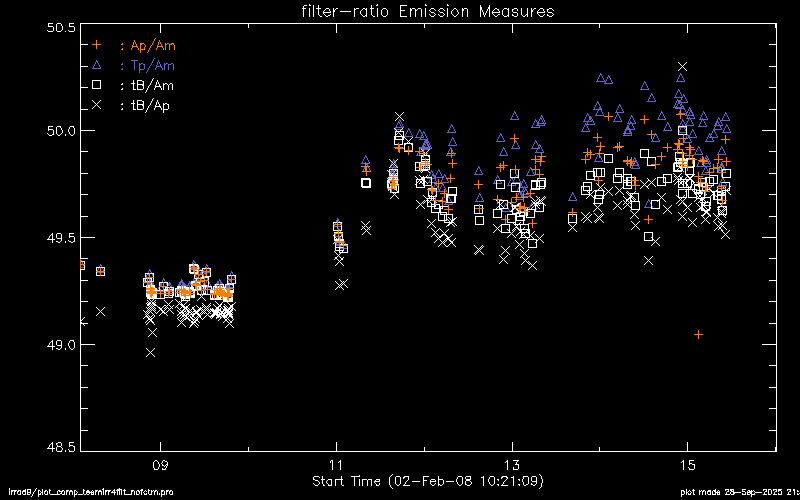
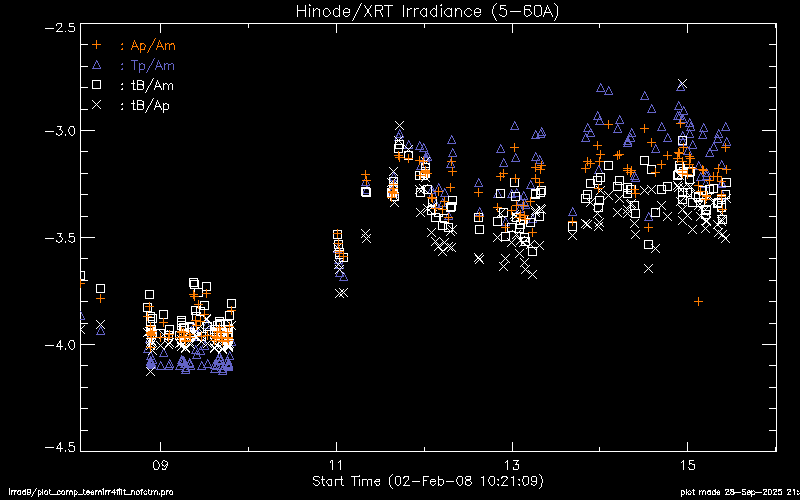
Comparison of 4 different filter ratios :
Al_poly/Al_mesh, Ti_poly/Al_mesh, thin_Be/Al_mesh & thin_Be/Al_poly
- taken on the same day within one single synoptic program.
- no stray light correction, no filter contamination correction.
- calculated with Chianti ver 10.10, coronal_2021 abundance.
- 174 sets found during 2008.1 --- 2015.6
