Link to
the page of previous study .
Link to the draft PDF .
Link to the response file to the referee comments .
Link to the
Hinode-13 poster PDF .
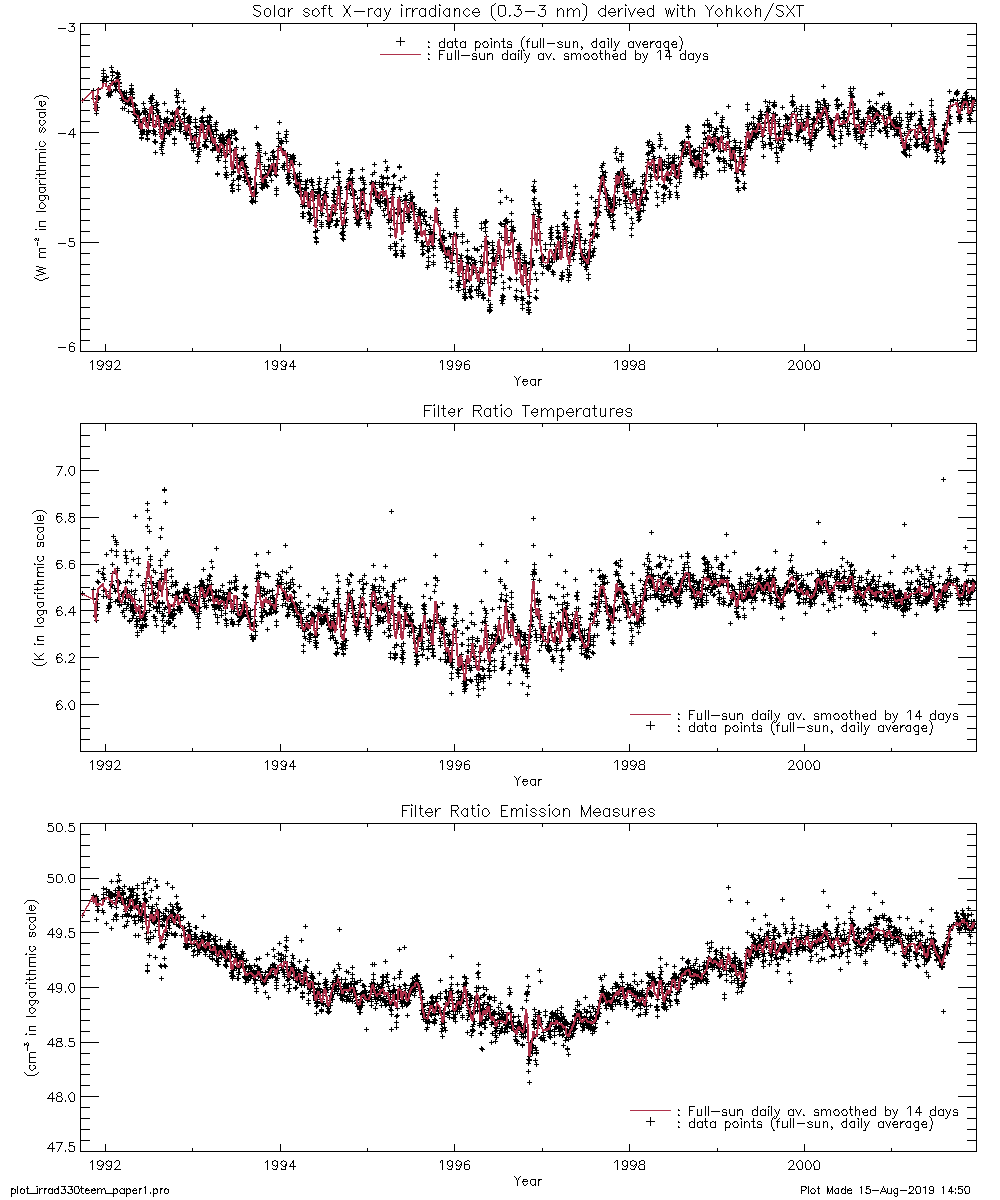
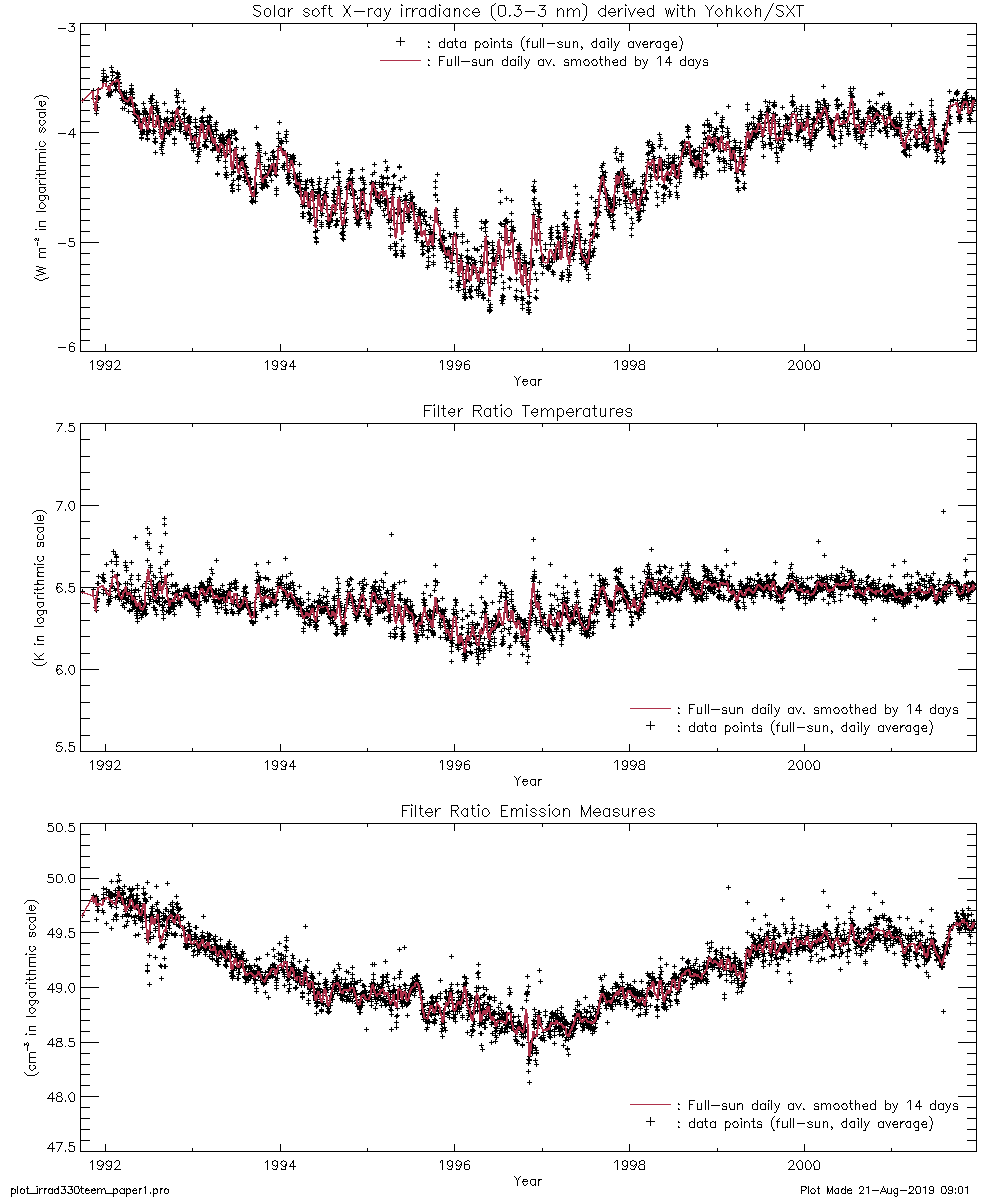
We present our mission-long variation of filer-ratio temperatures and emission measures in the plane of log_Te (K) and log_EM (cm^-3). The daily averaged temperatures and emission measures in 1992 near the solar maximum located around (6.5, 49.5), moving toward around (6.25, 48.7) in 1996 at the solar minimum then turning back to the previous values in 2000 at the maximum phase. Our calculation assumes so-called 'hybrid' type elemental abundances. By assuming traditional coronal abundances, the temperatures show no significant difference, while the emission measures result in 30 to 45% lower values. The irradiance calculated assuming the coronal abuncances has no significant difference or less than 5% higher values compared the the result from assuming the hybrid abundances.
The soft X-ray irradiance for the shorter wavelength range was also calculated to compare with the low energy channel (0.1-0.8nm) of the X-Ray Sensor(XRS) aboard the Geostationary Operational Environmental Satellite system (GOES). It turned out that the SXT irradiance calculated for the 0.1-1.0nm range yields the closest flux level for the GOES/XRS 0.1-0.8nm flux when the solar activity is medium to high. Around the solar minimum, the flux from GOES/XRS went under the detection limit for most of the time, while the SXT signals still hold valid information. The SXT irradiance therefore can be used for the correction of the GOES/XRS flux around the period of solar minimum.
The use of full-Sun integrated signals for the irradiance study gains photometrical advantage, but trades off the spatial infomation of the corona. To incorporate the spatial information, we tried the alternative method by applying the filter ratio technique to the coronal images instead of spatially integrated signals. We used only Northern hemisphere data for the better photometry, and compared the results with the corresponding values derived from the spatially integrated signals. It turned out that the emission-measure weighted average of the spatially resolved temperatures are generally 20 to 30% lower than those derived from the integrated signals, and that the total of spatially resolved emission measures are accordingly 1.5 to 2 times higher. This trend is enhanced when Sun's activity level is the lowest in early 1996. The SXT irradiance calculated from the spatially-resolved data is within 10% difference from the one derived from the spatially integrated signals, but near the solar minimum, the irradiance from spatially resolved data is ~50% lower than that from the integrated signals.
From the temperature maps of the corona, we derive the mission-long variation of the total emission measures of cool(less than 1.5MK), medium(1.5 to 2.5MK) and hot(more than 2.5MK) temperature components. The solar-cycle variation of these components are also discussed.
The soft X-ray telescope (SXT) on board the Yohkoh satellite observed the Sun through the descending phase of the Cycle 22 and the rising phase of Cycle 23 (Tsuneta et al, 1991, Ogawara, et al, 1991). The SXT was the only imager of the Sun in the soft X-rays (0.3 to 3.0 nm) throughout its operating period, September 1991 through December 2001. The SXT was equipped with 5 broadband X-ray filters, which are designed to diagnose coronal plasma of the temperature from under 1MK to over 10MK.
The initial attempt to derive the soft X-ray irradiance from the SXT data was performed in Acton et al.(1999), in which they showed that the filter-ratio temperatures obtained for various coronal structures were generally in good agreement with the mean temperature of observed differential emission measures collected by Bruner and McWhirter (1988). The final product of SXT irradiance data were, however, not published, because the further calibration of visible stray light contamination resulted from the SXT pre-filter failure turned out to be crucial for the determination of the signals from the mission-long X-ray filter images.
Peres, et al (2000) carefully applied the filter ratio technique to the SXT full-Sun images to derive the temperature variation of the emission measures integrated along the line of sight. The object of their study is to translate SXT observations into a format of stellar observation by X-ray instruments. Their analysis are based on 7 pairs of images observed from 1992 to 1994 and not intended to study the variation over the whole activity cycle.
After Yohkoh ceased its scientific operation in 2001, all usable data products from the Yohkoh project were re-calibrated, classified and maintained in the Yohkoh Legacy data Archive (YLA; Takeda, et al, 2009), which is the source of data of this study. The SXT data in the YLA has significant advantage over those regularly archived along the mission in the following respects: (1) correction of the stray light contamination and the satellite attitude database were significantly improved (Acton 2017). (2) CCD gain was updated to 90 electrons/DN from its initial value, 100 electrons/DN. (Acton 2017). (3) SXT response functions were updated using more recent atomic data (Takeda, 2011). As of the time of this study, CHIANTI ver. 8.0 (Del Zanna, et al, 2015) was used for calculation, whereas SXT's former official response functions were based on Mewe et al.(1985, 1986). (4) most recent correction of the SXT response functions considering the diminishing X-ray sensitivity experienced during the first 15 months of the mission (Acton 2018) was implemented. (5) analysis software was upgraded in accordance with these changes.
In this paper, we presents the solar soft X-ray irradiance obtained from the mission-long full-Sun X-ray images from the YLA. The irradiance was derived through the filter-ratio temperatures and emission measures of the full-sun integrated signals with the guide of coronal spectrum synthesized with CHIANTI atomic database version 8.0. The wavelength range of our primary product is from 0.3 to 3 nm, where SXT's thin filters used in the analysis are most responsible. Observation with this wavelength range is unique and not observed by any other instruments during the period of the Yohkoh mission.
For the purpose of making a comparison with other instrument, we calculate the irradiance for the similar wavelength range as the low energy channel of the X-Ray Sensor(XRS) aboard the Geostationary Operational Environmental Satellite system (GOES) operated by National Oceanic and Atmospheric Administration (NOAA). The comparison is made by the use of the seamless GOES/XRS data archive prepared by the YLA (see subsection 2.3 for details). Results are given in the subsection 3.3.
Finally, we apply the filter-ratio technique to images, not to full-Sun integrated signals. It is photometrically challenging, especially because SXT experienced the stray light contamination since November, 1992. Careful selection of data allows us to derive the spatially resolved Te and EM of the observed corona. The results are discussed in the section 4.
The steps of the image processing are as follows:
| Year | # of Al.1 img. | # of AlMg img. | # of available pairs | # of days with pairs | Avr. # of pairs per day | |
| 1991 | 3213 | 793 | 336 | 23 | 15 | |
| 1992 | 14979 | 10070 | 6937 | 319 | 22 | |
| 1993 | 10915 | 21189 | 8948 | 344 | 26 | |
| 1994 | 10599 | 22216 | 8818 | 347 | 25 | |
| 1995 | 8910 | 23411 | 7749 | 342 | 23 | |
| 1996 | 10145 | 23514 | 8978 | 346 | 26 | |
| 1997 | 9888 | 23549 | 9035 | 338 | 27 | |
| 1998 | 7898 | 18495 | 6321 | 338 | 19 | |
| 1999 | 5397 | 19040 | 3415 | 319 | 11 | |
| 2000 | 4627 | 27209 | 3647 | 297 | 12 | |
| 2001 | 4931 | 23154 | 2565 | 284 | 9 | |
| total | 91502 | 212640 | 66749 | 3297 | --- |
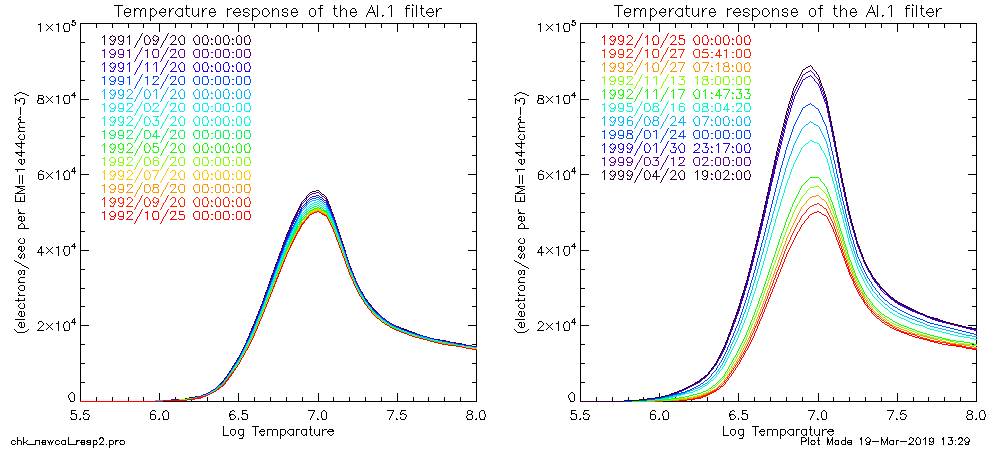
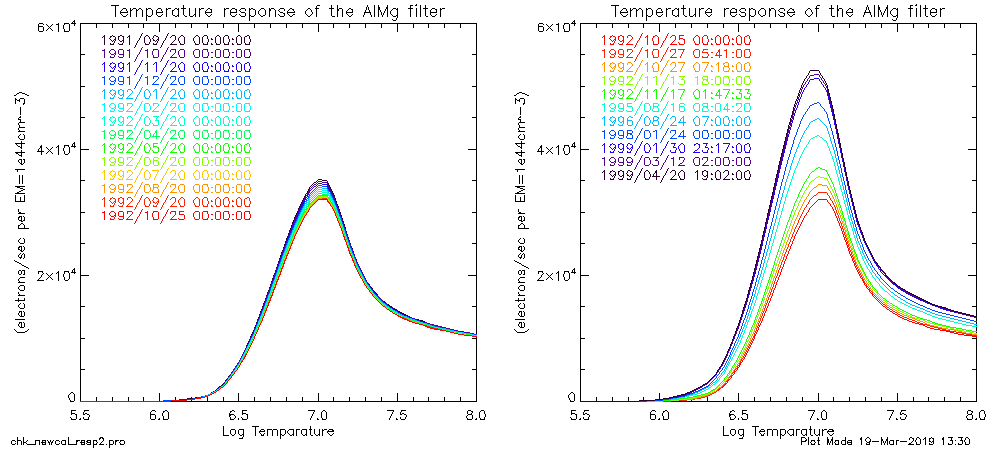
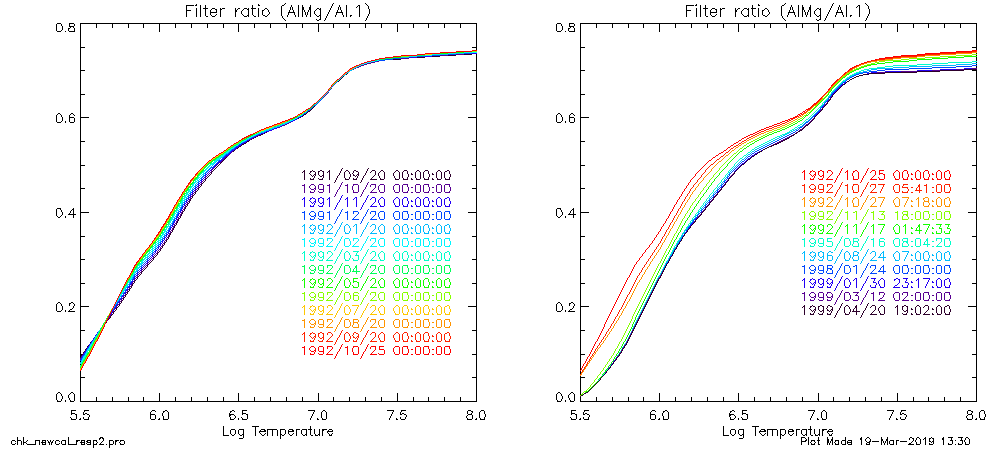
Figure 2.2 shows the temporal variation of the new SXT temperature response functions. The plots on the left column show the temporal variation from the start of the mission until 25-Oct-1992, which is shortly before the date the signature of the first pre-filter failure started to appear on 27-Oct-1992. It is considered that the growth of the absorbing layer on the pre-filter was most significant and the response curves continuously decrease over time. The modification of the SXT response functions of this period was newly introduced by Acton (2018). The plots of the right column show the variation after 25-Oct-1992 to the end of the mission. During this period, the response curves jump up at the time of the occurrence of a rupture (shown in the plots) and keep that level until the next rupture event. The growth of the absorbing material for this period was diminished to the negligible level. The modification of SXT response functions with respect to the stray light contamination had been applied in the previous studies. However, the sequence of pre-filter failures was re-examined by Acton (2018) and the timing and the amount of correction have been improved in the latest version used in this study.
 |
 |
 |
The seamless GOES/XRS data archive (1991-2001) were prepared as a project of the YLA to add convenience for the studies of long-term variation of solar activity (paper in preparation). They are essentially composite data from the primary GOES satellite of the time, based on the GOES/XRS data files under the Yohkoh database (ydb) in the SolarSoft. In 2011, those data were examined to replenish their missing records with the original data set obtained at National Geophysical Data Center (NGDC, now reorganized to NCEI) at NOAA. The time resolution is 1 min. The missing-data periods of the primary satellite data due to eclipses or engineering were replaced those of the secondary satellite as much as possible. The scaling factors applied by SWPC to the archived flux were corrected (removed) to get true fluxes for 1991-2001. (cf.https://ngdc.noaa.gov/stp/satellite/goes/doc/GOESXRSreadme.pdf)
The uncertainty included in the irradiance derived from each pair of Al.1 and AlMg images was estimated through the following steps: (1) Uncertainties of signals. The YLA level_2 uncertainty arrays corresponding to the selected Al.1 and AlMg images were used. These uncertainty arrays considers the errors introduced by decompression of the lossy compression algorithm and errors from the photon statistics (for details, see subsection 2.10 of Acton, 2016). Uncertainty of Al.1 and AlMg signals were calculated as the root sum square of the pixels of the uncertainty array corresponding to the studied area of each coronal image (i.e., within 1.2 Rs). The calculated uncertainty for each image is generally very small (less than 0.1%) for the full-Sun integrated signals. (2) Uncertainties of Te and EM were calculated by the IDL program, sxt_teem.pro as the propagation of the uncertainty of signals to the filter-ratios. The obtained uncertainties, d_Te and d_EM differ with the phase of the mission, but roughly distributed around 0.2% and 0.8%, respectively. (3) Uncertainties of irradiance were estimated using the lower and higher limit of Te and the corresponding values for EM.
    Te_lw = Te - d_Te
    Te_hi = Te + d_Te
    EM_lw = EM - d_EM
    EM_hi = EM + d_EM
The lower limit of the irradiance was defined as the irradiance
calculated with Te_lw and EM_lw, while the higher limit was
defined as the one calculated with Te_hi and EM_hi.
The resulting uncertainty of the irradiance, defined as the ratio
with the irradiance calculated with the original Te and EM, turned
out to be ~3% for both lower and higher cases.
The SXT standard analysis routine (e.g., sxt_prep.pro) does optionally correct the visible stray light contamination, which the Al.1 filter images suffered most significantly since November, 1992. However it is not included in the process of estimating uncertainty, because there is no general way to quantify the amount of the error. In this study, we estimated the uncertainty of the stray light correction in the of following way: The uncertainty of the Al.1 signals was artificially increased to the value of 1.0%, while the uncertainty of AlMg signals remained unchanged. This increased uncertainty of Al.1 signals turned out to propagate to the uncertainty of Te and EM, as ~1.5% and ~6.0%, respectively. These increased uncertainties were used to estimate the uncertainty of the irradiance with the method described in the step (3) in the above. The resulting uncertainty of the irradiance turned out to increase to the values, 20 to 30%.
comp_unc_integirrad_1991.png
(with unc_al=sig_al*0.01)
comp_unc_integirrad3_1991.png
(with unc_al=sig_al*0.02 & unc_am=sig_am*0.01)
comp_unc_integirrad4_1991.png
(with unc_al=sig_al*0.03)
comp_unc_integirrad_2000.png
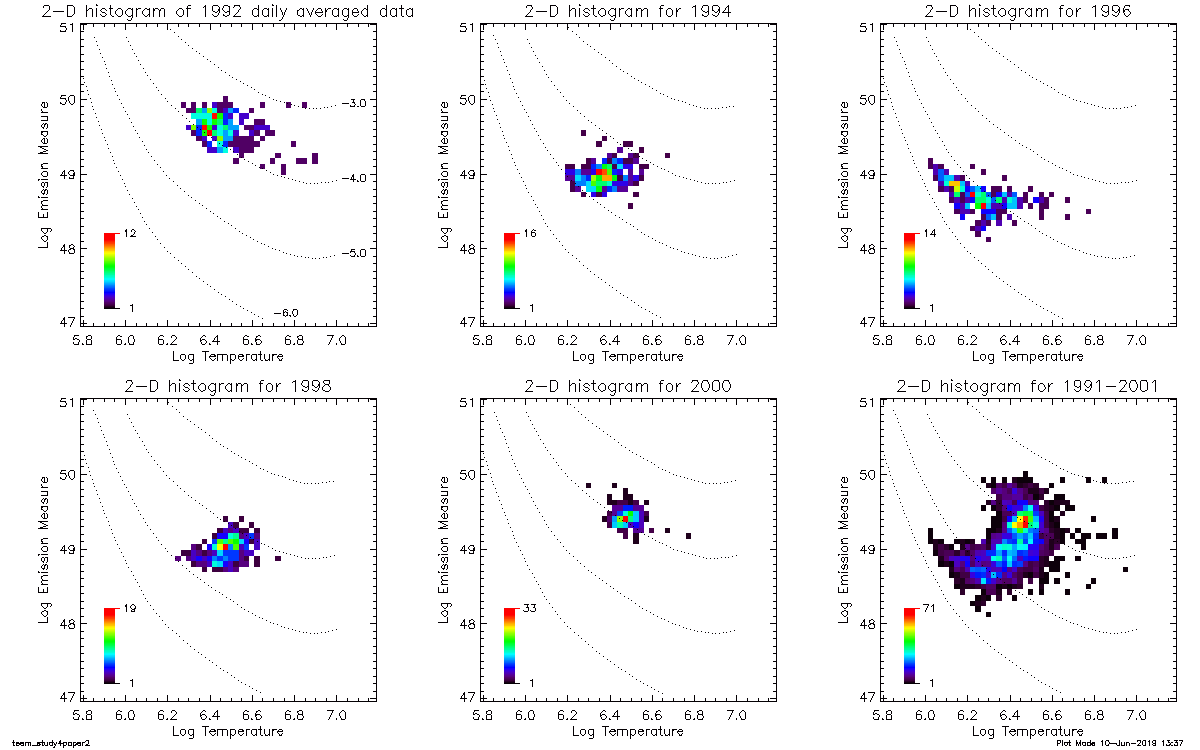
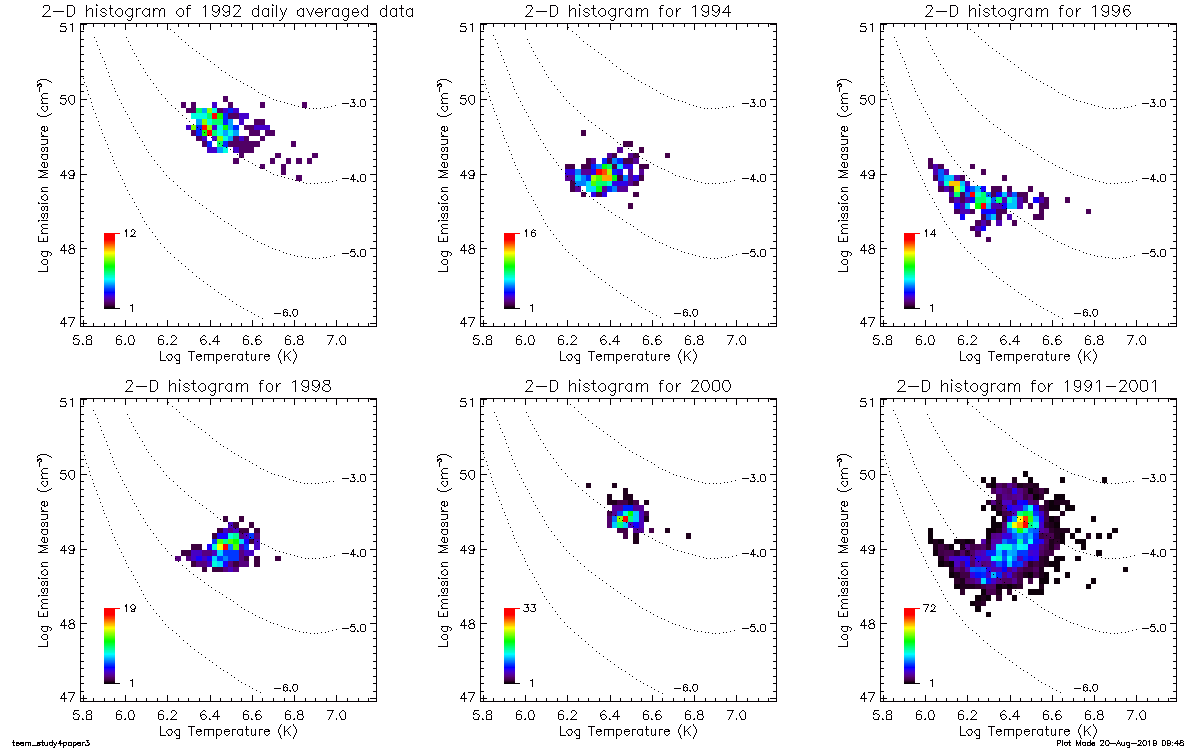
The Figure 3.2 shows the distribution of the daily averaged filter-ratio temperatures (Te) and and emission measures (EM) in the form of 2-dimensional histogram. The bin size of the histogram along the Te-axis is 0.025 (K) in logarithmic scale, while the corresponding value along the EM-axis is 0.075 (cm^-3) in logarithmic scale. The yearly 2-D histogram of every other year since 1992 indicate that near solar maximum (1992) data points (Te, EM) distributed at the position centered around (6.47, 49.7) in the plane of log_Te and log_EM, moving toward the position around (6.29, 48.9) at the solar minimum then turning back to the previous values at the maximum phase. It is noticeable that 1996 data points form a sharp edge at their lower left portion in parallel with the curves giving the same irradiance values (dotted curves in the plots of Fig. 3.2). Those data points on the edge came from the periods the Sun was free from active regions and had least intensity fluctuation. During such periods, SXT signals were at the lowest level and thus small errors in signals had the highest impact on the temperature analysis. We consider that the edge was mainly formed by the the intensity fluctuation of Al.1 images due to the stray light contamination, while the AlMg intensities were kept stable.
When the SXT signal level was the lowest, 40 to 50% of the analyzed pixels in the image have the signal to noise ratio (defined as the intensity ratio of coronal to uncertainty data) less than 2. Such pixels are typically in the areas where the intensity, temperature, and emission measure are all low, and thus contribute insignificantly to the irradiance. However, we notice in several cases that the spiky noises in these areas contribute to raise the full-Sun averaged temperature and the resulting irradiance value. We therefore consider that the true minimum value of the SXT daily averaged irradiance may be lower than the value shown in the plot for 1996 in Fig. 3.2 (roughly -5.6 W/m^2 in log scale). More reliable value of the minimum SXT irradiance can be obtained by the spatially resolved approach discussed in the section 4.
Recently Brooks et al.(2017) reported that the FIP bias (ratio of coronal to photospheric abundances) of the global corona highly correlates with the F10.7cm radio flux and thus solar magnetic activity. The FIP bias they derived was ~2.5 when the solar activity is low in 2010, and it reached above 3.5 as the activity increased since 2012. It is therefore useful to compare the results obtained by assuming different type of elemental abundances. In this subsection, we make a comparison among the following three elemental abundance sets provided by CHIANTI atomic database (for details, see the notes given at the end of each abundance file in the CHIANTI data base):
(1) sun_coronal_2012_schmelz_ext.abund : Assumed by default
in this study. The latest version of hybrid abundance set
based on Schmelz et al. (2012). Denoted hereafter as 'hybrid'.
(2) sun_coronal_1992_feldman_ext.abund : Traditional coronal
abundance set based on Feldman et al. (1992). Denoted as 'coronal'.
(3) sun_photospheric_2011_caffau.abund : The latest version
of photospheric abundance set based on Caffau et al. (2011).
Denoted as 'photospheric'.
The different assumptions of elemental abundances affect the filter-ratio temperatures and emission measures through the instrumental response function, which varies with the elemental abundances. Regarding the SXT, the relative positions of the filter ratio curves derived from different abundance assumptions varies with the time of observation and also the temperature range of the observed data. Figure 3.3 shows the filter ratio curves derived from the different abundance assumptions for 1992, 1996 and 2000, as sample years. For a given filter ratio value, assuming the photospheric abundance tends to provide the lowest temperature. The coronal and hybrid abundances yield the similar temperature values at higher temperature range (logTe > ~6.4), while coronal abundance result in the lower temperature at the lower temperature range.
The scatter plots of the daily averaged temperatures(Te) and emission measures(EM) obtained from the above three different abundance sets are shown in Figure 3.4. The sample years correspond to those in Figure 3.3. The plotting range of Te and EM was set the same as in the plots in Figure 3.2. Compared with the results from assuming the hybrid abundance, 30 to 45% lower emission measures are calculated by assuming the coronal abundance. The photospheric abundance on the contrary, yields 15 to 30% higher emission measures.
These differences in Te and EM described in the above propagated to the SXT irradiance as follows: Assuming the coronal abundance does not make significant difference or slightly(less than 5%) higher values than the irradiance with hybrid abundance. On the other hand, the photospheric abundance raise the irradiance 10 to 20% higher than the hybrid case.


[The plots and descriptions below are not included in the paper.]
different abundances in 1992 data
comp_sref8_ama119920701_3
comp_sref8_ama119960701_3
comp_sref8_ama120000701_3
Filter-ratio temperatures
Emission Measures
Irradiances (note: different abundance sets yield different equi-irrad
curves on the Te vs EM plots.)
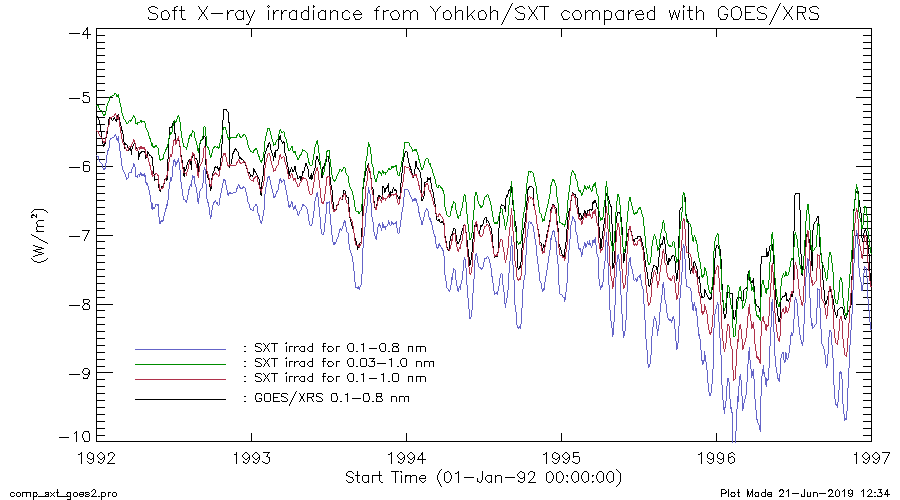
We initially calculated the SXT irradiance for the wavelength range, 0.1 to 0.8 nm. It turned out that the obtained irradiance (blue line in Figure 3.5) is significantly lower than that of XRS (black line in Fig. 3.5) : When the Sun's activity was high to moderate, the SXT irradiance is lower by a factor of 3 to 5. Around solar minimum (1995-1997), the soft X-ray flux often went under the detection limit of GOES/XRS, and thus the SXT irradiance has even lower (roughly a factor of 10) values than the flux observed by GOES/XRS.
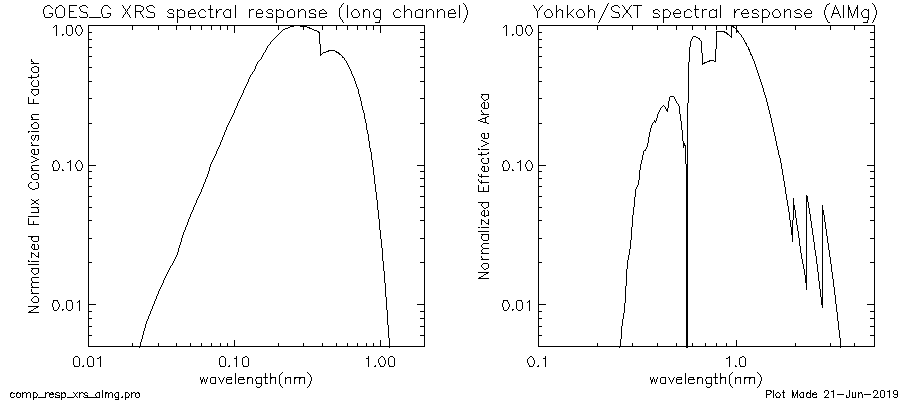
We next calculated the wavelength range, 0.03 to 1 nm, which is the width at 1% of peak response of GOES/XRS long channel (the right plot of Figure 3.6). This range is chosen in the way analogous to the case of SXT irradiance (the left plot of Fig. 3.6). For this wavelength range, the SXT irradiance is calculated significantly higher than the GOES/XRS by a factor of 2 to 4 outside the solar minimum. We also tried the calculation of the SXT irradiance with applying the GOES/XRS response to the coronal spectra (at the step 5 in subsection 2.1). However, the resulting irradiances for the 0.3-1.0 nm range yield significantly (more than a factor of 3) lower than the values of XRS irradiance.
These large difference in the absolute irradiance values between SXT and XRS are not surprising. They are different type of instruments (SXT is an imager with CCD while XRS is an ion chamber) with different spectral response (Fig. 3.6). In addition, the different spectral assumptions when converting the instrumental measurements to the physical unit of W/m^2 may affect the derived values of irradiance. The SXT assumes an isothermal coronal spectrum, while the XRS assumes a flat spectrum.
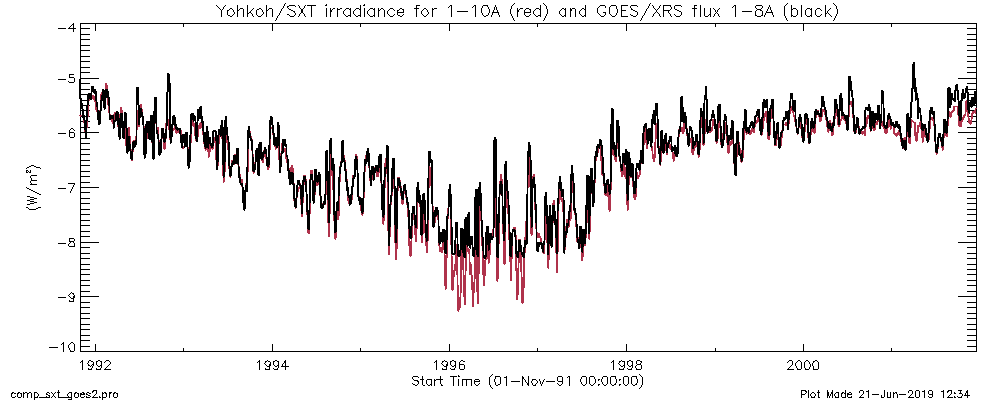
As a practical measure, we found that the SXT irradiance calculated for 0.1 to 1.0 nm wavelength range (red line in Fig. 3.5) provides comparable absolute level with the XRS irradiance apart from the period of solar minimum. The close comparison for the well-matched period shows that the major discrepancy comes from the height of peaks: XRS generally has the higher peaks than those of SXT. It is reasonable because the source data for SXT irradiance do not include those during flares due to saturation, while XRS does observe them. Anther source of discrepancy lies in the different rate of data sampling: While the time resolution of XRS data is 1 minute, SXT full-Sun images used for this study were taken 10 to 20 pairs per day and missed lots of active events. This trend is especially pronounced later in the mission (1999-2001) when the number of image pairs became less than half of that in earlier in the mission (e.g., 1992-1994, see Table 1.1 for the data statistics).
Figure 3.7 shows the mission long comparison of SXT irradiance for 0.1-1.0 nm range with the XRS irradiance. In spite of the discrepancies noted above, they are generally in good agreement outside the period of solar minimum. This indicates that the SXT irradiance for 0.1-1.0 nm range can be used as a proxy of the XRS irradiance when the solar activity level is under the detection limit of XRS.
comp_sxt_goes (for 1-8, 1-10, 1-12 and 1-14A)
goesxrs_resp (for GOES-G)
comp_sxt_goes_wGOESresp (irradiance with GOES resp)
sxt_goes_wGOESresp2(scatter plot)
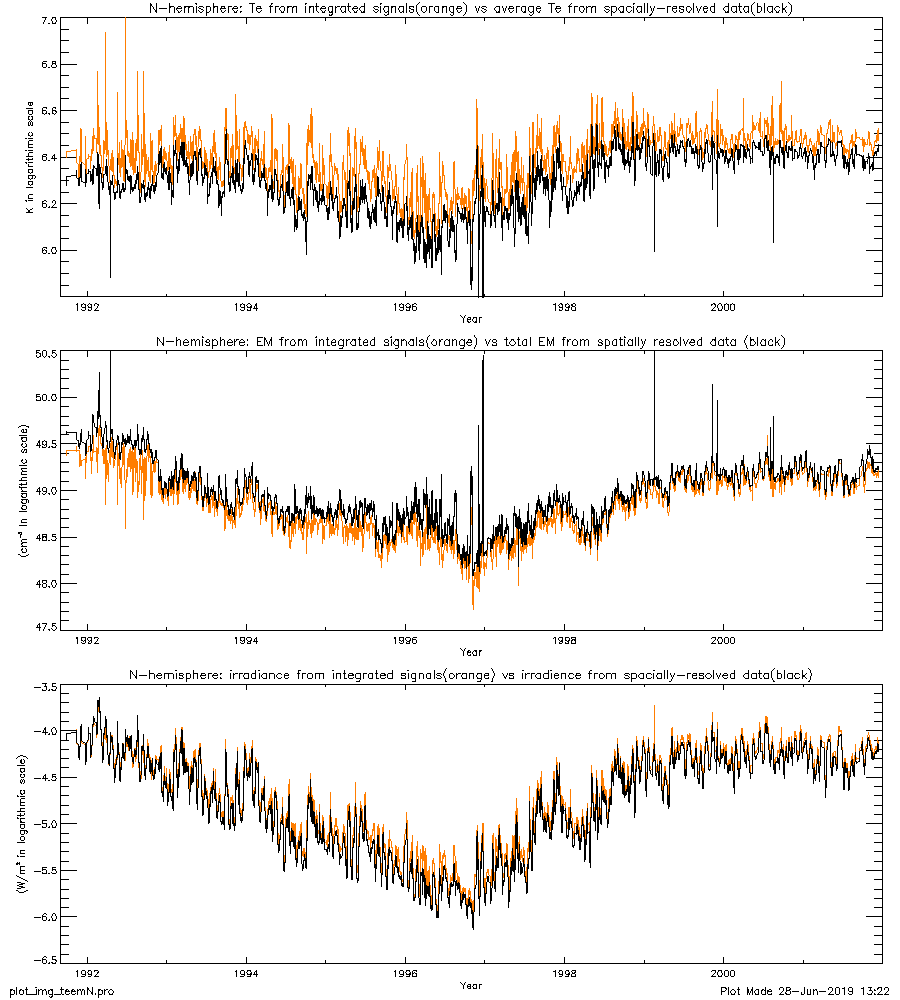
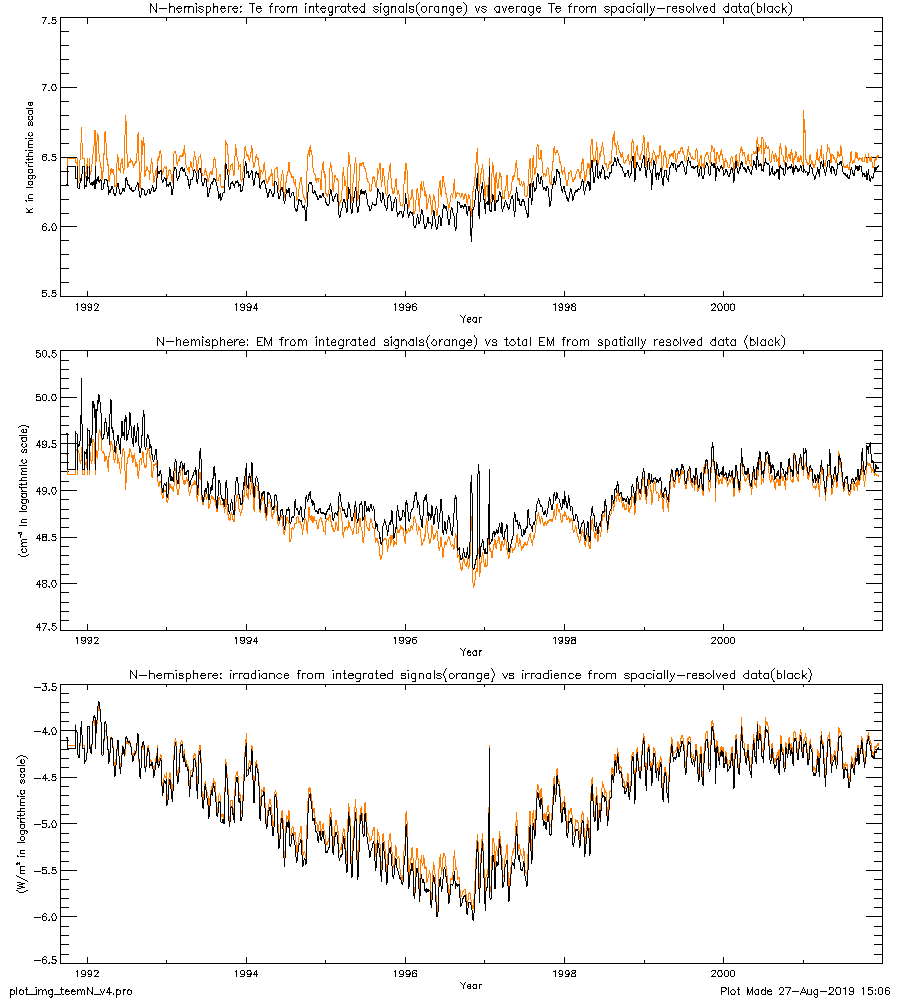
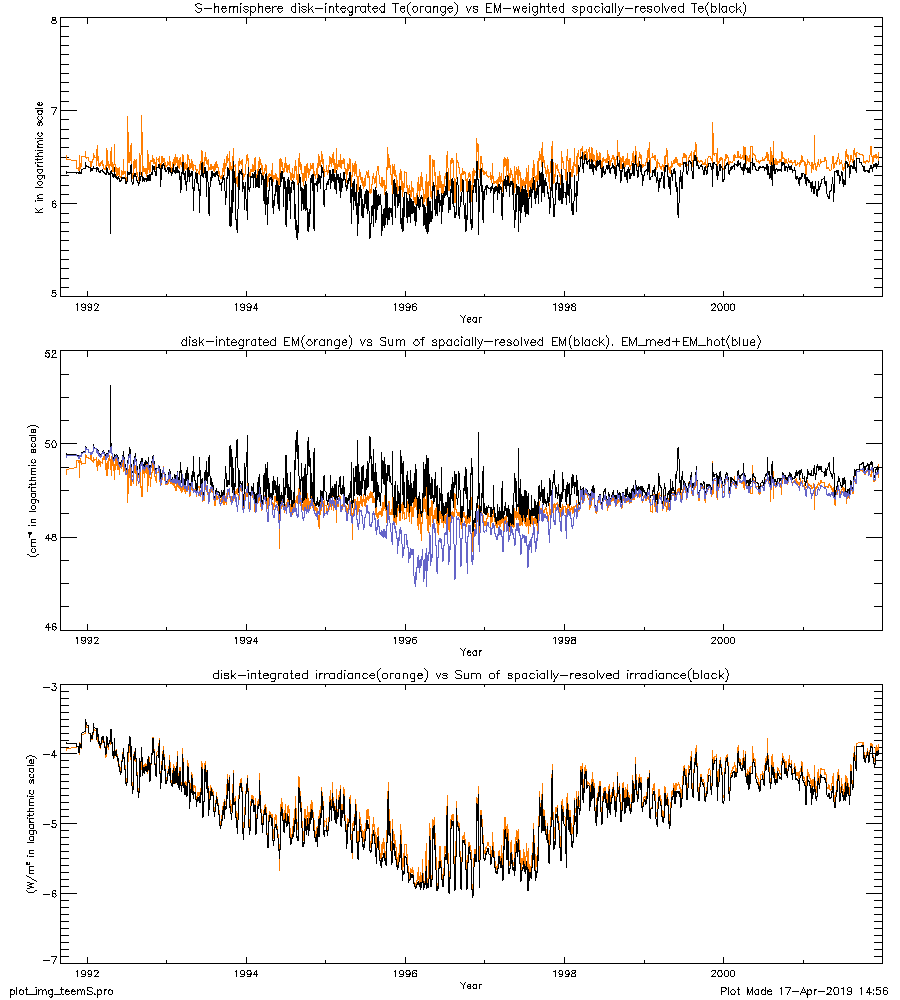
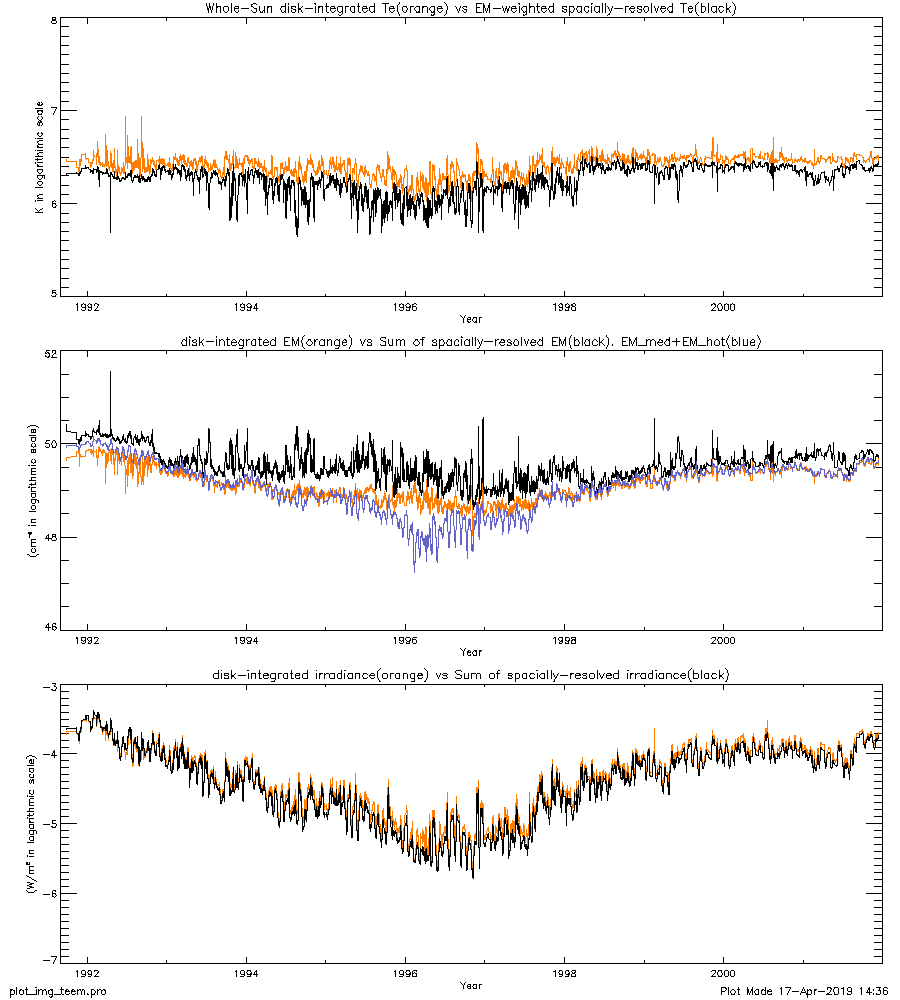
Applying the filter ratio technique to full-Sun images instead of integrated signals is photometrically challenging. To improve photometrical statistics, the pixel resolution of all the image pairs was re-binned to 9.8 arcsec/pix, with which SXT full-Sun images are the size of 256x256 pix. In addition, we used only Northern hemispheric area of each image for this study. The Southern hemispheric corona was masked out to avoid the Southeast part of the image where a major stray light patterns are located. We thereby obtained a mission-long series of temperature and emission measure maps of the Northern hemispheric corona. For each pair of temperature and emission measure maps, we calculated the average temperature weighted by emission measures, and the total emission measure as a sum of all pixels in an emission measure map. Using these averaged temperature and the total emission measure, the irradiance (0.3 to 3.0 nm) from the Northern hemispheric corona was calculated with the same method used for the integrated signals. These quantities were daily averaged and plotted in Figure 4.1, compared with the results obtained from the spatially integrated signals.
It turned out that the averaged temperatures from the spatially resolved data are systematically lower than those from the integrated signals. It is generally lower by 20 to 30% but reaches to more than 50% around the solar minimum (top plot in Fig. 4.1). This result is reasonable because the cooler component of the corona does not efficiently contribute to the integrated signals and thus underestimated in the filter ratio temperature derived from the integrated signals. In the method using spatially resolved data, on the contrary, the cooler component contributes to the average through its own emission measure. When Sun's activity level was the lowest near the solar minimum, the signals from the dark area of the image turned closer to the level of uncertainty, and started to show spiky noise. Such noise spikes do contribute to raise the filter-ratio temperature derived from the integrated signals (as reported in subsection 3.1), but do not contribute much to the averaged temperature from the spatially resolved data as long as the rest majority pixels keep decent signal to noise ratio.
Corresponding to the behavior of the temperatures, the emission measures derived from the spatially resolved data are 20 to 50% higher outside the period of solar minimum, and a factor of 10 to 30 higher around the solar minimum (middle plot in Fig. 4.1). These temperatures and emission measures calculated from the spatially resolved data make little difference in the level of irradiance except the period of Sun's lowest activity (bottom plot in Fig. 4.1). The difference outside solar minimum is within 10% relative to the irradiance derived from the integrated signals. Early in 1996, on the other hand, the irradiance from the spatially resolved data are 40 to 50% lower than those from the integrated signals which are more susceptible to the noise in the low signal areas (see discussion in subsection 3.1). Figure 4.2 presents the above results in the same framework as figure 3.2, for the sample years, 1992, 1996 and 2000.
The uncertainty of the temperatures and emission measures applied to images is generally 3 to 5% for a 9.8"x9.8" arcsec worth pixel used for this study. However, there often appears in an image a small area with abnormally high uncertainty values coming from the calibration of the stray light, and messes up the calculation of the uncertainty of the averaged temperature and total emission measure. When such area was masked out, the uncertainty of the averaged temperature and total emission measure settles down to the comparable level with the corresponding results from the integrated signals.
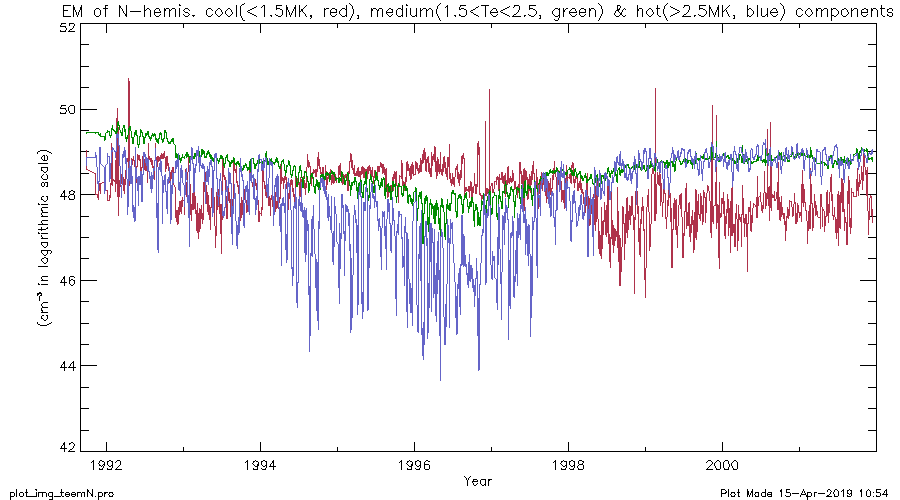
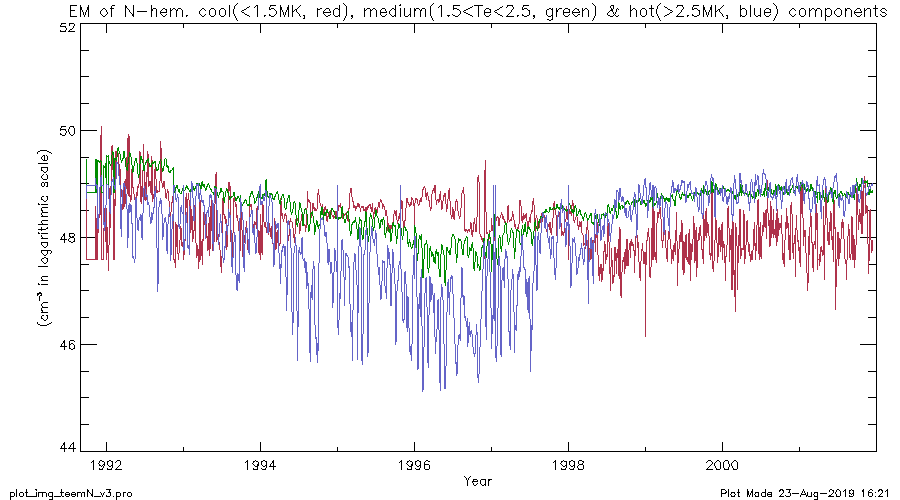
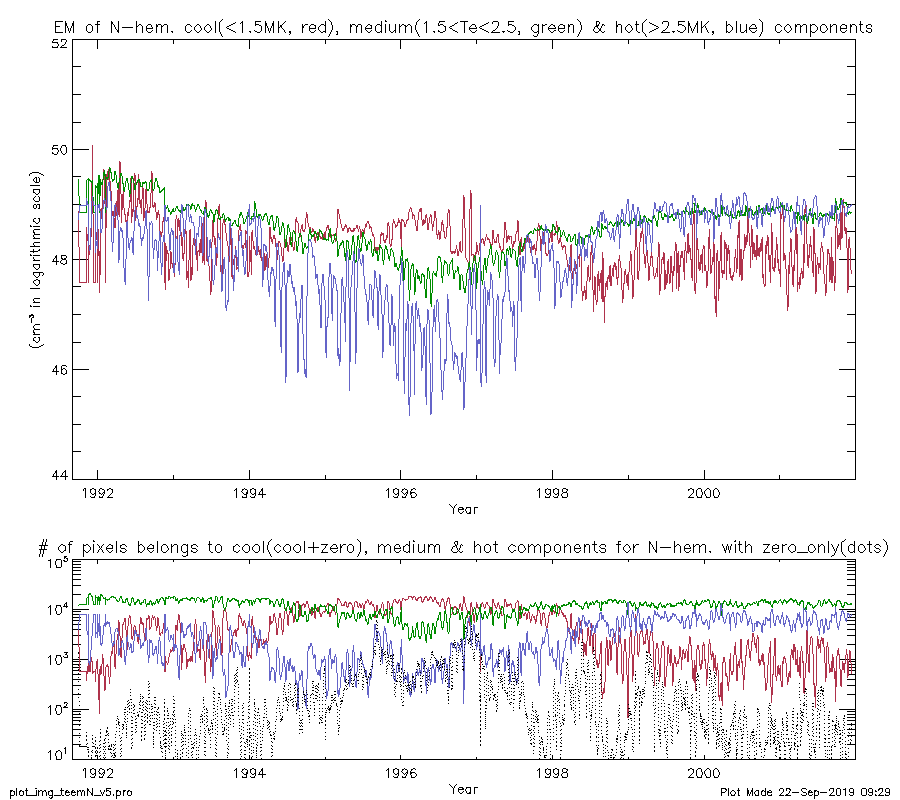
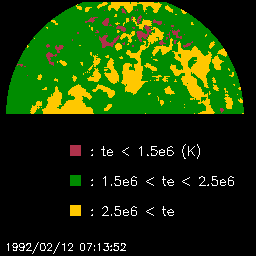
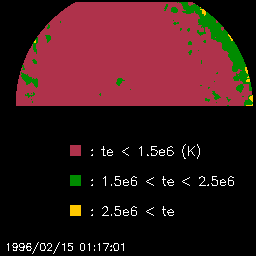
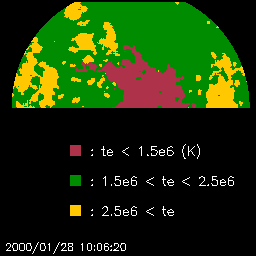
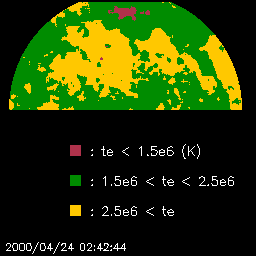
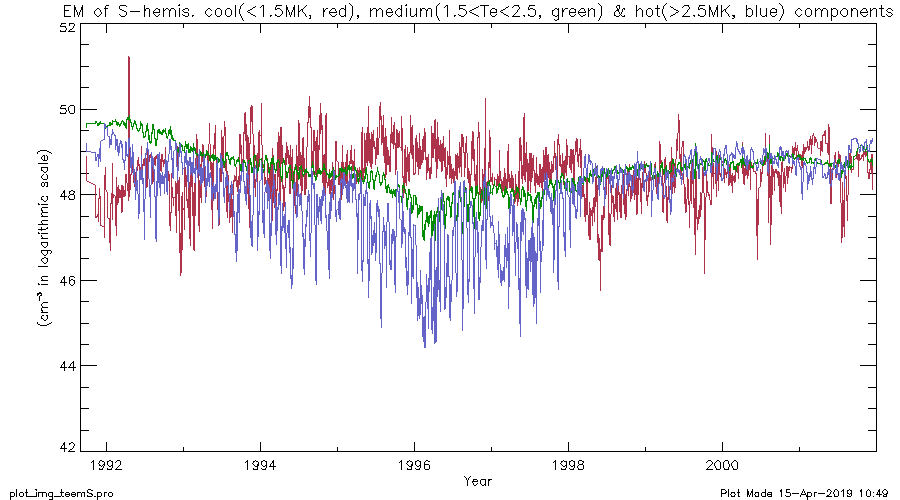
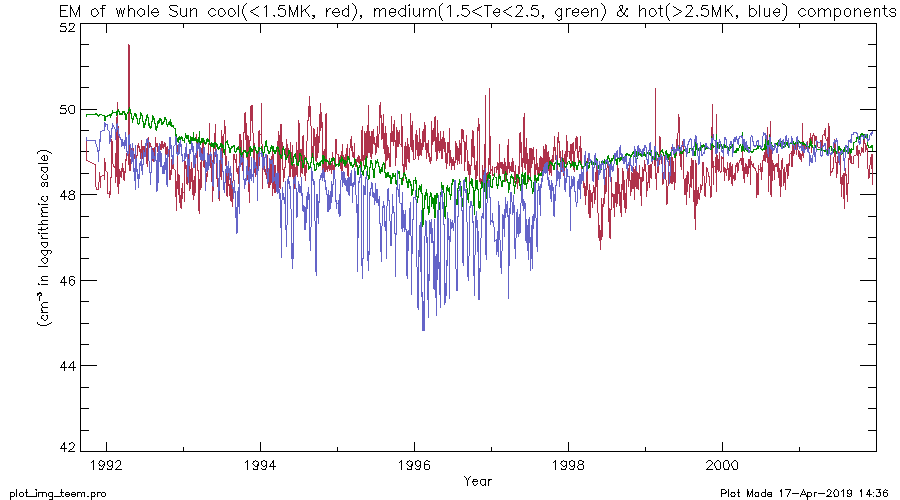
Next, we divided the pixels in each temperature map into three groups; the pixels with the temperature less than 1.5MK (the cool component), the pixels with the temperature between 1.5 and 2.5MK (the medium component) and the pixels with the temperature higher than 2.5MK (the hot component). We then used the corresponding emission measure map to obtain the total emission measure of the pixels belong to each component. The mission-long variations of the emission measures of cool, medium and hot components are plotted in Figure 4.3. While the medium and hot components show the similar curve as the irradiance (bottom plot in Fig. 4.1), the cool component increases roughly by a factor of 10 in early 1996 when the solar activity is around minimum. The total emission measure of the hot component in the descending phase of activity cycle is significantly lower than that of medium component, while in the ascending phase the amount of hot component is comparable with that of medium component. We are currently unable to reject the possibility of this different relative contribution of the hot and medium components being caused by imperfect calibration, but this trend is providing an interesting perspective on the temperature structure of the corona over its activity cycle. We see an unnatural gap in the late 1992, especially in the medium temperature component. We consider that our latest calibration on the contamination on the pre-filter and the first pre-filter failure event (Acton, 2018) is still insufficient at least for the Northern hemispheric area of the data.
We performed the same study using spatially resolved full-Sun images, and confirmed that the overall trend was unchanged.











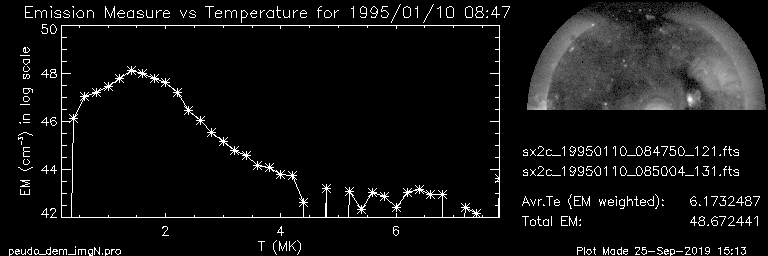
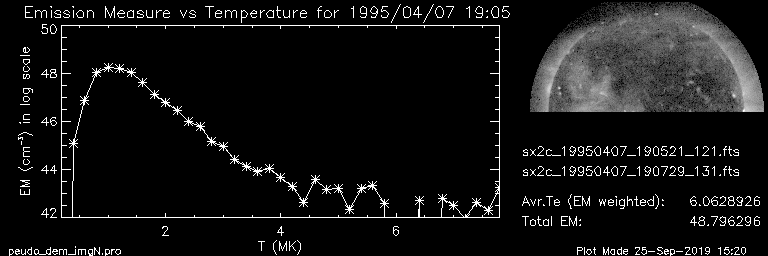
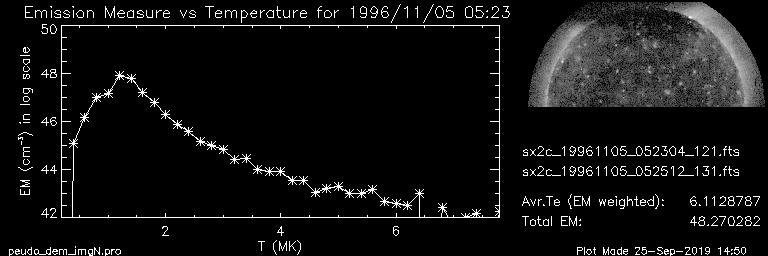
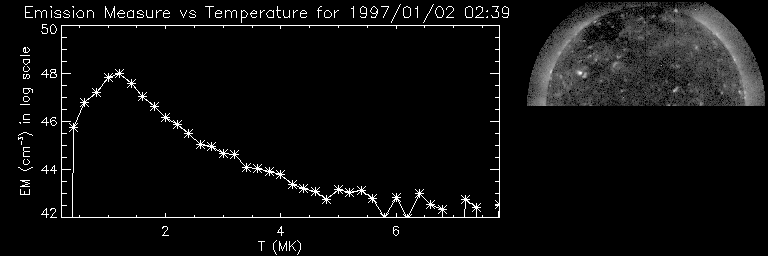
The daily averaged values of misson-long filter ratio temperature and emission measures were discussed in the plane of in the plane of log_Te (K) and log_EM (cm^-3). The data points in 1992 (near the solar maximum) are located at the area centered at (6.5, 49.5), moving toward around (6.25, 48.7) in 1996 (near the solar minimum) then turning back to the previous values at the maximum phase in 2000. Our calculation is based on the elemental abundances proposed by Schmelz et al (2012), which is the latest version of so-called 'hybrid' abundances. By assuming traditional coronal abundances by Feldman et al (1992), the temperatures show no significant difference, while the emission measures result in 30 to 45% lower values. The resulting irradiance has no significant difference or less than 5% higher values compared with the irradiance obtained with the hybrid abundances. The effect of the assumption of the photospheric abundances by Caffau et al (2011) was also investigated.
We calculated the soft X-ray irradiance for the shorter wavelength range similar to GOES/XRS for the purpose of comparison. We found that the SXT irradiance calculated for the range 0.1 to 1.0 nm yields the closest flux level to the GOES/XRS long channel flux (0.1-0.8 nm) when the solar activity was medium to high. Around the solar minimum, the flux from GOES/XRS went under the detection limit for most of the time, while the SXT signals still hold valid information. We therefore consider that the SXT irradiance can be used as the correction of the GOES/XRS flux around the period of solar minimum.
For the purpose of incorporating the spatial information to the irradiance study, we tried the alternative method to derive the irradiance by applying the filter ratio technique to the coronal images instead of spatially integrated signals. We used only Northern hemispheric area where is less effected by the stray light contamination, and compared the results with the corresponding results obtained from the integrated signals. It turned out that the emission-measure weighted average of the spatially resolved temperatures are generally 20 to 30% lower than those derived from the integrated signals, and that the total of spatially resolved emission measures are accordingly 1.5 to 2 times higher. These trend are even enhanced when Sun's activity is in the lowest level in early 1996, because of the increased number of low signal to noise pixels, whose spike noises contribute more effectively to the results using integrated signals than to those with spatially resolved data. The SXT irradiance calculated from the spatially-resolved data is within 10% difference from the one derived from the spatially integrated signals, but near the solar minimum, the irradiance from spatially resolved data is ~50% lower than that from the integrated signals. The different results from the two approaches suggest an interesting perspective on the interpretation of other stellar data.
Using the spatially resolved information of temperature and emission measure of the corona, we derive the mission-long variation of the total emission measures of cool(less than 1.5MK), medium(1.5 to 2.5MK) and hot(more than 2.5MK) temperature components. We found the cool component increases roughly by a factor of 10 in early 1996 when the solar activity is around minimum, while the medium and hot components show the similar curve as the irradiance. It is also noticed that the total emission measure of the hot component in the descending phase of activity cycle is significantly lower than that of medium component, but in the ascending phase the amount of hot component is comparable with that of medium component.