Recalculating SXT Temperature Response Functions
(April, 2010 by Aki Takeda)
(October, 2010, revised: uncertainty analysis added.)
(February, 2011, revised: photospheric abundance added.)
1. Motivation.
As of 30-Apr-2010, our official SXT response function is the one made in
1995 April, and based on the spectral model calculated by Mewe et.al.(1985).
New atomic data for the X-ray wavelength range have become available
from Chianti atomic database. In order to adopt these new data,
we recalculated our SXT temperature response function (expected data number
for each analysis filter assuming to observe the isothermal plasma
of the temperature range, 5.5 through 8.0 in logTe) using recent
Chianti database and software (version 6.0.1).
2. New response functions.
Coronal spectra are calculated on specified elemental abundance
and ionization equilibrium. In the latest Chianti database,
several kinds and versions of abandance & ionization files are available.
These allow us to generate a variety of response functions for different
pairs of abundance & ion_eq files.
Our new response functions are calculated with the following two pairs.
- sun_coronal_ext.abund + chianti.ioneq (sre_ch601_corona_chianti.genx)
- sun_hybrid_ext.abund + chianti.ioneq (sre_ch601_hybrid_chianti.genx)
Users are allowed to specify one of these response files in the latest
software for temperature analysis.
The new response files and the software to work with them
are downloaded from here.
FYI, our traditional responses and some later work correspond to the following pairs.
- meyer_coronal.abund + arnaud_rothenflug.ioneq (sre950419_02.genx : traditional)
- feldmann.abund + mazzotta_etal.ioneq (sre020507_01.genx : courtesy of M. Shimojo with Chianti ver 3.0.3)
- sun_coronal.abund + mazzotta_etal_9.ioneq (sre_ch601_corona_mazzotta9.genx : for comparison)
- sun_hybrid.abund + mazzotta_etal_9.ioneq (sre_ch601_hybrid_mazzotta9.genx : for comparison)
3. Comparison of New/Old response files.
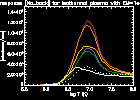
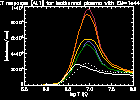
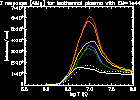
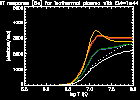
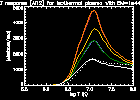
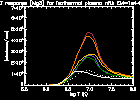
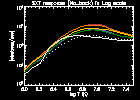
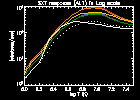
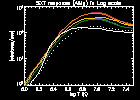
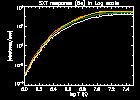
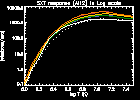
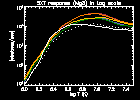
New and old response curves for each analysis filter(filter B),
in linear and logarithmic scales.
Other sre files,
and other ratios,
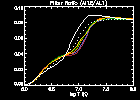
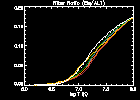
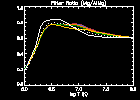
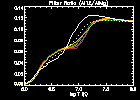
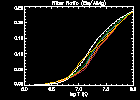
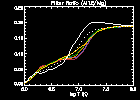
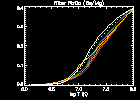
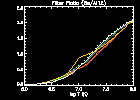
Comparison of line ratio curves derived from the new and old response functions.
| AlMg/Al.1 | Mg/Al.1 | Al12/Al.1 |
Be/Al.1 | Mg/AlMg |
 |
 |
 |
 |
 |
| Al12/AlMg | Be/AlMg | Al12/Mg |
Be/Mg | Be/Al12 |
 |
 |
 |
 |
 |
Here are some more check plots (for peace of mind).
- This is the comparison of the sre files,
made with sun_coronal_ext.abund and sun_coronal.abund.
- These are to compare Mewe's and Chianti's emission model. Both calculated with
the same elemental abundance and ionization equilbrium files.
Response curves for AlMg and Be filters, and
the corresponding Filter ratios.
4. Step by Step Comparison.
4.1. Elemental abundances
We compared the following 3 abundance files.
- sun_coronal_ext.abund
- Feldman, et al.,1992, ApJ SS, 81, 387.
- Potassium abundance: Landi, Feldman and Dere 2002, ApJ, 139, 281.
- Li,Be,B,F,P,Cl,Sc,Ti,V,Cr,Mn,Co,Cu and Zn abundances:
Grevesse N., Sauval A.J., 1998, Space Science Reviews, 85, 161,
(photospheric values) with low-FIP elements increased by a factor 3.5.
- sun_hybrid_ext.abund
- Fludra, A. & Schmelz, J. T., 1999, A&A, 348, 286.
- Li,Be,B,F,Sc,V,Mn,Co, Cu elemental abundances:
Grevesse N., Sauval A.J., 1998, Space Science Reviews, 85, 161.
Their values have been scaled to mimic the "hybrid" FIP effect
found by Fludra & Schmelz 1999: Grevesse high-FIP abundances have
been decreased by a factor 1.3, Grevesse low-FIP abundances have
been increased by a factor 2.09.
- meyer_coronal.abund
- Meyer, J. P., 1985, ApJ SS, 57, 173.
Plot of comparison among these three files is
here. Comparison with other files is
here.
Text comparison file with other abundances together is
here (1,2, and 4 corresponds to the above 3).
4.2. Ionization equilibrium
We will compare the following 3 abundance files.
- chianti.ioneq
- Dere et al., 2009, A&A, 498, 915
- mazzotta_etal.ioneq
- Mazzotta, P., et al., 1998, AASS, 133, 403
- arnaud_rothenflug.ioneq
- Arnaud, M., Rothenflug, R., 1986, AASS, 60, 425
Plots of comparison among these three files for Fe ions.
Chianti and Mazzotta_etal and
Chianti and Arnaud_Rothenflug.
4.3. Continuum intensity from the isothermal plasma
The temperature dependance of the three atomic processes contributing to
the continuum intensities (free-free, free-bound, and two photon) is
here.
The total continuum intensity (the sum of the three processes) from
the 5MK, 2MK, and 1MK isothermal plasma is shown
here, and
these are the comparison with Mewe's results.
4.4. Line intensities from the isothermal plasma
The Chianti line intensities calculated with coronal_ and hybrid_
abundances are compared with Mewe's calculation in
here.
The dependance on the electoron density checked using coronal abundance
and chianti.ioeq are here.
5. Examples of the temperature analysis
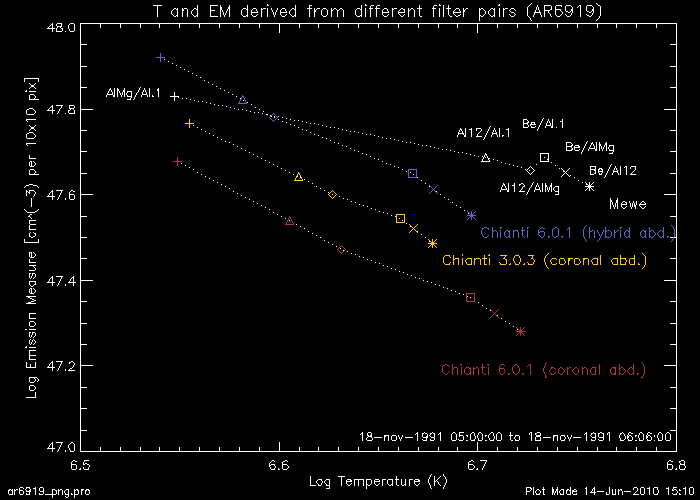
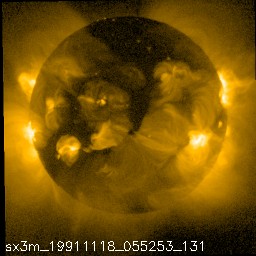
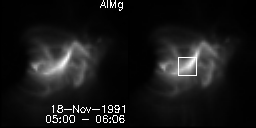
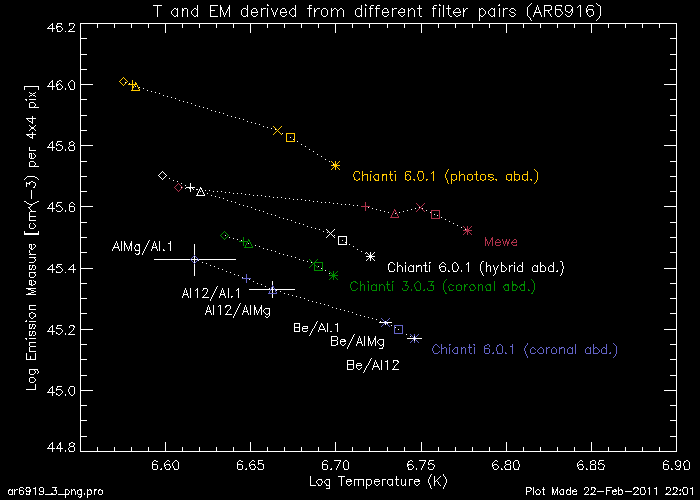
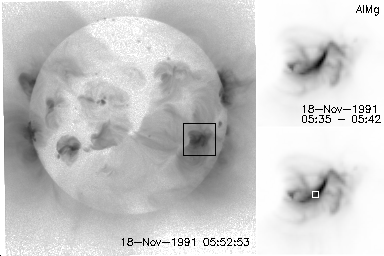
- AR6919 observed on 18-Nov-1991, 05:00 - 06:05.
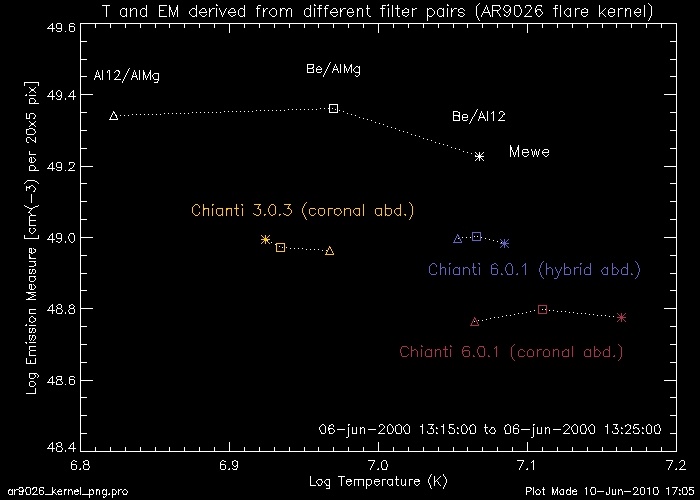
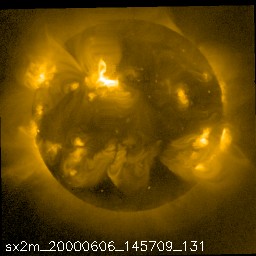
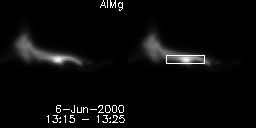
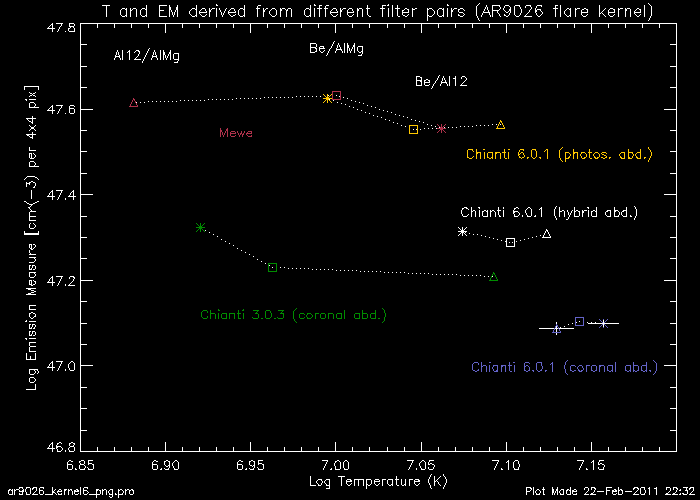
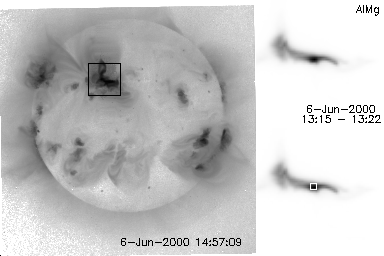
- AR9026 (M-flare kernel) observed on 6-Jun-2000, 13:15 - 13:25.
The trend of temperatures derived from the Be/Al12 filter pair :
For AR9026 flare kernal, the latest response functions give higher value
(up to 50%) than the traditional response file by Mewe.
However, the AR6916 has the opposite trend. This difference comes from
that two region uses different range of Be/Al12 filter ratio curve,
as show in here.
6. Uncertainty of the temperatures and emission measures
- AR6919 observed on 18-Nov-1991, 05:39.
- AR9026 observed on 06-Jun-2000, 13:20.


