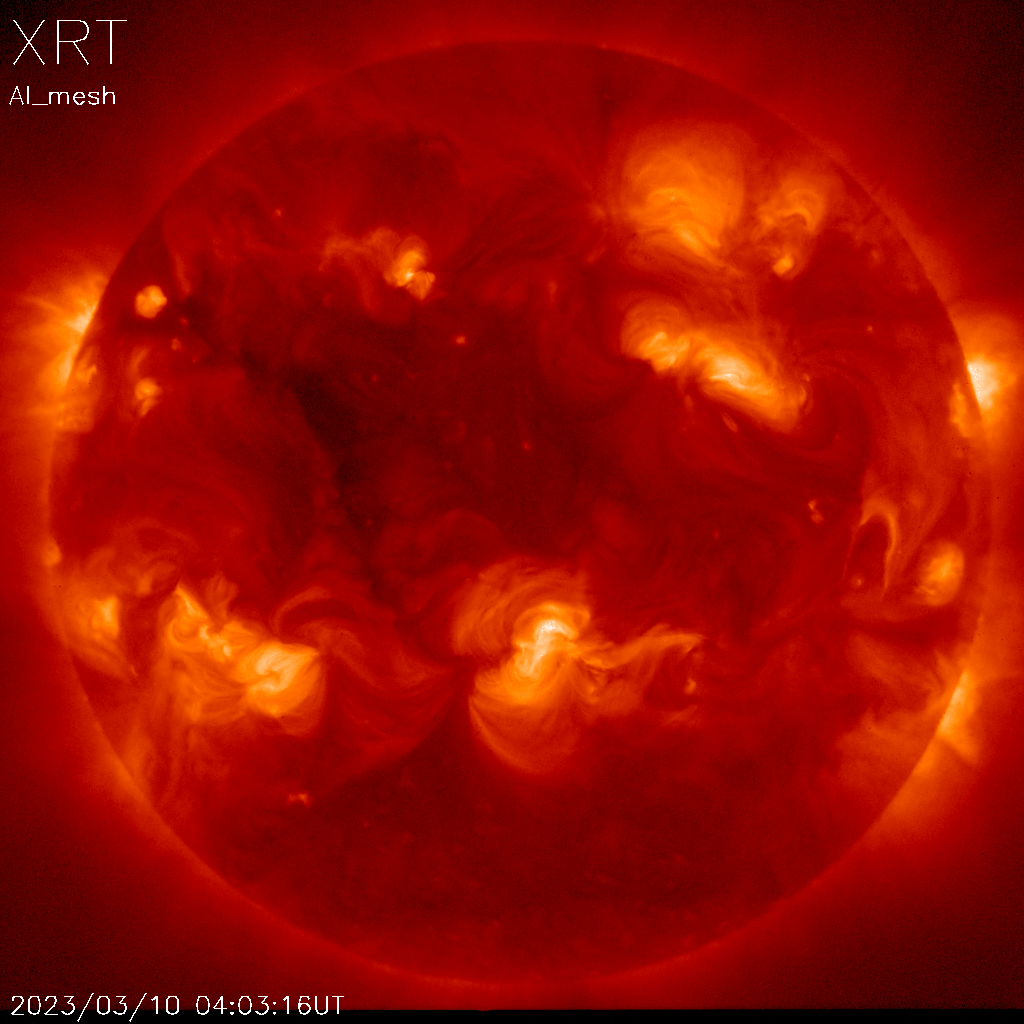
XRT 2D Analysis of Te, EM & Irradiance
31-Jan-2025 : initial version

|

|

|

|

|
| Al_mesh image | Al_poly image |
Te | EM | Irradiance |
1. Purpose
Apply the filter ratio method to pairs of XRT images to obtain
Temperatures, Emission Measures, and Soft X-ray Irradiances in
2 Dimension and compare the results with those from full-Sun
intenrated signals.
2. Method
- Start from the same image pairs from the full-Sun integrated study.
- use images in Synoptic Composite Image Archive.
- pairs of Al_poly and Al_mesh filters.
- 1024x1024 pixels, 2.xx arcsec/pix.
- January 2015 --- Ocbtober 2024.
- Calculate Te and EM with XRT_TEEM modified for synoptic images.
- subtract stray light image suitable for each phase of pre-filter
failure.
- Take coalignment of image pairs (shift Al_poly to Al_mesh position
if the sun center coord differs more than 0.5 pix).
- introduce contamination thickness built on X-ray filters.
- Rebin images to 256x256 pix (8.xx arcsec/pix) to increase
S/N per pixel.
- Refine image arrays (remove bad Te images :
more images need to be eliminated than full-Sun integrated pairs).
- Calculate 2D soft X-ray irradiance for 5-60A wavelength range.
- synthesize spectrum of isothermal plasma having temperature Te.
- sum up energy included in a give wavelength range (5-60A).
- convert to the value at the distance of 1 AU for the
calculated EM at 1 AU, for the obtained EM, and in unit of W/m^2.
- Mask out the area > 1.1 Rs and calculate values for comparison
with full-Sun integrated case.
- Te: take EM weighted average.
- EM: sum up.
- Irrad.: sum up.
3. Programs
(in idlpro/xrt/irrad10/)
- PROC_2D_TEEMIRR_1IMG.PRO :
Process 1 image from a SCIA file pair to 2D map of Te, EM & Irradiance.
Created for testing purpose.
- PROC_FSUN_TEEMIRR_1IMG.PRO :
Process 1 image from a SCIA file pair to calculate full-Sun integrated
Te, EM & Irradiance. To make comparison with the results from
proc_2d_teemirr_1img.pro.
- PROC_TEEM2IMG_1MON.PRO :
Process 1 month of synoptic image pairs for irradiance study and
output image arrays of Te, EM, and maskimg.
save xrt_irrad3/comp_fsun2d/teem_img_yyyymm.genx type files.
- COMP_FSUN_2D_TEEMIRR_1MON.PRO :
Read monthly full-sun integrated Te, EM & Irrad saved in the archive.
Read 2D- Te and EM creaded by proc_teem2img_1mon.pro and
calculate 2D-irradiance. Calculate averaged Te, total EM, total Irrad
and compare with full-sun integrated values. Both results saved in
xrt_irrad3/comp_fsun2d/comp_fsun2d_teemirr_yyyymm.genx files.
- COMP_FSUN_2D_TEEMIRR_APTB_1MON.PRO : Apol/tnBe filter pair version.
- CONNECT_TEEMIRR_1YR.PRO :
Read monthly files of comp_fsun2d_teemirr_yyyymm.genx
for a specified year and connect and make year-long plots of Te,
EM & Irrad for both full-sun integrated and derived from 2D analysis.
- CONNECT_TEEMIRR_APTB_1YR2.PRO :
Apol/tnBe filter pair version procedure.
- CONNECT_COMP_TEEMIRR.PRO :
Connect yearly arrays prepared by connect_teemirr_1yr.pro
and make long term plots (2015.1--2024.10).
- CONNECT_COMP_TEEMIRR2_APTB.PRO : Apol/tnBe filter pair version.
- REFINE_2D_TEEM_1YR.PRO :
Refine Te, EM & Irrad image arrays by removing bad images.
save OK images, mask image and OK indices in
xrt_irrad3/comp_fsun2d/teem_img_ref_yyyy.genx .
- REFINE_2D_TEEM_APTB_1YR.PRO : Apol/tnBe filter pair version.
- CONNECT_TEEMIRR_1YR2.PRO :
Make improved plots of Te, EM, and Irrad with refined data set.
overplotted with pre-refined data created by
connect_teemirr_1yr.pro
- CONNECT_TEEMIRR_APTB_1YR.PRO : Apol/tnBe filter pair version.
- CONNECT_COMP_TEEMIRR2.PRO :
Connect yearly arrays prepared by connect_teemirr_1yr2.pro.
Te, EM and Irrad plots with refined data.
- CONNECT_COMP_TEEMIRR2_APTB.PRO : Apol/tnBe filter pair version.
- DEM_BARPLOT2_1IMG.PRO :
For DEM study. Read yearly teem imgs and create Te-EM bar plot for
a specified 1 image.
- DEM_BARPLOT3_1IMG.PRO : Apol/tnBe filter pair version, but
with overlaying averaged Te and EM obtained from full-Sun and 2D.
- DEM_BARPLOT2_1YR.PRO :
Read yearly teem imgs and create Te-EM bar plot for each image.
This version using log Te bin.
- DEM_BARPLOT3_1YR.PRO :
Read yearly teem imgs and create Te-EM bar plot for each image.
This version using log Te bin and overplot averaged Te and EM
obtained from full-Sun and 2D.
- SEL_BARPLOT2_1YR.PRO :
Select barplots roughly every 10 days out of all available plots
for the specified year. One image is selected on roughly 10th,
20th 30th day each month.
- SEL_BARPLOT3_1YR.PRO :
Using DEM barplot with overlaid with averaged Te and EM.
- CONNECT_BARPLOT2.PRO :
Read yearly barplot images and select roughly 3 images/month and
connect from 2015-2024. Optionally save and make a Javascript movie.
- CONNECT_BARPLOT3.PRO :
Same as connect_barplot2.pro, but using DEM barplot with overlaid
with averaged Te and EM.
- COMP_TEIMG_AMAP_APTB.PRO : Compare the Te images of
Alms/Apol and Apol/thBe and make a temperature profile at a given y-value.
- COMPOSITE_TEEMIMG_20240912.PRO : Make a composite Te and EM images of
Alms/Apol and Apol/thBe for 2024/09/12 04:19 UT images. Then do a DEM study
and make bar plots of composite images and overplot of Alms/Apol & Apol/thBe.
4. Results
- Comparison of full-Sun and 2d analysis


- Resolving EM into 3 temperature components:
- Cool : Te less than 1.5MK
- Medium : 1.5MK < Te < 2.5MK
- Hot : Te more than 2.5MK
- Right plots : Median (3 pix) and smoothing (20 pix) applied.


- EM vs Te bar plots from 2015 through 2024: (click image to see movie)

(click image to enlarge)
- Comparison of temperature maps: Al_poly/Al_mesh vs thin_Be/Al_poly
 |
composite Te image is created with logTe_threshold
at 6.45 (2.82MK).
- Te_composite = Te_amap where log_Te < 6.45
- Te_composite = Te_aptb where log_Te >= 6.45
comosite EM is created by replacing the same pixels as Te_composite.
- EM_composite = EM_amap at pixels where log_Te < 6.45
- EM_composite = EM_aptb at pixels where log_Te >= 6.45
composite irradiance image is calculated using Te_composite
and EM_composite images.
|
 |
- Comparison of 2D irradiance: Apol/Alms vs tnBe/Apol vs Composite
Total irradiance calculated for 2024/09/12 04:19 UT (in W/m^2 in log sccale):
-2.74 (Apol/Alms), -3.02 (tnBe/Apol) & -2.83 (composite)


