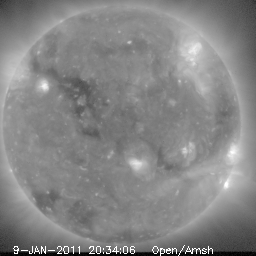
Disk Center is not located
at the image center.
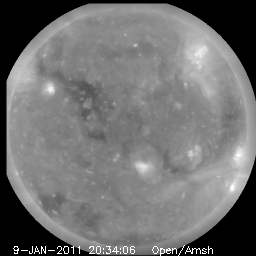
center and the area outside
1.1 R_sol was masked.
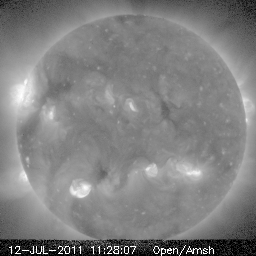
taken near apogee.
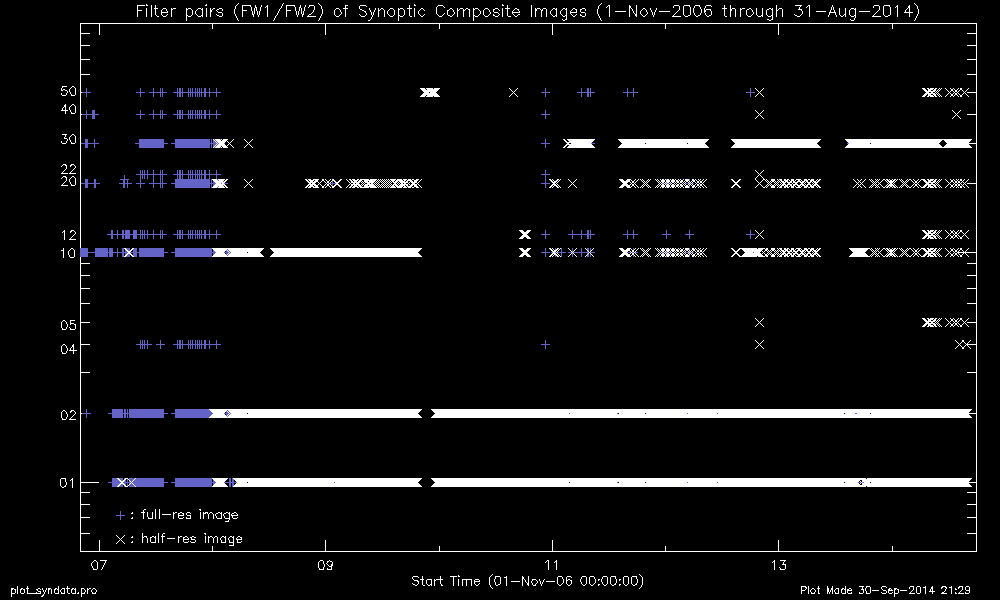
These numbers are based on the synoptic composite images processed at MSU for 1-Nov-2006 through 31-Aug-2014.
| Total number of synoptic images | 18149 |
| Open/Al-mesh filter images | 5379 |
| Open/Ti-poly filter images | 6177 |
| Open/Thick-Al filter images | 33 |
| Open/Thick-Be filter images | 21 |
| Al-poly/Open filter images | 2973 |
| C-poly/Open filter images | 652 |
| Thin-Be/Open filter images | 2245 |
| Med-Be/Open filter images | 133 |
| Med-Al/Open filter images | 176 |
| Al-poly/Ti-poly filter images | 326 |
| C-poly/Ti-poly filter images | 176 |
| Number of full-resolution images | 6309 |
| Number of half-resolution images | 11840 |
[MEMO 1] Major periods with no data.
[MEMO 2] It is noticed that the "official" synoptic image archive (by SAO in Sep. 2014) contains significantly lower number of images than the MSU version. The following study was made with the images in the MSU archive.
[Steps of image processing]
[Sample images]
| a slightly off-centered image. Disk Center is not located at the image center. |
DC was shifted to the image center and the area outside 1.1 R_sol was masked. |
example of small solar disk taken near apogee. |
 |
 |
 |
[some test study]
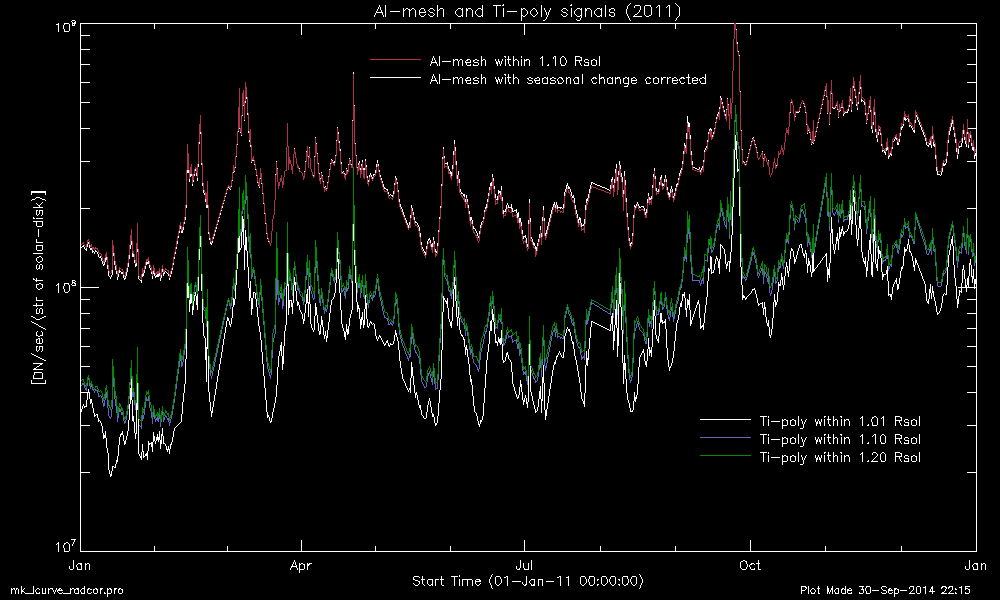
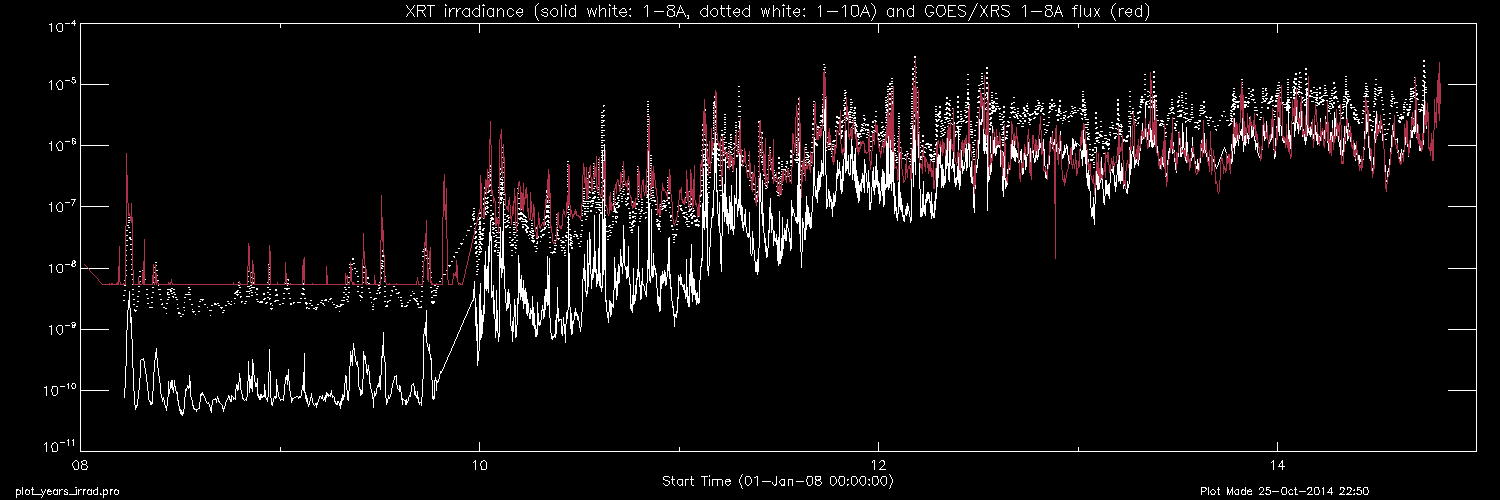
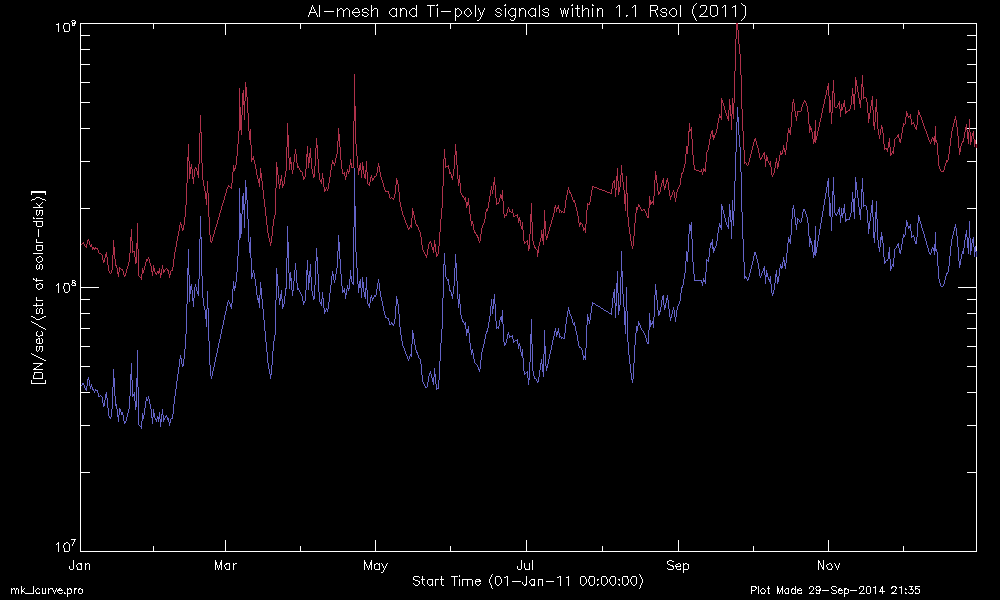
[intensity plots]
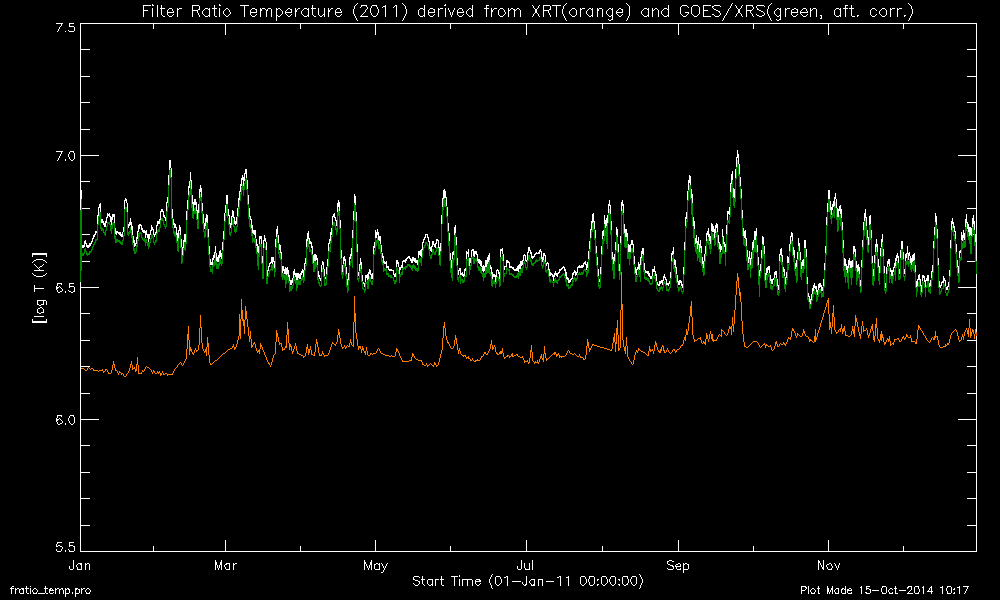
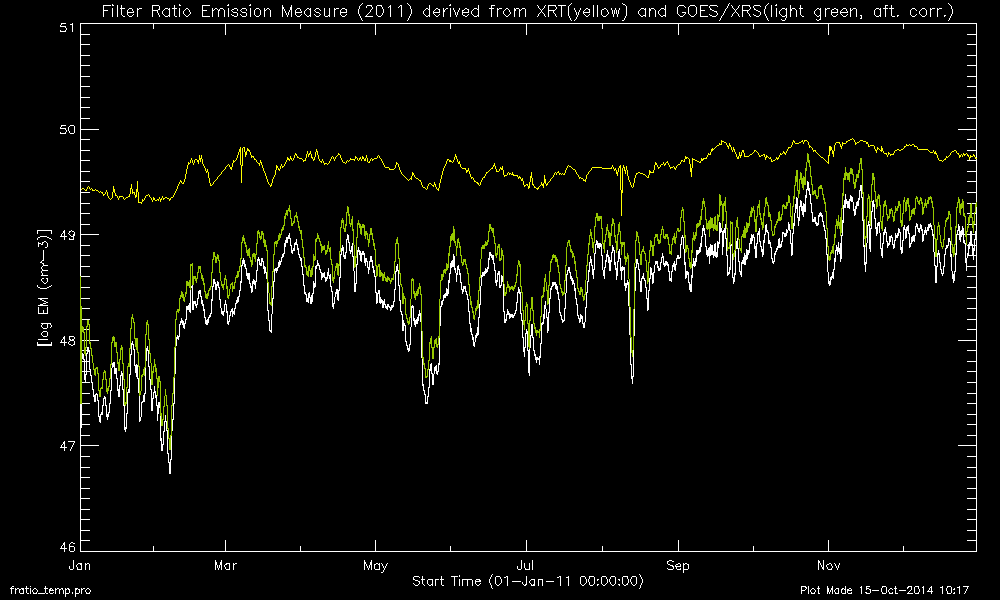
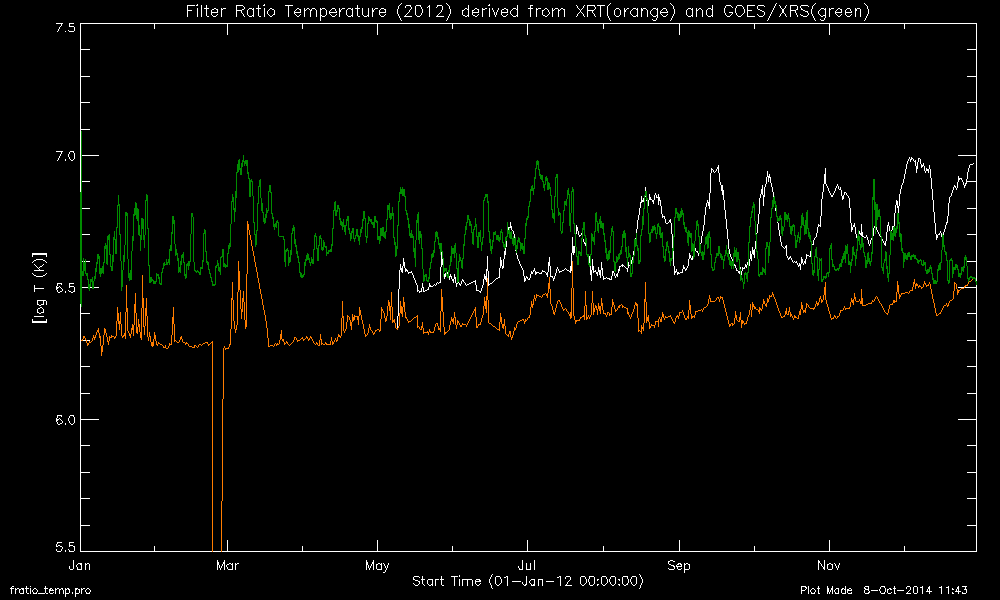
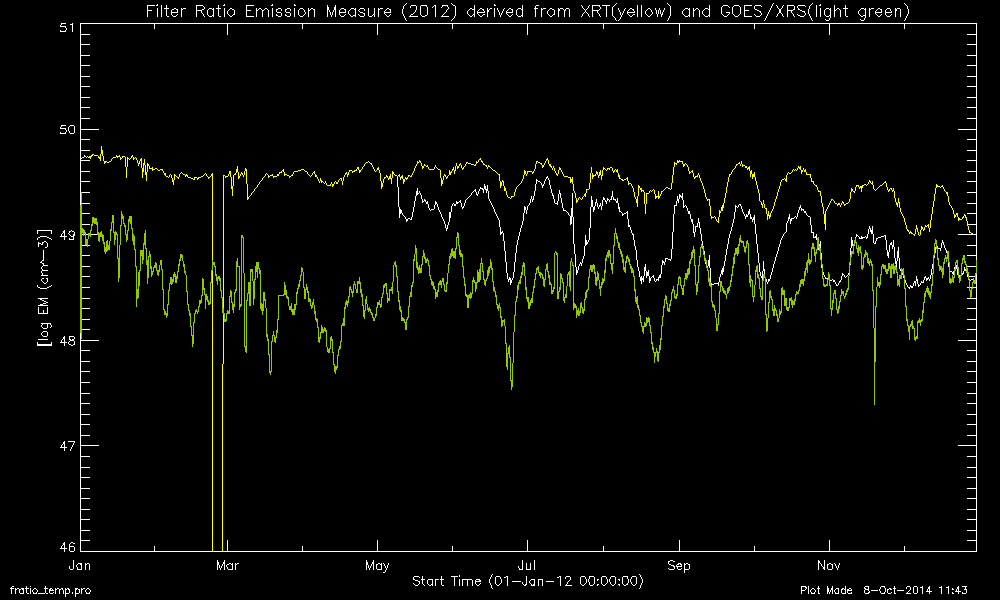
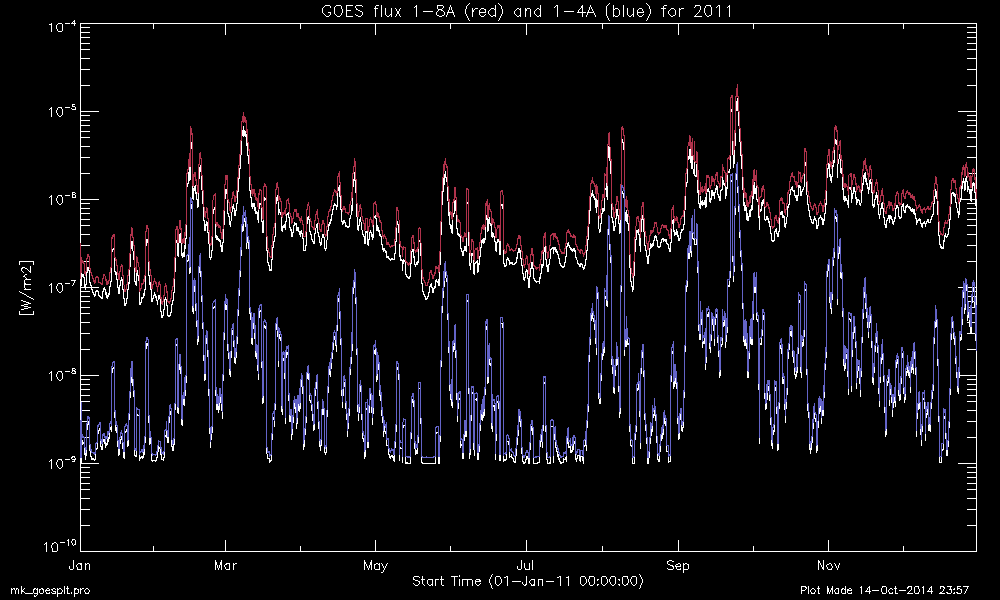
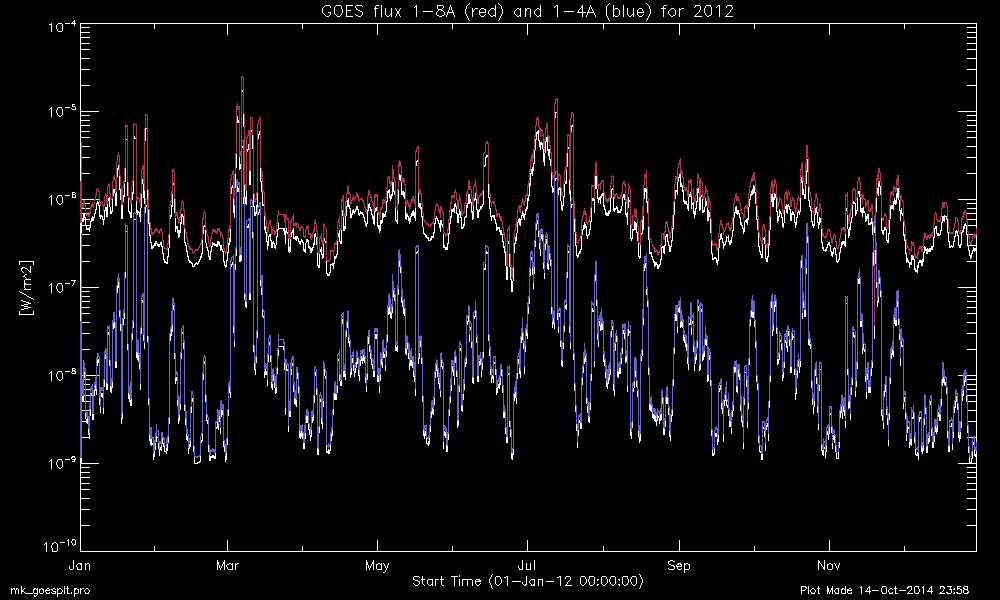
The GOES/XRS fluxes are corrected based on a NGDC note,
http://www.ngdc.noaa.gov/stp/GOES/doc/GOES_XRS_readme.pdf.
The white lines show the values before correction.
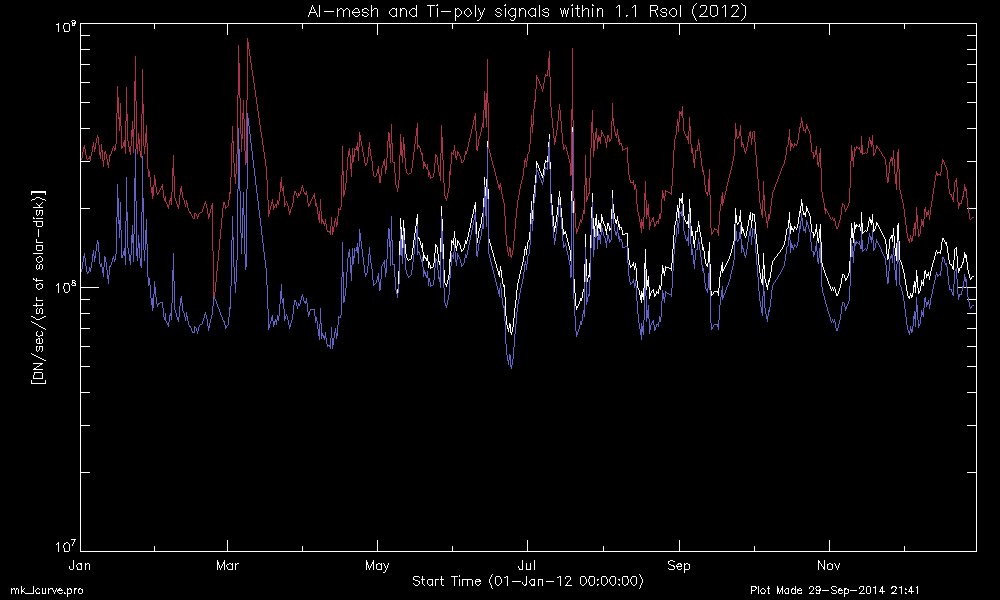
[Ti-poly (corrected)] = [Ti-poly (original)] - [stray-light image 2014] * (fudge factor)
| "fudge factor" : | 0.5 | 9-May-2012 through 14-Aug-2012 |
| 0.7 | 15-Aug-2012 through 31-Dec-2012 | |
| 1.0 | 1-Jan-2013 and after |
Plots for other years
The signals in 2007 and early 2008 behaves weird, probably due to the CCD contamination problem. Since Feb-2008 when regular CCD bakeout operation started, the CCD entered a different stage of sensitivity which continues to be the same until present. Therefore, we should not use the data before Feb-2008 for the irradiance study. We will start from 21-Mar-2008, when Al-mesh and Ti-poly pairs started to be taken regularly.
Signal movie for all years
Temperature and EM movie for all years
Filter-ratio curves for the Ti-poly and Al-mesh filter pairs
