|
|
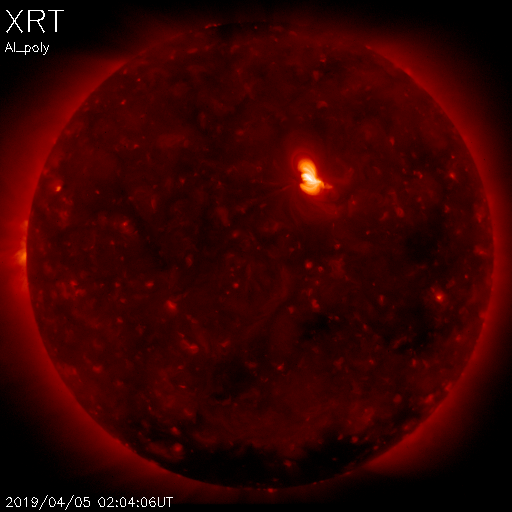
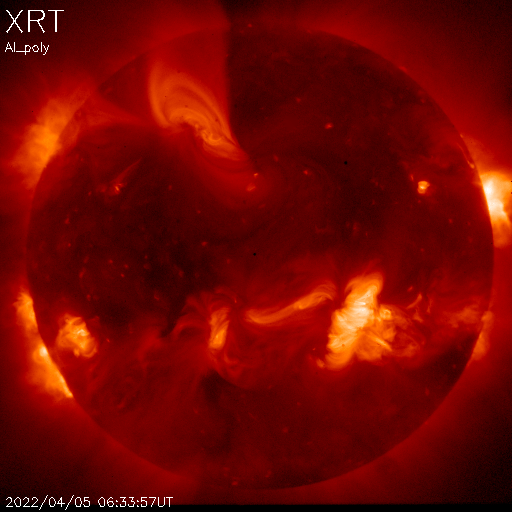
| (Quiet Sun) | (Active Sun) |
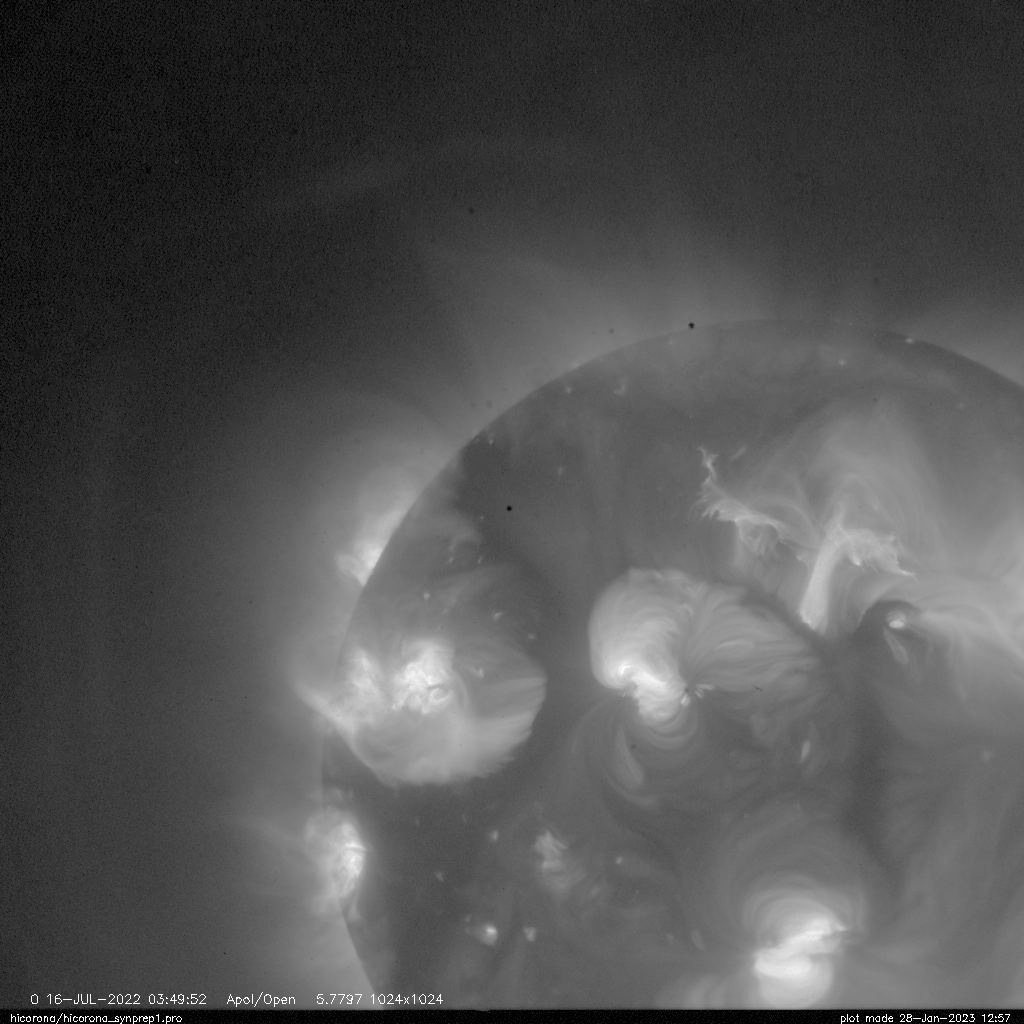
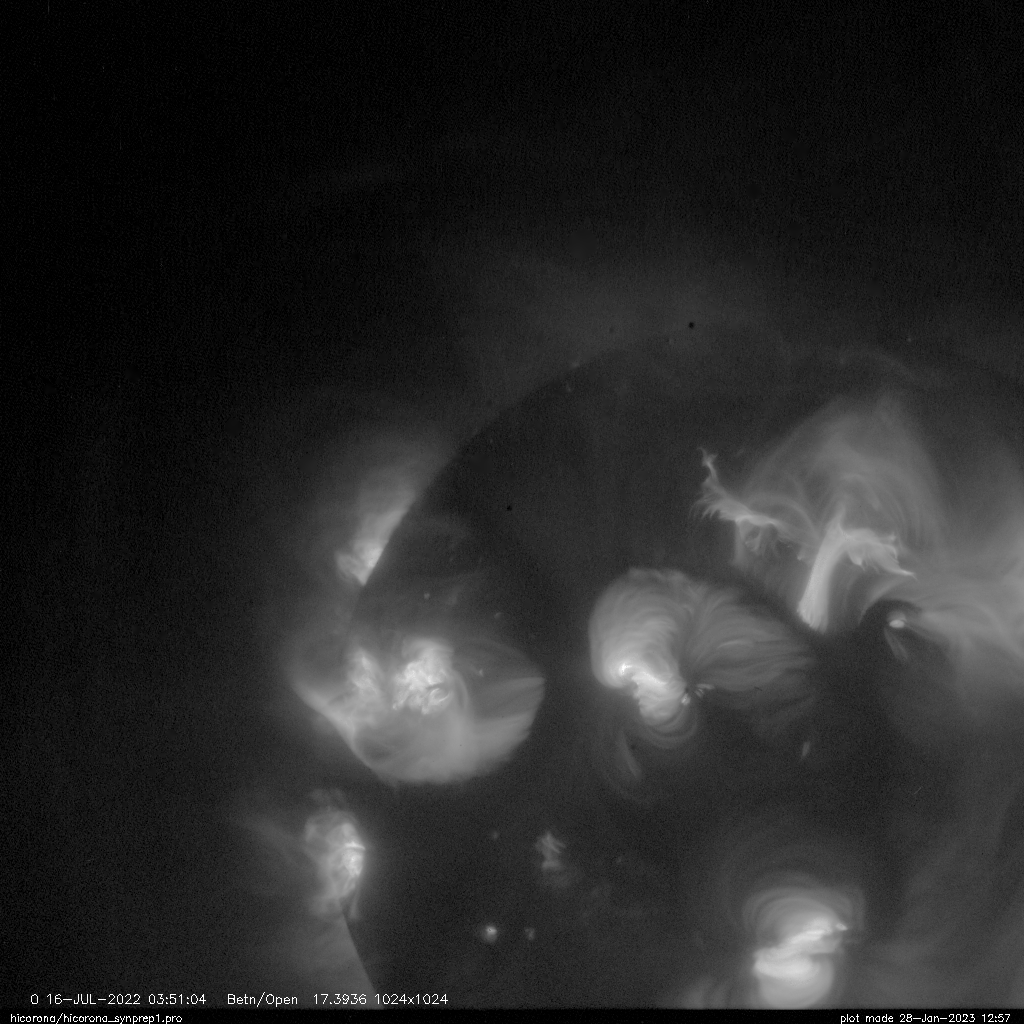
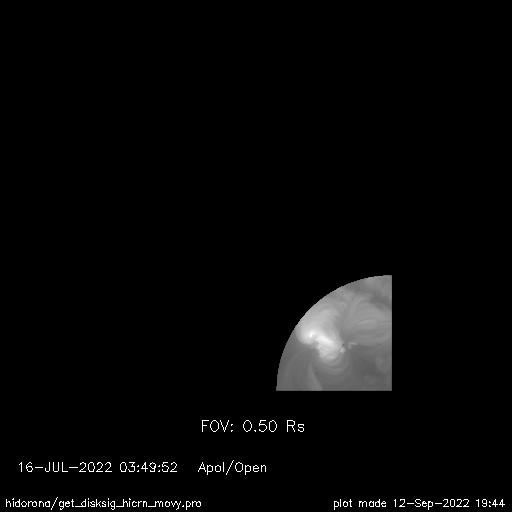
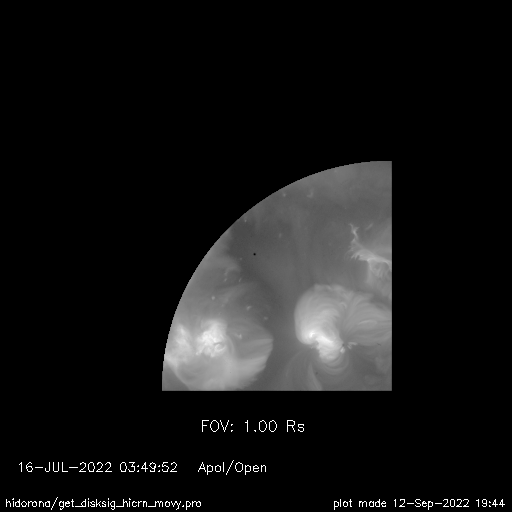
The current XRT irradiance study is performed by collecting the intensity from the Sun included within 1.1 solar radiai. However, the Sun's emission obviously extends over the outer area. The purpose of this study is to estimate how much energy is uncounted by the limited FOV.
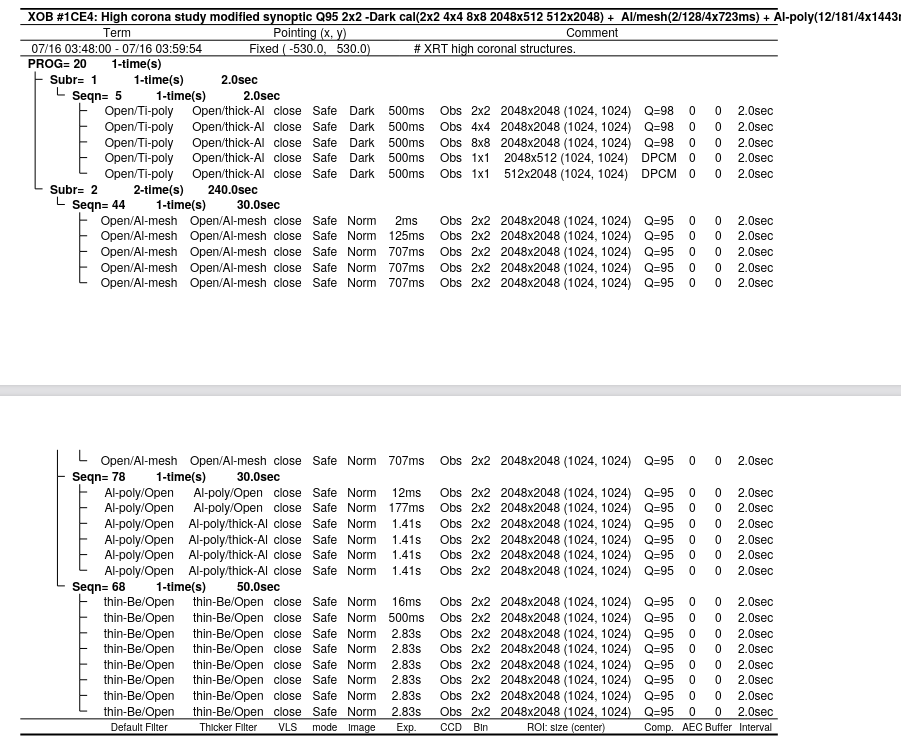
| XOB#1CE4 for high NE-corona obs. [click to enlarge] |
|
| XOB#1CDC for stray light measurements. |
The stray light component was then subtracted from the Al_mesh and Al_poly composite images, while for thin_Be filter the stray light component is still negligible.
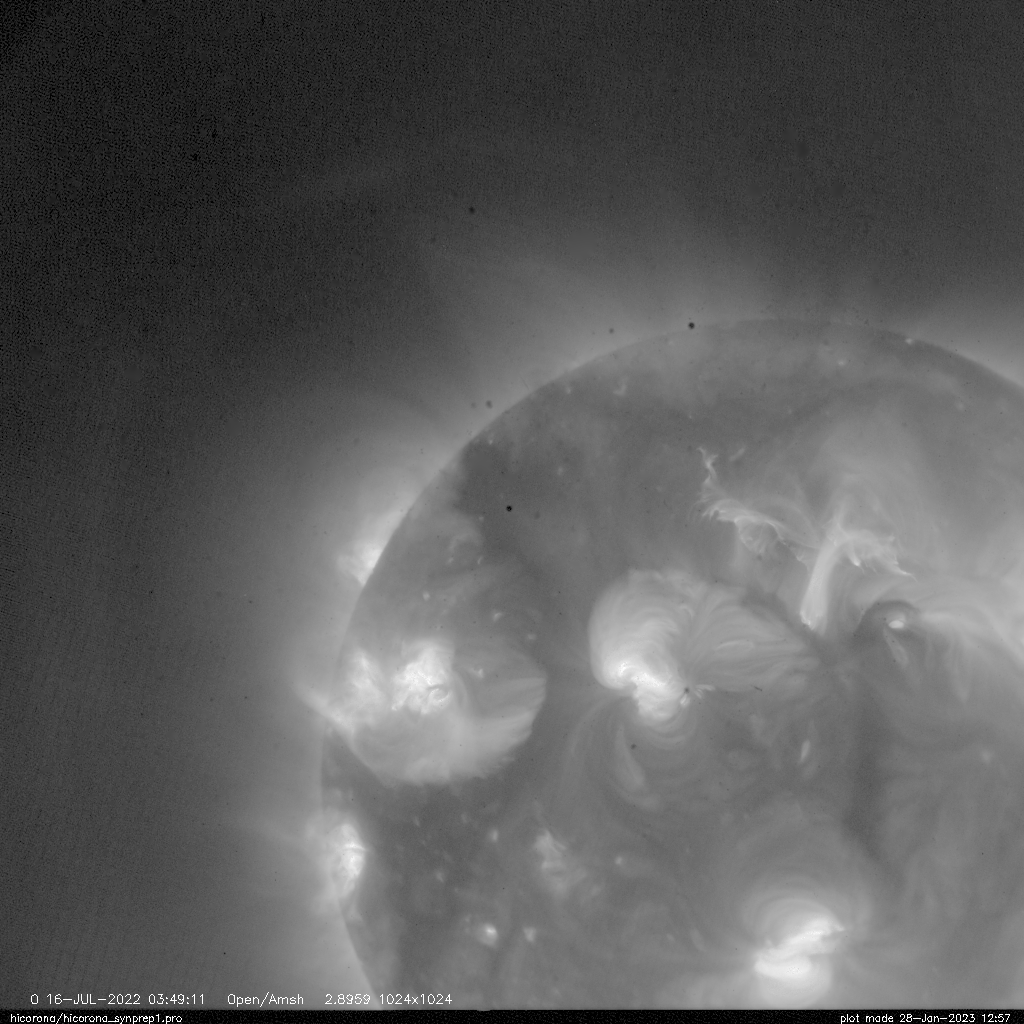
| Al_mesh composite image | Al_poly composite image | thin_Be composite image |
|
|
|
| Al_mesh stray light img subtracted | Al_poly stray light img subtracted | --- |
NOTE:
XRT pointing in Heliocentric coordinates (in arcsec).
coronal image (2022/07/16):     (-555.8, 551.3)
stray light image (2022/07/19): (-555.9, 549.1)
 |
 |
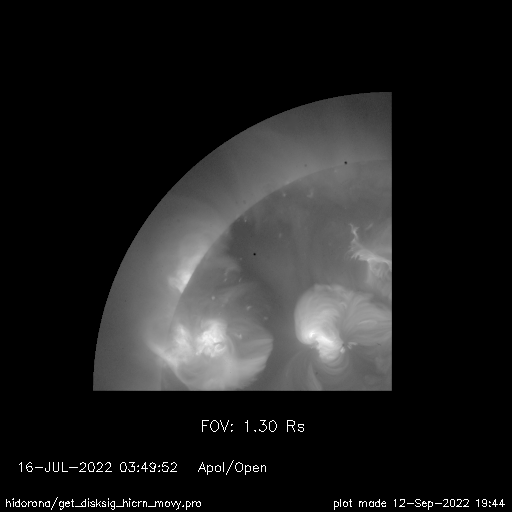 |
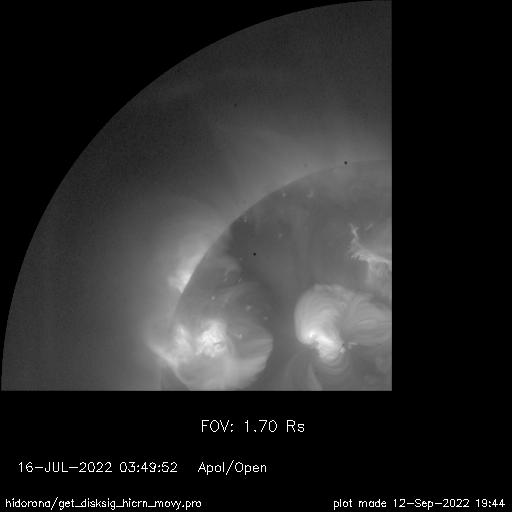 |
Total intensity of the corona included in the varying size of FOV.
[click image to enlarge]
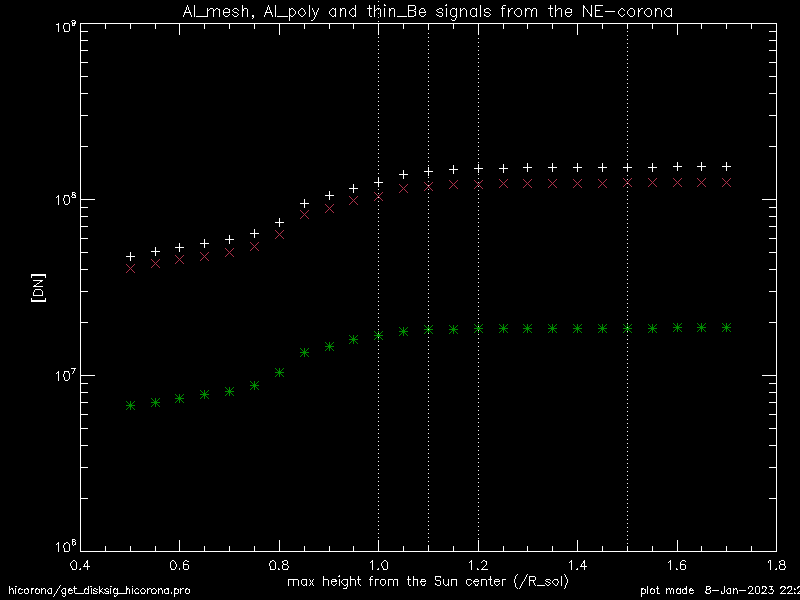 |
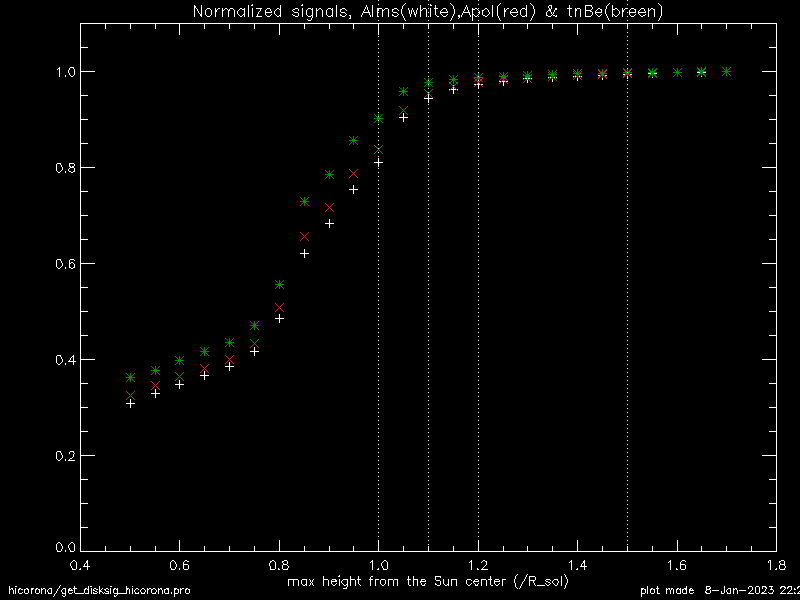 |
The ratio of the collected intensities by the FOV size, 1.0, 1.1, 1.2 and 1.3 Rs relative to the maxmum size (1.7 Rs).
-----------------------------------------------------------------
Filter                    FOV radius (in Rs)
               1.0         1.1         1.2         1.3       1.7
-----------------------------------------------------------------
Al_mesh:     0.810241    0.944704    0.973690    0.984621    1.0
Al_poly:     0.837398    0.953268    0.977095    0.986408    1.0
thin_Be:     0.901706    0.976902    0.987773    0.992324    1.0
-----------------------------------------------------------------
Total intensity of the corona included in the varying size of FOV.
[click image to enlarge]
 |
 |
| results with previous calibration | results with previous calibration |
-----------------------------------------------------------------
Filter pair               FOV radius (in Rs)
               1.0         1.1         1.2         1.3       1.7
-----------------------------------------------------------------
Apol/Alms:   1.03637     1.00847     1.00307     1.00160     1.0
tnBe/Alms:   1.05122     1.01428     1.00604     1.00326     1.0
tnBe/Apol:   1.05492     1.01665     1.00731     1.00400     1.0
-----------------------------------------------------------------
-----------------------------------------------------------------
Filter pair               FOV radius (in Rs)
               1.0         1.1         1.2         1.3       1.7
-----------------------------------------------------------------
Apol/Alms:   0.752963    0.934299    0.970927    0.983164    1.0
tnBe/Alms:   0.716275    0.923520    0.964119    0.979329    1.0
tnBe/Apol:   0.738689    0.919990    0.961549    0.977696    1.0
-----------------------------------------------------------------
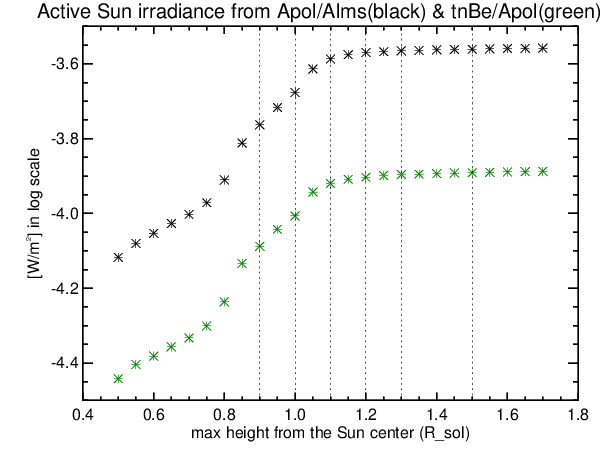
Soft X-ray irradiance calculatded for the varying size of FOV.
[click image to enlarge]
 |
| with previous calibration |
The ratio of the XRT irradiance (5-60A) calculated for the FOV size, 1.0 to 1.3 Rs relative to that for the maxmum size (1.7 Rs).
-----------------------------------------------------------------
Filter pair               FOV radius (in Rs)
               1.0         1.1         1.2         1.3       1.7
-----------------------------------------------------------------
Apol/Alms:   0.764553    0.937850    0.974617    0.986902    1.0
tnBe/Alms:   0.731757    0.928466    0.964119    0.979329    1.0
tnBe/Apol:   0.762626    0.925620    0.967432    0.977696    1.0
-----------------------------------------------------------------
[click image to enlarge]
 |
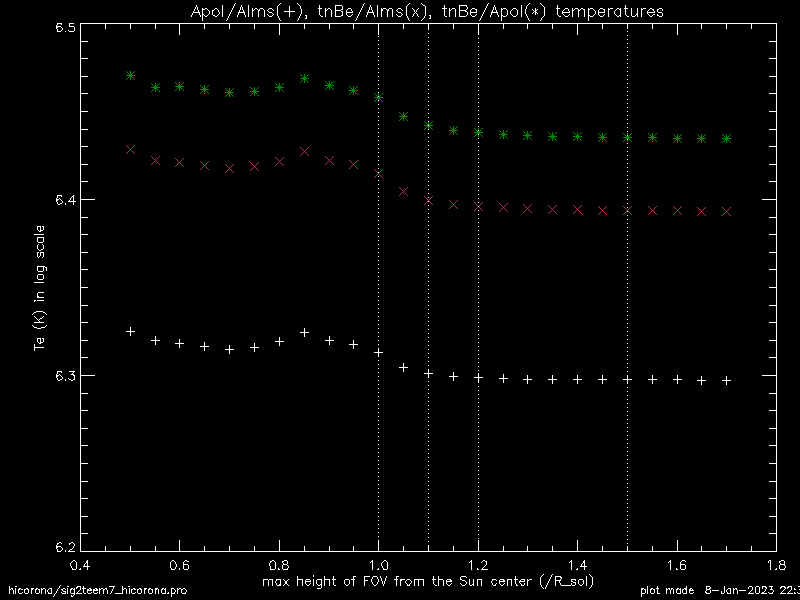
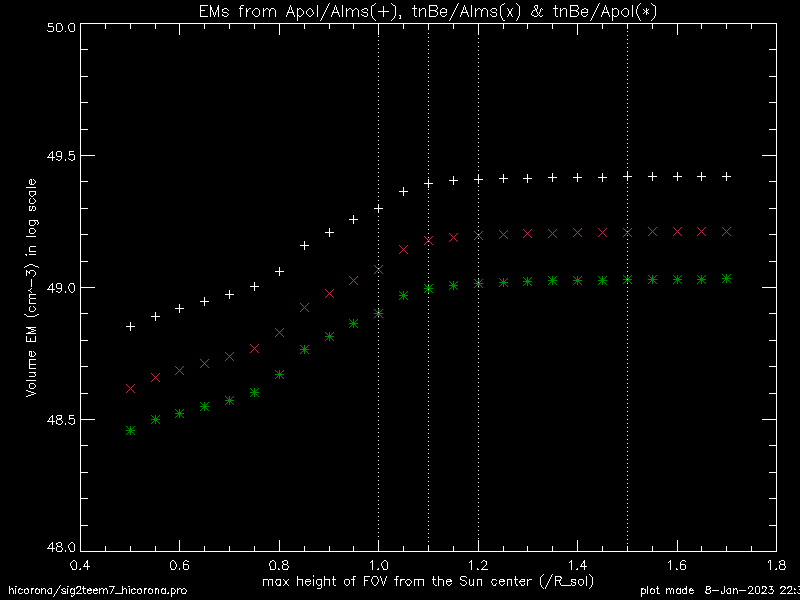
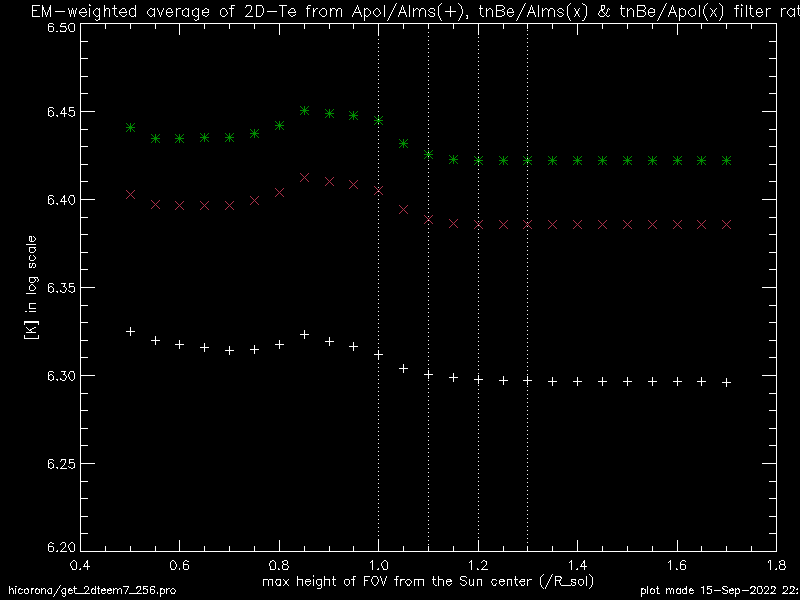
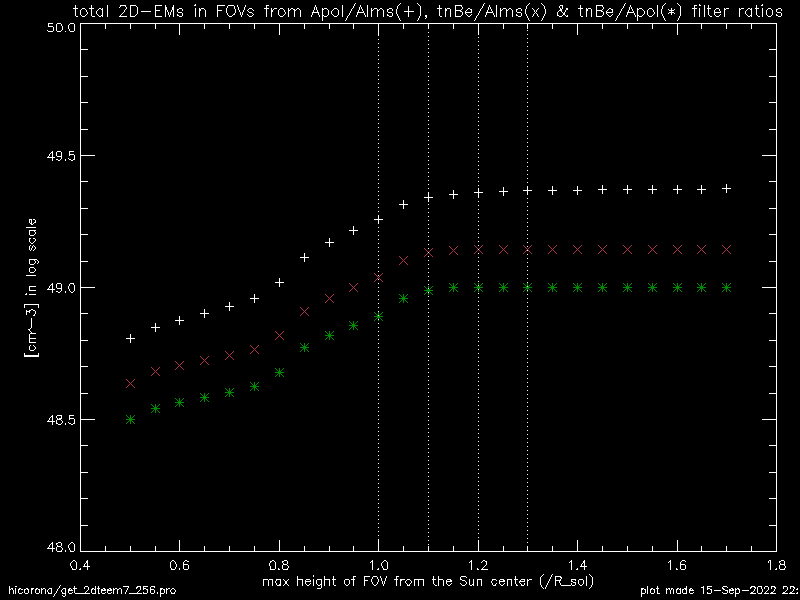
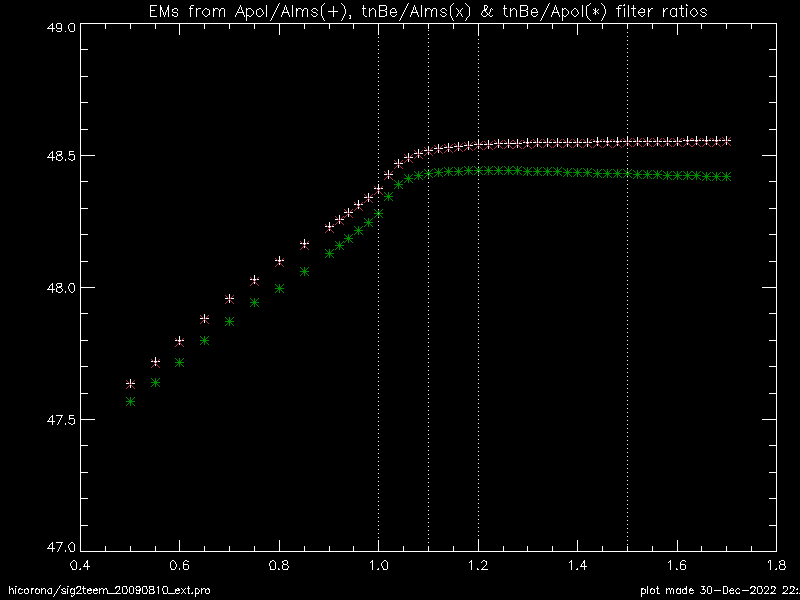
EM-weighted average of Te and total EM within the varying FOV from 2D maps
of Te and EM from 3 different filter ratios.
[click image to enlarge]
 |
 |
-----------------------------------------------------------------
Filter pair               FOV radius (in Rs)
               1.0         1.1         1.2         1.3       1.7
-----------------------------------------------------------------
Apol/Alms:   1.036766    1.009585    1.003554    1.001787    1.0
tnBe/Alms:   1.045464    1.006318    1.000000    1.000000    1.0
tnBe/Apol:   1.053373    1.007706    1.000000    1.000000    1.0
-----------------------------------------------------------------
-----------------------------------------------------------------
Filter pair               FOV radius (in Rs)
               1.0         1.1         1.2         1.3       1.7
-----------------------------------------------------------------
Apol/Alms:   0.762972    0.929118    0.967767    0.981841    1.0
tnBe/Alms:   0.784352    0.972834    1.000000    1.000000    1.0
tnBe/Apol:   0.779435    0.970815    1.000000    1.000000    1.0
-----------------------------------------------------------------
[click image to enlarge]
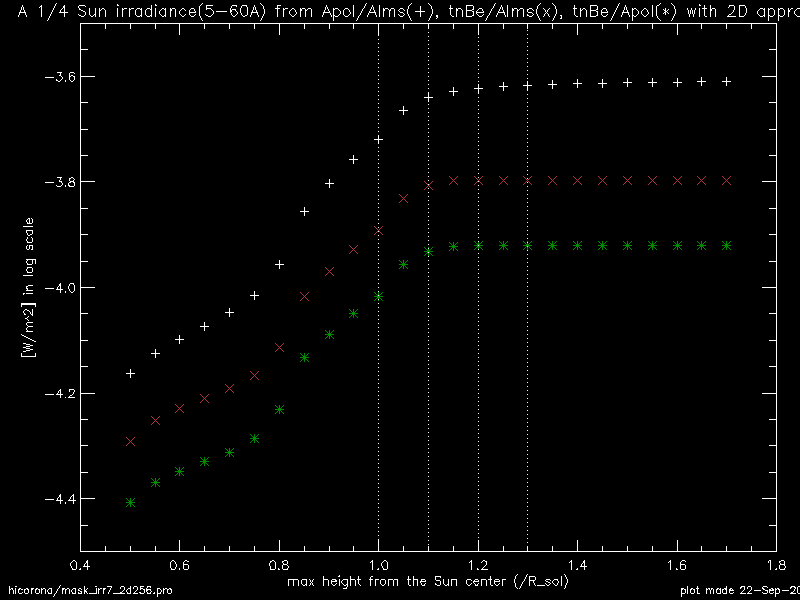 |
The XRT irradiance included in the FOV size, 1.0, 1.1, 1.2, and 1.3 Rs relative to that for the maxmum size (1.7 Rs).
-----------------------------------------------------------------
Filter pair               FOV radius (in Rs)
               1.0         1.1         1.2         1.3       1.7
-----------------------------------------------------------------
Apol/Alms:   0.775731    0.932218    0.968845    0.982374    1.0
tnBe/Alms:   0.801218    0.975571    1.000000    1.000000    1.0
tnBe/Apol:   0.801115    0.974530    1.0000000   1.0000000   1.0
-----------------------------------------------------------------
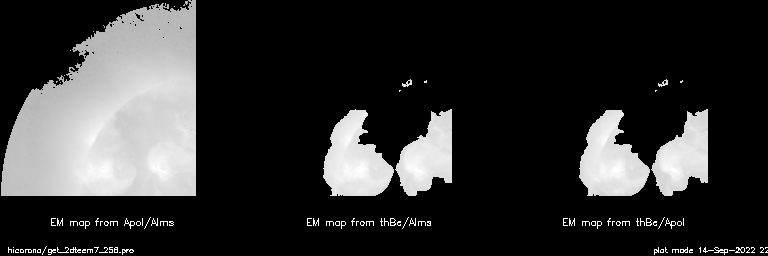
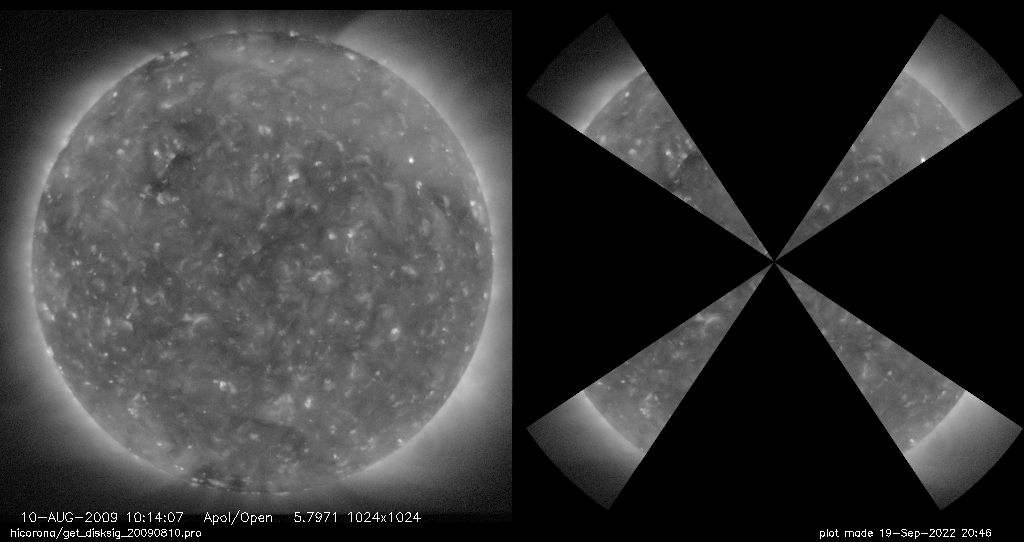
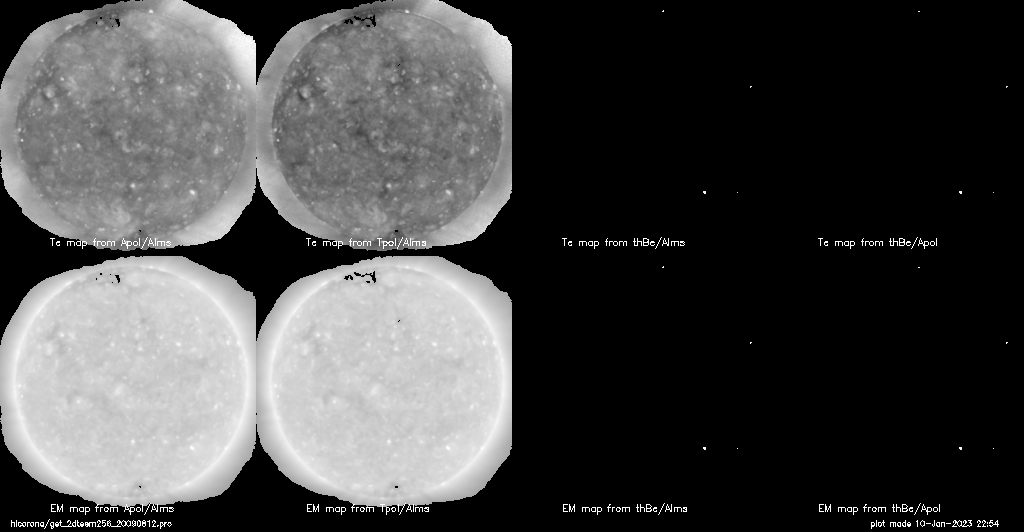
Instead of using total coronal intensities collected from the FOV
of varying size, in this section we use the 2-D information of the
observed corona to derive the Te, EM and irradiance averaged over
the FOV.
[click image to enlarge]
 |
 |
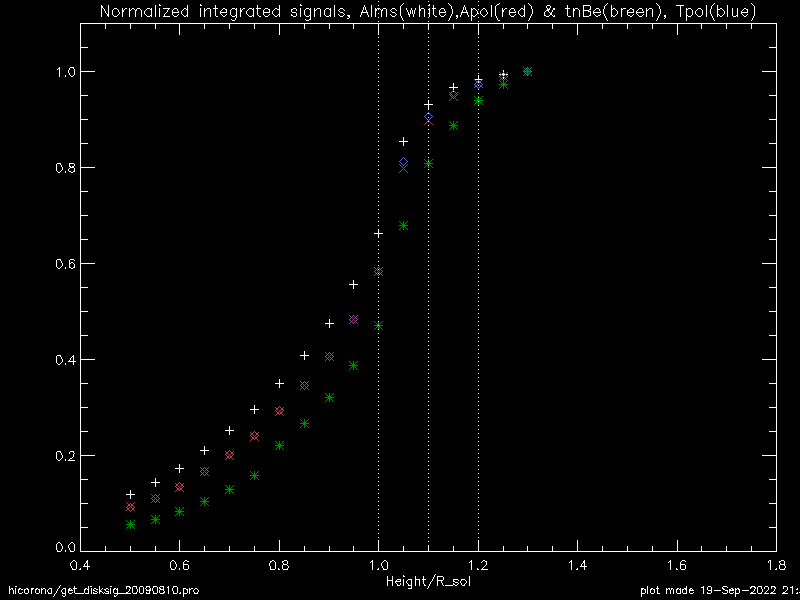 |
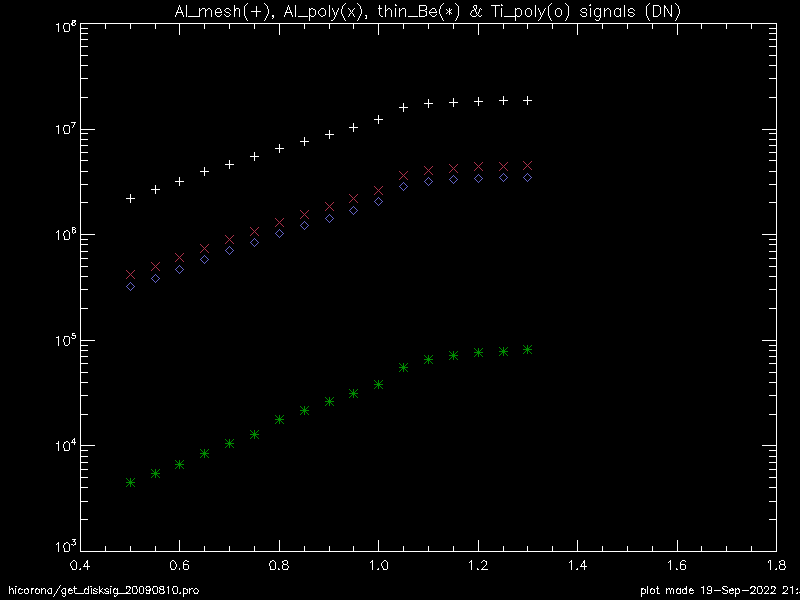
The XRT intensities included in the 4-leafed FOV size, 1.0, 1.1 & 1.2 relative to that of the maxmum size (1.3 Rs).
-----------------------------------------------------------------
Filter                    FOV radius (in Rs)
               1.0         1.1         1.2         1.3
-----------------------------------------------------------------
Al_mesh:     0.662069    0.932009    0.983907      1.0
Al_poly:     0.583695    0.898404    0.974255      1.0
Ti_poly:     0.583140    0.907152    0.973879      1.0
thin_Be:     0.471829    0.809106    0.938594      1.0
-----------------------------------------------------------------
 |
 |
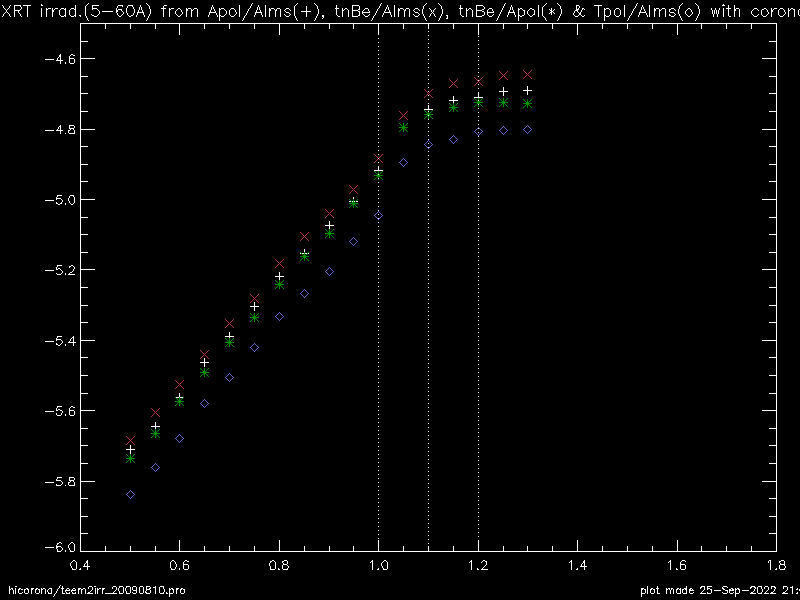
| using Chianti ver.9 instead of ver.10 | using Chianti ver.9 instead of ver.10 |
-----------------------------------------------------------------
Filter pair                FOV radius (in Rs)
                 1.0         1.1         1.2         1.3
-----------------------------------------------------------------
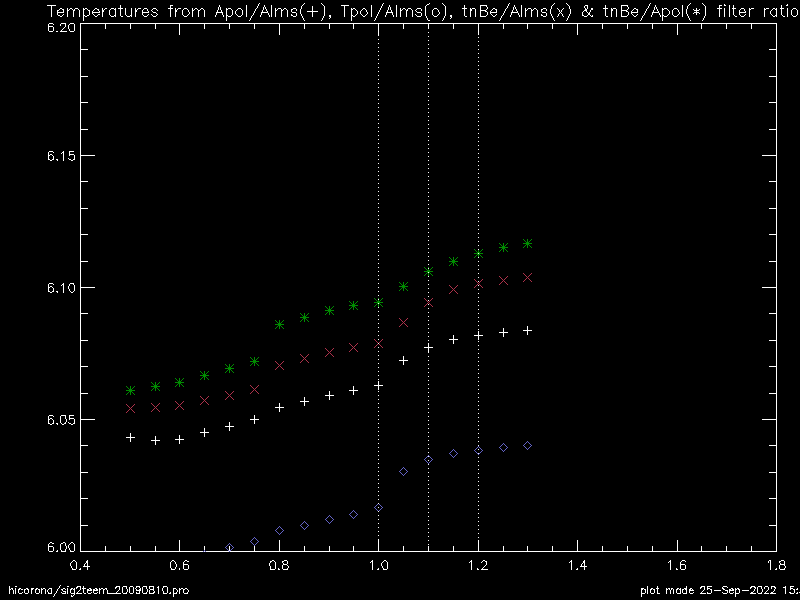
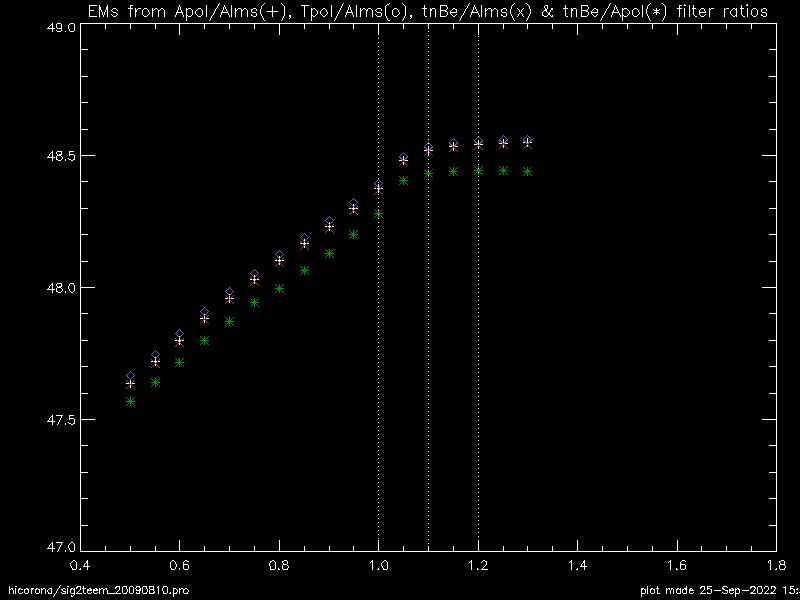
Apol/Alms:     0.953771    0.985686    0.996086      1.0
Tpol/Alms:     0.947060    0.987906    0.995361      1.0
tnBe/Alms:     0.944312    0.978498    0.994699      1.0
tnBe/Apol:     0.949433    0.975471    0.990896      1.0
-----------------------------------------------------------------
-----------------------------------------------------------------
Filter pair                FOV radius (in Rs)
                 1.0         1.1         1.2         1.3
-----------------------------------------------------------------
Apol/Alms:     0.670474    0.935276    0.984815      1.0
Tpol/Alms:     0.680297    0.937093    0.985923      1.0
tnBe/Alms:     0.668562    0.935596    0.985187      1.0
tnBe/Apol:     0.691764    0.980017     1.00301      1.0
-----------------------------------------------------------------
 |
-----------------------------------------------------------------
Filter pair                FOV radius (in Rs)
                 1.0         1.1         1.2         1.3
-----------------------------------------------------------------
Apol/Alms:     0.593938    0.881161    0.956145      1.0
Tpol/Alms:     0.569324    0.905216    0.985923      1.0
tnBe/Alms:     0.580185    0.885690    0.958894      1.0
tnBe/Apol:     0.621636    0.930290    1.00301       1.0
-----------------------------------------------------------------
 |
 |
 |
 |
 |
 |
 |
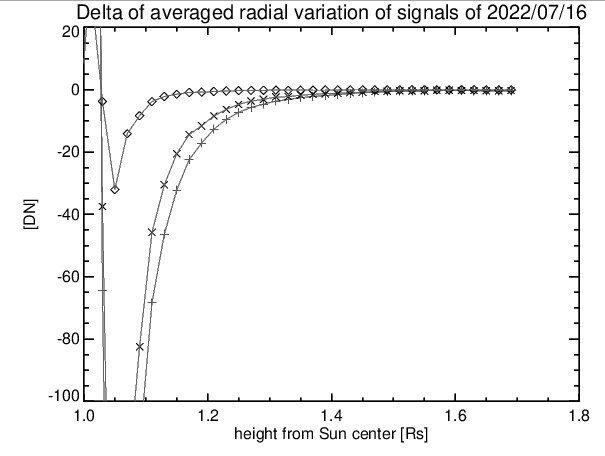
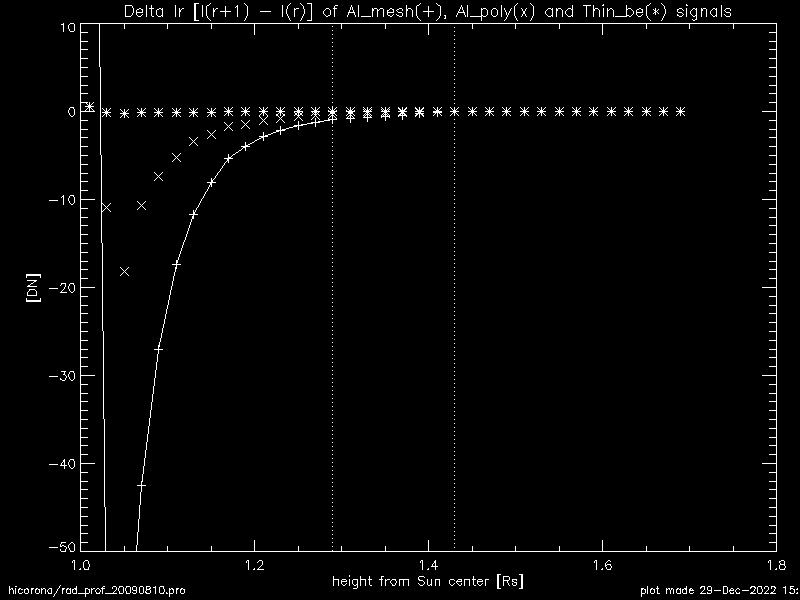
| Intensity decreasing rate <1.29 : observed >1.31 : assumed as reaching zero at 1.43 Rs |
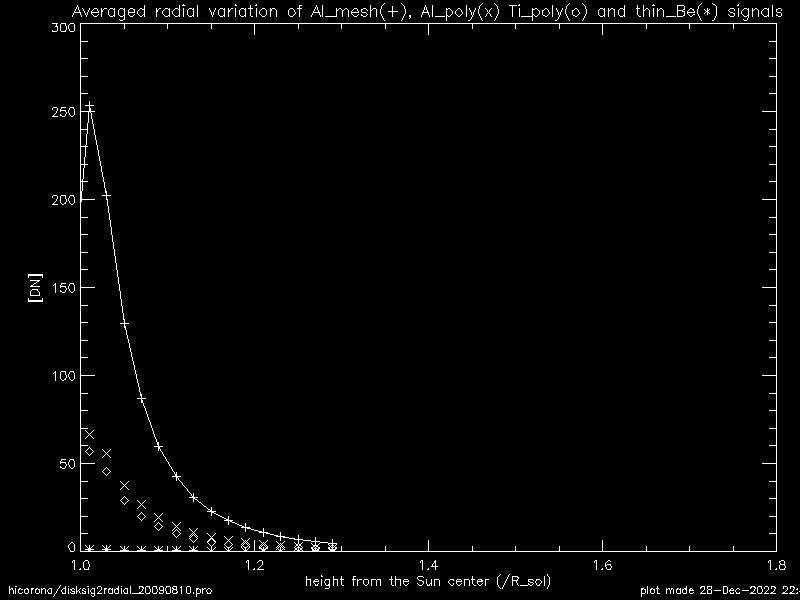
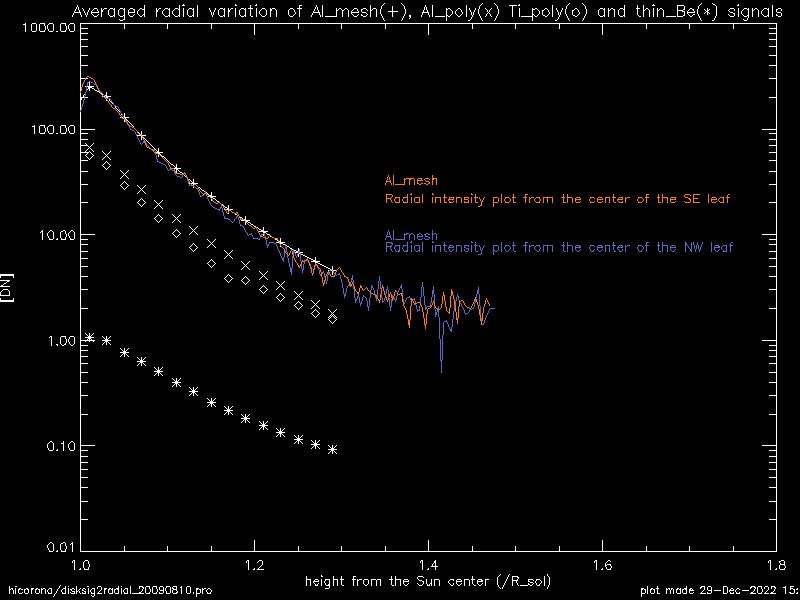
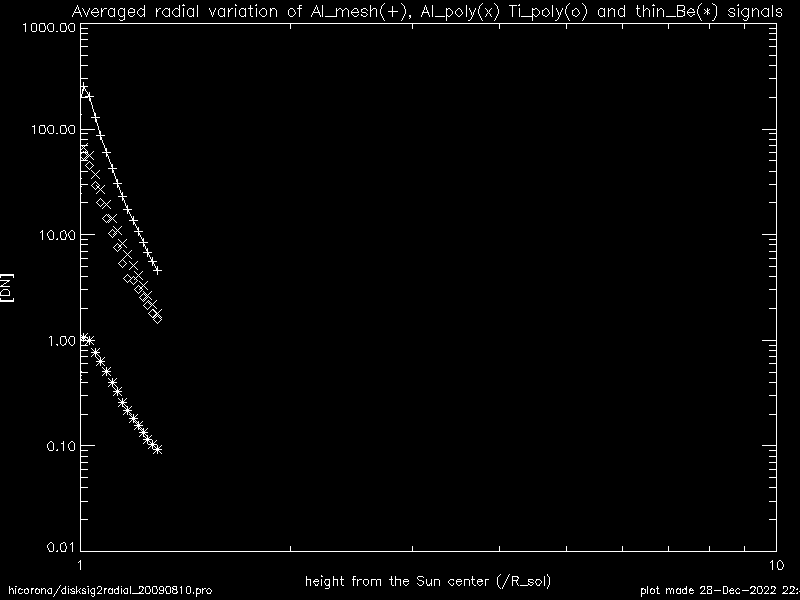
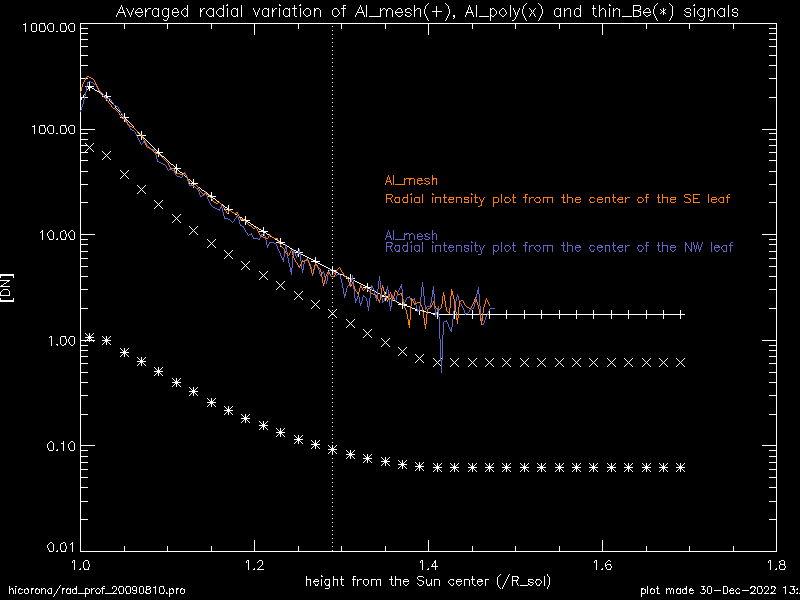
Radial intensity variation <1.29 : observed >1.31 : calculated |
 |
 |
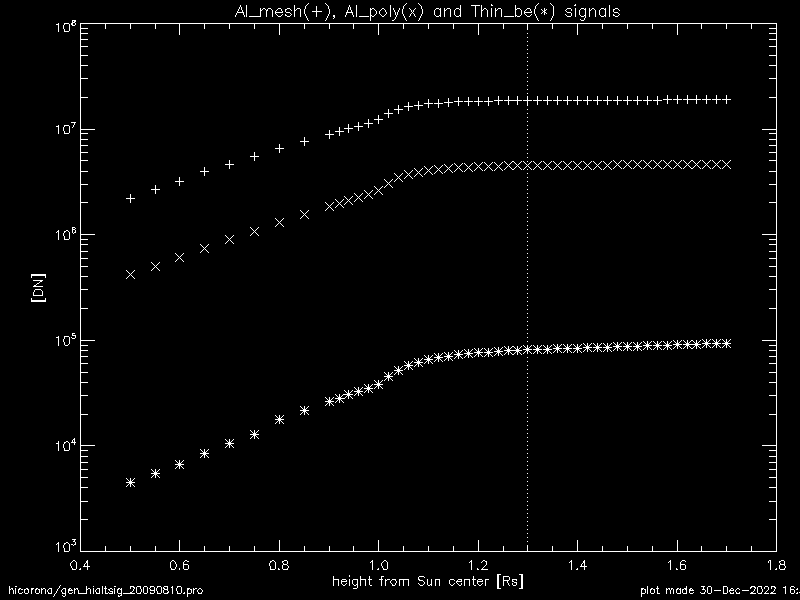
| height ≤ 1.30 : observed height > 1.30 : calculated |
 |
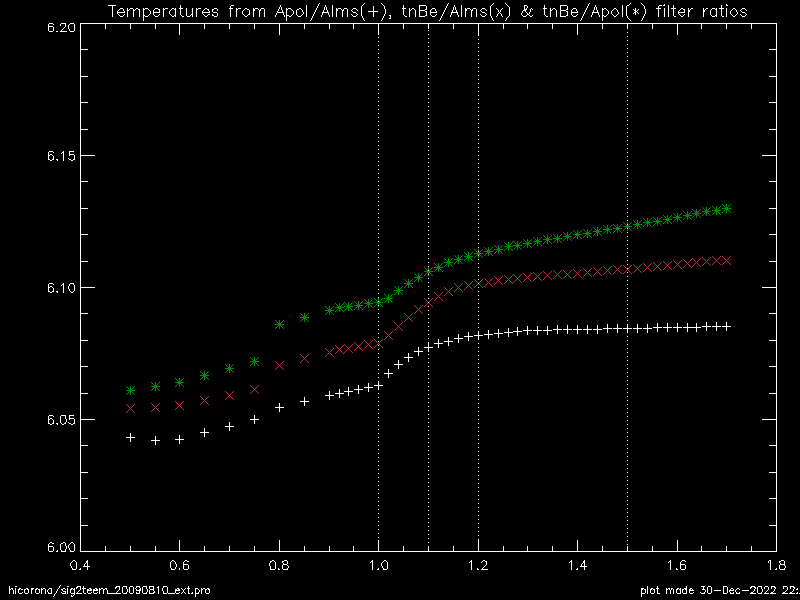
| Temperature | Emission Measure |
 |
 |
 |