Effect of new atomic data (Chianti ver. 7.1) on XRT response functions
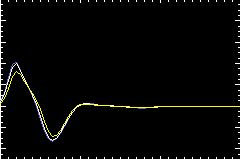
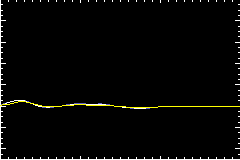
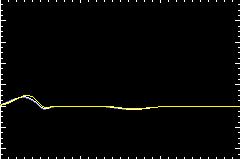
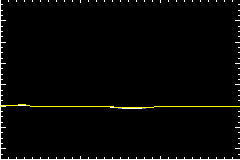
The new version of Chianti (ver. 7.1) was released in October 2012.
According to their announcement, the main part is the change by
"the inclusion of a large number of configurations to the atomic models of
Fe VIII to XIV. These configurations give rise to a forest of spectral
lines in the 50-170 A wavelength range...".
In response to this change, the XRT response functions were re-calculated
using the latest version of atomic data.
-
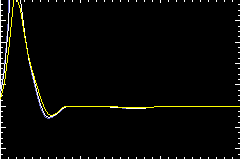
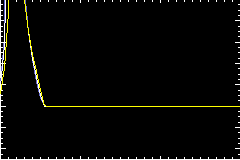
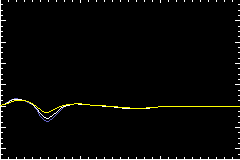
Changes in response functions are found only in low temperatures (below 6MK).
These changes appear most significant in Alminum filters (Al-poly, Al-mesh,
med-Al, and thick-Al), and negligible in med-Be and thick-Be filters.
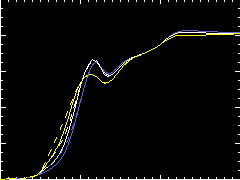
As a result, ratio functions using thinner Alminum filters (C-poly/Al-poly,
Ti-poly/Al-poly) suffer notable change below 6MK. The ratios between thick
filters are less affected (see section 1 and 2).
-
A different type of abundance set, 'sun_coronal_2012_Schmelz.abund' was newly introduced,
in addition to the original 'coronal', 'hybrid' and'photospheric' abundance sets.
This new set is designated as a 'coronal' abuncances, but actually is an updated
version of the 'hybrid' abundances. The comparison between traditioal hybrid
(sun_hybrid_ext.abund) and the new one(sun_coronal_2012_Schmelz.abund)
shows that the filter ratios from the latter set give slightly higher temperatures
(see section 3).
back to my XRT response function page
1. The Respnse functions.
The solar spectra were calculated with the latest Chianti version 7.1, for
'coronal', 'hybrid', and 'photospheric' abundances.
- (a) solspec_ch601_corona_chianti.genx
- (b) solspec_ch601_hybrid_chianti.genx
- (c) solspec_ch601_photos_chianti.genx
- (d) solspec_ch710_corona_chianti.genx
- (e) solspec_ch710_hybrid_chianti.genx
- (f) solspec_ch710_photos_chianti.genx
Then I modified XRT_FLUX.PRO so that it can access the above spectrum files
by setting the corresponding keyword.
IDL> flux_c = xrt_flux(logte, f1,f2, tim, /corona)
IDL> flux_h = xrt_flux(logte, f1,f2, tim, /hybrid)
IDL> flux_p = xrt_flux(logte, f1,f2, tim, /photos)
IDL> flux_c7 = xrt_flux710(logte, f1,f2, tim, /corona)
IDL> flux_h7 = xrt_flux710(logte, f1,f2, tim, /hybrid)
IDL> flux_p7 = xrt_flux710(logte, f1,f2, tim, /photos)
Below are the response functions of all the X-ray analysis filters available
at XRT. The calibration data released on 20-Aug-2010 was used for
these calculation.
It is known that the contamination accumulated on the CCD modifies
the XRT response functions. As the amount of contamination varies with time,
response functions are time-dependant. For the later convenience of analysis,
the following response functions were calculated for the contamination level
as of 12-Nov-2006.
Plots are clickable (i.e., click each plot to show more detailed info).
| Al-poly/Open | C-poly/Open | thin-Be/Open |
med-Be/Open | med-Al/Open |
 |
 |
 |
 |
 |
| Open/Al-mesh | Open/Ti-poly | Open/thick-Al |
Open/thick-Be | Al-poly/Ti-poly |
 |
 |
 |
 |
 |
2. The Filter Ratios.
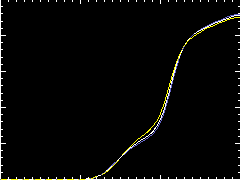
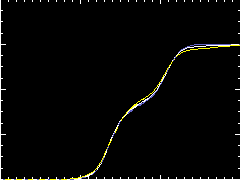
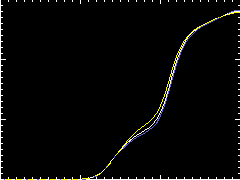
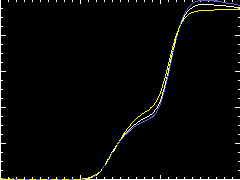
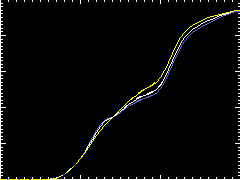
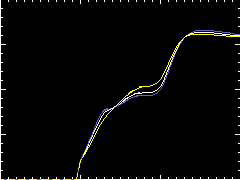
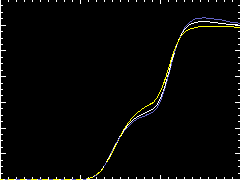
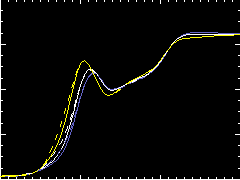
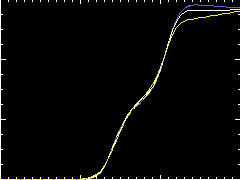
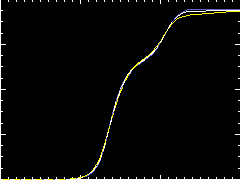
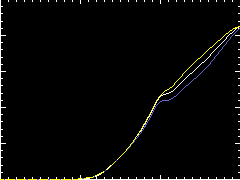
These plots shows that the Chianti ver 7.1 makes no sigificant difference
in the filter ratio curves relative to those with version 6.0.1.
Again, plots are clickable (i.e., click each plot to show more detailed info).
| C-poly/Al-poly | thin-Be/Al-poly | med-Be/Al-poly |
med-Al/Al-poly | thin-Be/C-poly |
 |
 |
 |
 |
 |
| med-Be/C-poly | med-Al/C-poly | med-Be/thin-Be |
med-Al/thin-Be | med-Al/med-Be |
 |
 |
 |
 |
 |
| Al-poly/Al-mesh | Ti-poly/Al-mesh | med-Al/Ti-poly |
thick-Be/med-Al | Ti-poly/Al-poly |
 |
 |
 |
 |
 |
| thin-Be/Al-mesh | thin-Be/Ti-poly | thick-Be/thick-Al |
thick-Al/Ti-poly | |
 |
 |
 |
 |
|
3. Other changes.
According to the release note, the following addition/change were also made
in the Chianti ver. 7.1.
- Addition of a new abundance set, 'sun_coronal_2012_schmelz.abund'.
This set is designated as a different version of 'coronal' abuncances,
but it is actually an updated version of the 'hybrid' abundances, based on
the recent paper, Schmelz, J.T., et al. (2012) ApJ, 755, 33 .
The comparison plots of the response functions with new and old
hybrid abundances for the 5 filters as samples.
The filter ratios of response functions with the new and old hybrid abundances.
- The data for ionization equilibria, 'chianti.ioneq', was upgraded with
improved recombination rates.
This effect is already included in the above results (section 1 and 2).
To see the pure effect of chianti.ioneq, the response functions were calculated
using old chianti.ioneq (which was renamed to chianti_verion6.ioneq),
under the Chianti ver. 7.1 environment. They were compared with the
new response functions calculated in section 1.
Comparisons were made for 5 sample filters using 'sun_coronal_ext' abundances.


