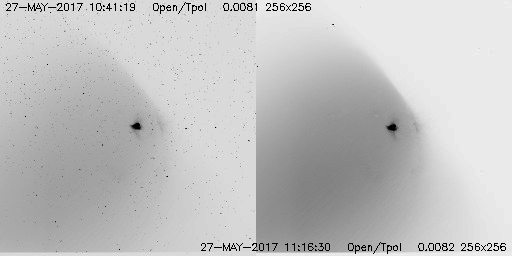
(26 June, 2017 by Aki Takeda)
(11 Sept, 2017 added results of later measurements.)
(22 Sept, 2017 added section of image correction.)
(10 Oct, 2020 corrected wrong label of "after PREP comparison"
plot for Al-mesh.)

| ID No. | date & time (UT) | XOB | purposes (link: obtained plots & images) | memo |
| 5 | 13-Jun-2017, 17:31:30 | 1B98 | light curve, Ti-poly (1.0s), and Al-mesh(2.83s) at DC. | prev. bakeout + 6 days.
Ti-poly > 2500 DN. G-band monitor images saturated. |
| 6 | 14-Jun-2017, 18:07:00 | 1B99 | light curve, Al-poly (4.0s), Thin-Be (11.3s) at DC | prev. bakeout + 7 days. G-band monitor images saturated. Sunset during thin-Be stray light exposure. |
| 7 | 15-Jun-2017, 18:42:30 | 1B9A | light curve, med-Al (32.0s) at DC | prev. bakeout + 8 days. G-band monitor images saturated. Sunset during stray light exposure. |
| 8 | 16-Jun-2017, 17:39:30 | 1B9B | light curve, med-Be (22.6s) at DC | prev. bakeout + 9 days. G-band monitor images saturated. Sunset during stray light exposure. |
| 9 | 18-Jun-2017, 17:12:00 | 1B9E | light curve, Ti-poly (500ms), Al-mesh (2.83s) at DC | prev. bakeout + 11 days. Monitor imgs to 384x384 no binning. |
| 10 | 19-Jun-2017, 17:47:30 | 1B9F | light curve, Al-poly (4.0s), Thin-Be (11.3s) at DC | prev. bakeout + 12 days. Monitor imgs to 384x384 no binning. Sunset during thin-Be stray light exposure. |
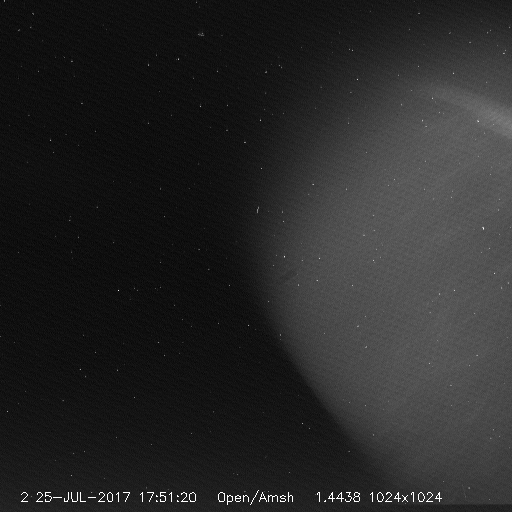
| 11 | 25-Jul-2017, 17:45:30 | 1BAC | light curve, Al-mesh(1.4s) and Al-poly(2.0s) at E-limb | prev. bakeout + 7 days. Monitor imgs to Al-mesh 384x384 full-res. |
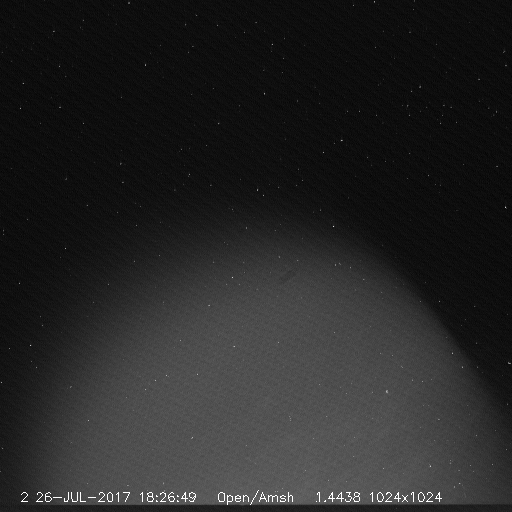
| 12 | 26-Jul-2017, 18:21:00 | 1BAC | light curve, Al-mesh(1.4s) and Al-poly(2.0s) at N-limb | prev. bakeout + 8 days. Monitor imgs to Al-mesh 384x384 full-res. |
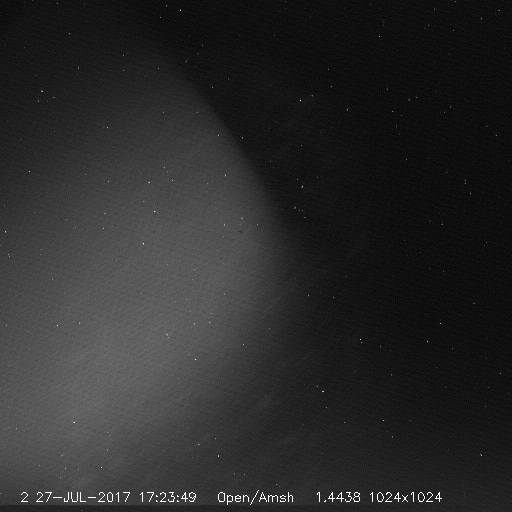
| 13 | 27-Jul-2017, 17:18:00 | 1BAC | light curve, Al-mesh(1.4s) and Al-poly(2.0s) at W-limb | prev. bakeout + 9 days. Monitor imgs to Al-mesh 384x384 full-res. Al_poly image looks strange. Need to confirm. |
| 14 | 28-Jul-2017, 17:53:00 | 1BAC | light curve, Al-mesh(1.4s) and Al-poly(2.0s) at S-limb | prev. bakeout + 10 days. Monitor imgs to Al-mesh 384x384 full-res. |
| 15 | 8-Aug-2017, 17:51:30 | 1BAE | light curve, Al-mesh(1.4s) and Ti-poly(500ms) at DC, | prev. bakeout + 1 days. Monitor imgs to Al-mesh 384x384 full-res. No NGT event, but X-ray well absorbed. |
| 16 | 9-Aug-2017, 18:27:30 | 1BAF | light curve, Al-poly(2.8s) and Thin-Be(11.3s) at DC, | prev. bakeout + 2 days. Monitor imgs to Al-mesh 384x384 full-res. No NGT event, but X-ray well absorbed. |
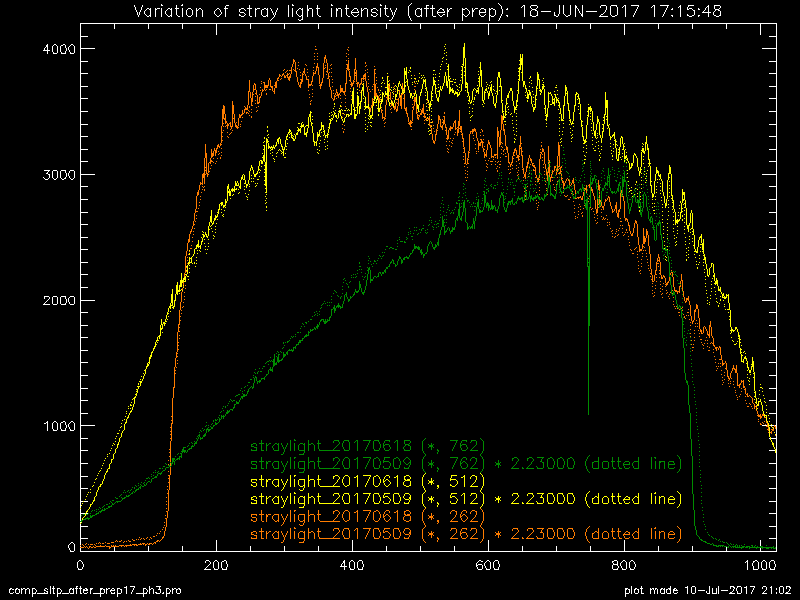
| 20170618 v.s. 20170509 (bo+11d v.s. bo+14d) |
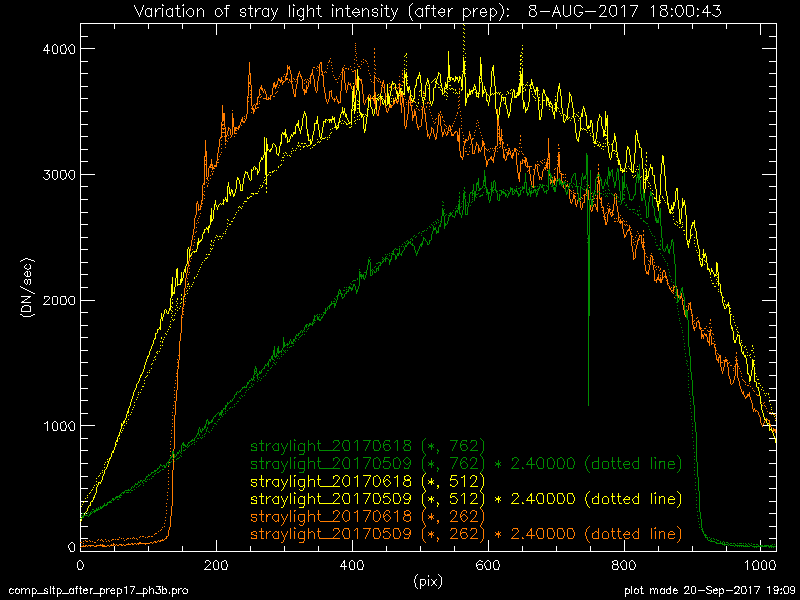
20170808 v.s. 20150718 (bo+1d v.s. bo+1d) |
|
|
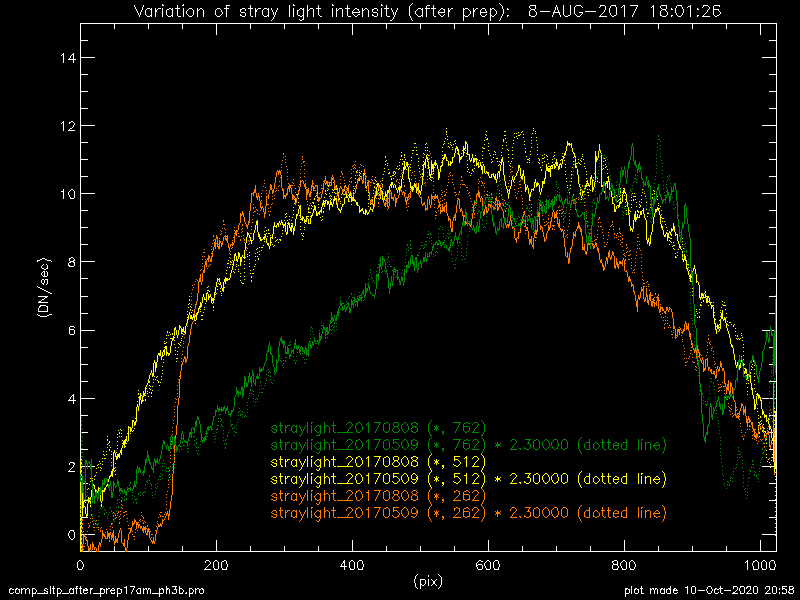
After PREP comparison
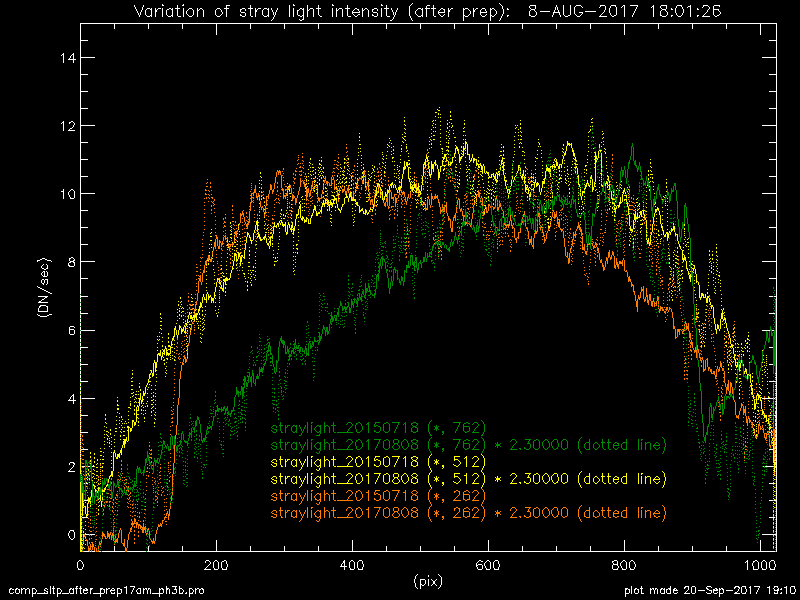
| 20170808 v.s. 20150718 (bo+1d v.s. bo+1d) |
20170808 v.s. 20170509 (bo+1d v.s. bo+14d) |
|
|
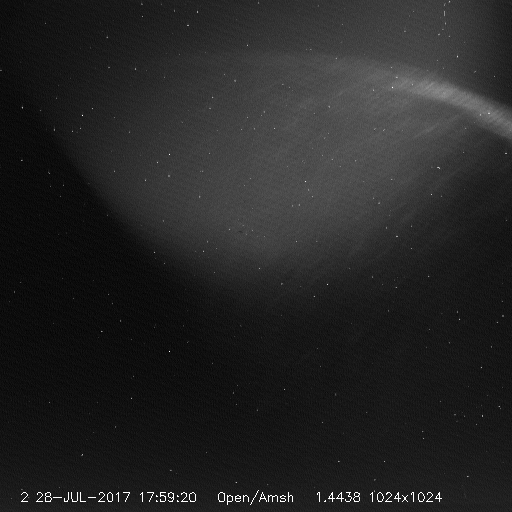
| Am 20170725 (1.4s) - E-limb (ph3) - |
Am 20170726 (1.4s) - N-limb (ph3) - |
Am 20170727 (1.4s) - W-limb (ph3) - |
Am 20170728 (1.4s) - S-limb (ph3) - |
|
|
|
|
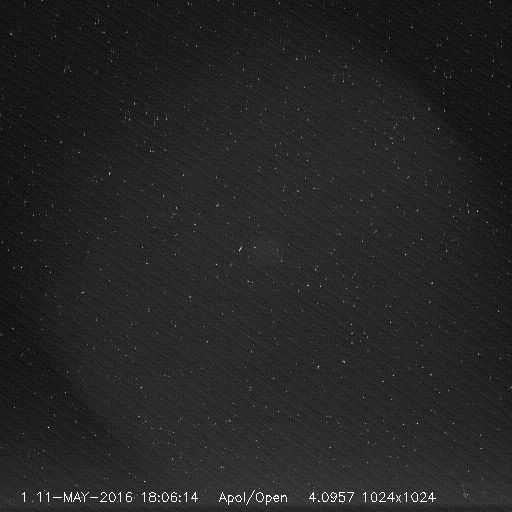
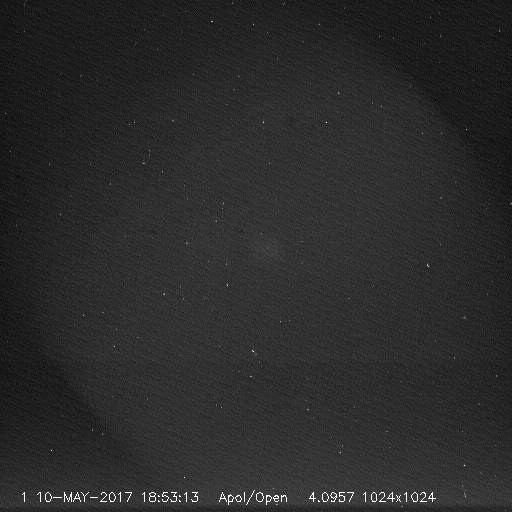
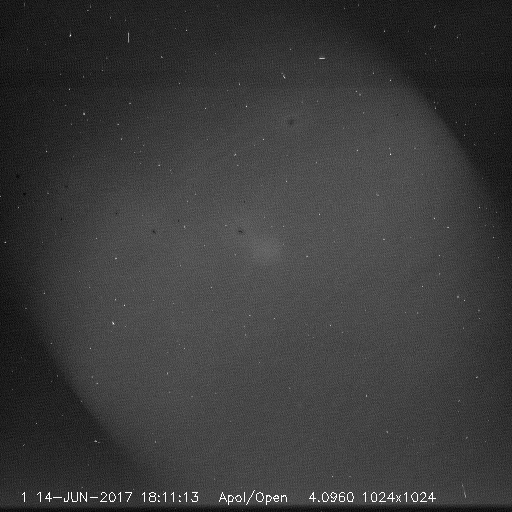
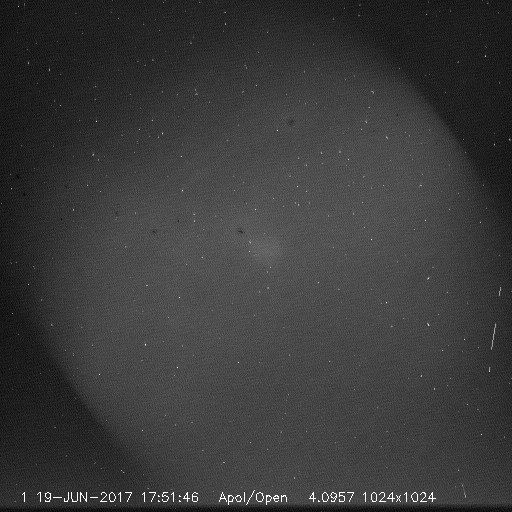
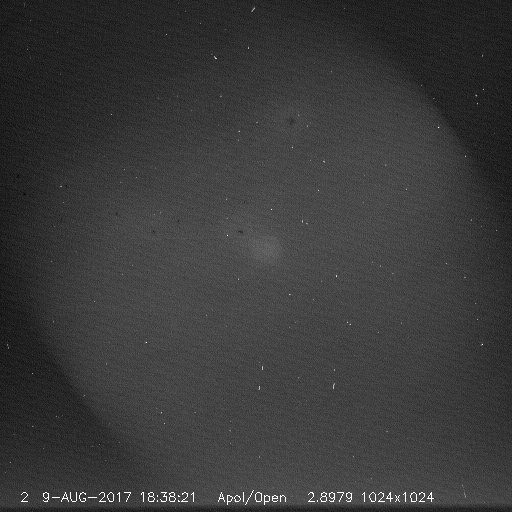
| Ap 20160511 (4.1s) - phase 2 - [bo+9d] |
Ap 20170510 (4.1s) - phase 2 - [bo+15d] |
Ap 20170614 (4.1s) - phase 3 - [bo+7d] |
Ap 20170619 (4.1s) - phase 3 - [bd+12d] |
Ap 20170809 (2.8s) - phase 3 - [bd+2d] |
|
|
|
|
|
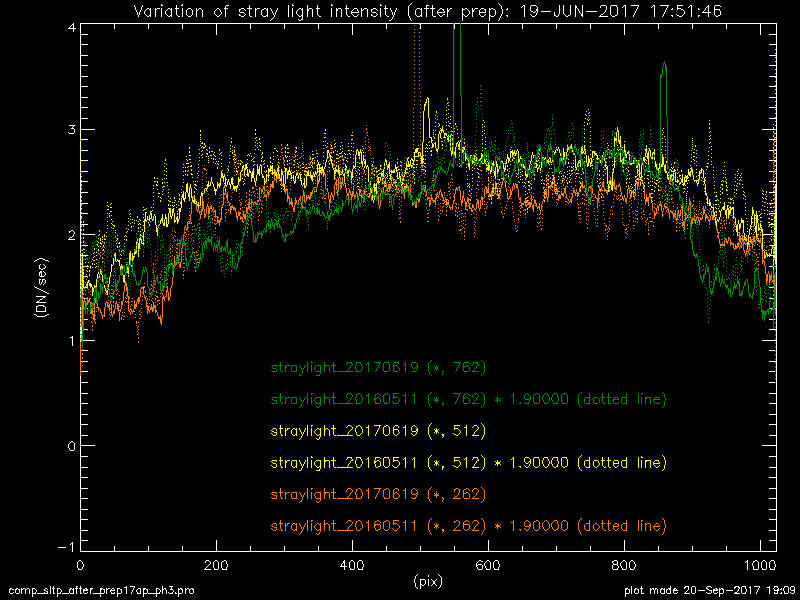
After PREP comparison
| 20170619 v.s. 20160511 (bo+12d v.s. bo+9d) |
|
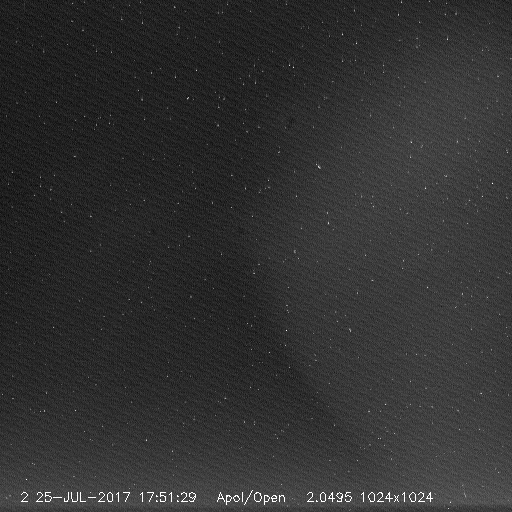
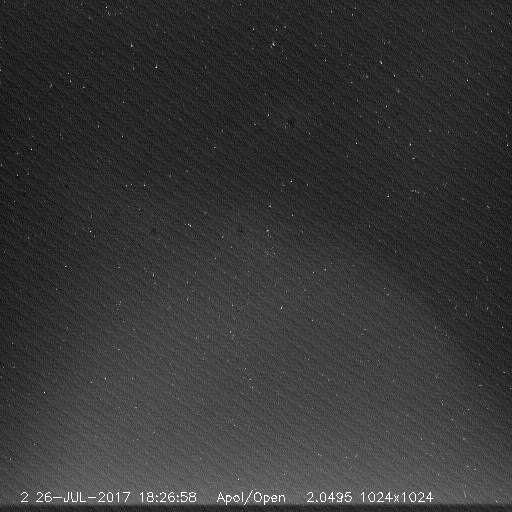
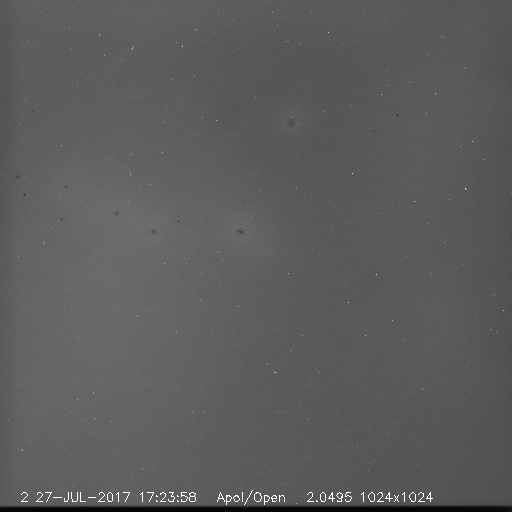
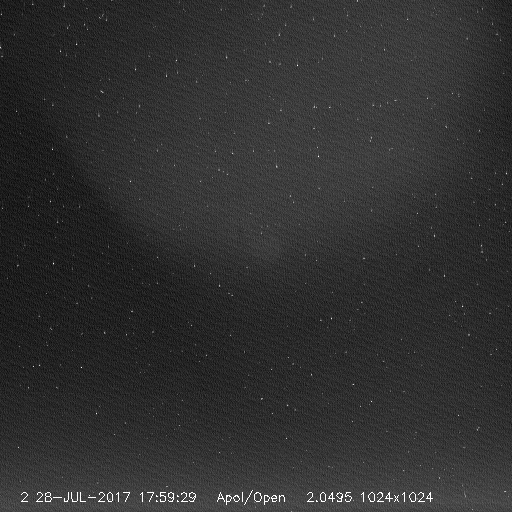
| Ap 20170725 (2.0s) - E-limb (ph3) - |
Ap 20170726 (2.0s) - N-limb (ph3) - |
Ap 20170727 (2.0s) - W-limb (ph3) - |
Ap 20170728 (2.0s) - S-limb (ph3) - |
|
|
|
|
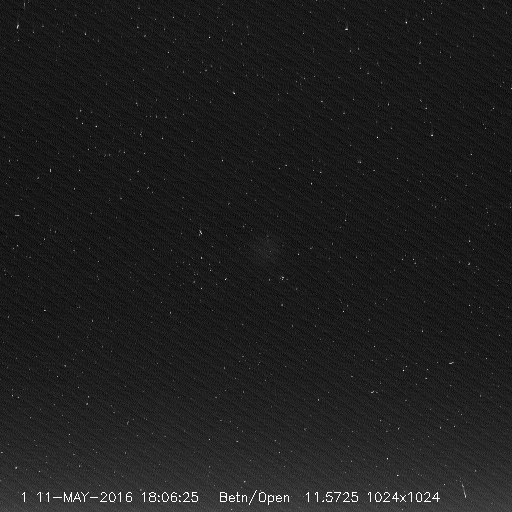
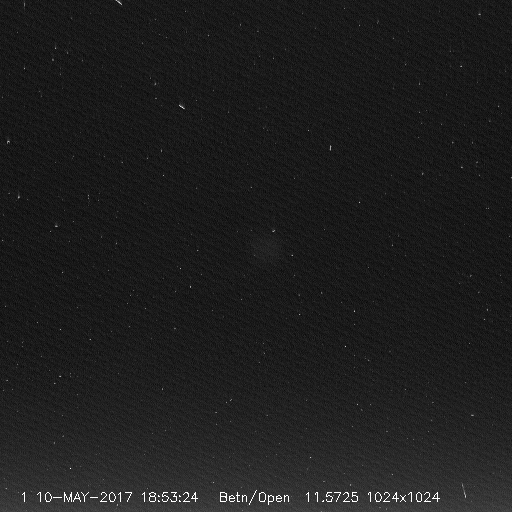
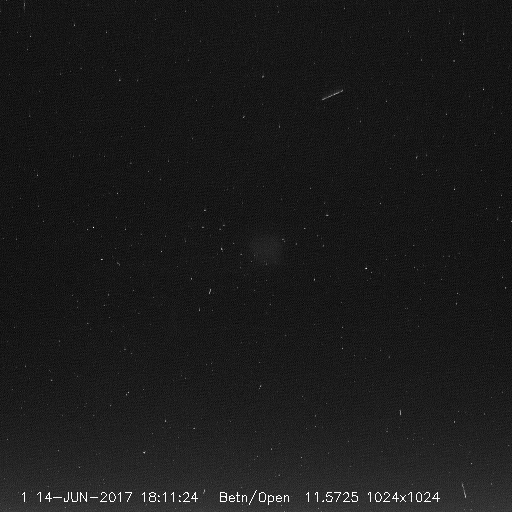
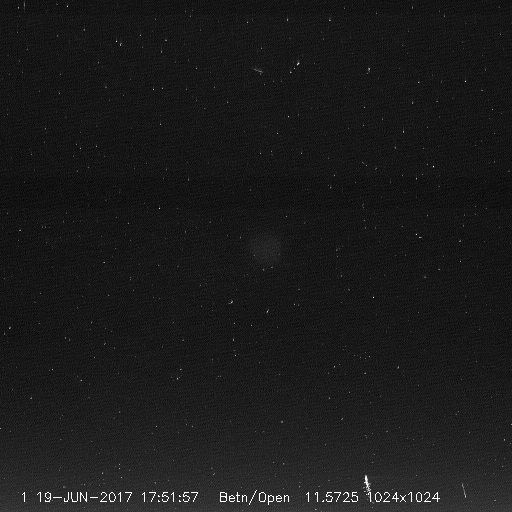
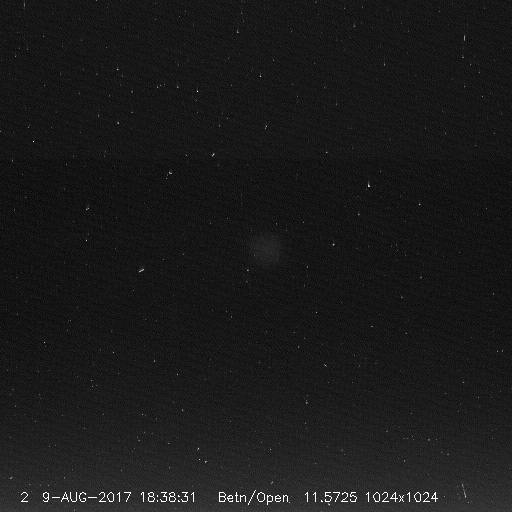
| tnBe 20160511 (5.8s) - phase 2 - |
tnBe 20170510 (11s) - phase 2 - |
tnBe 20170614 (11s) - phase 3 - |
tnBe 20170619 (11s) - phase 3 - |
tnBe 20170809 (11s) - phase 3 - |
|
|
|
|
|
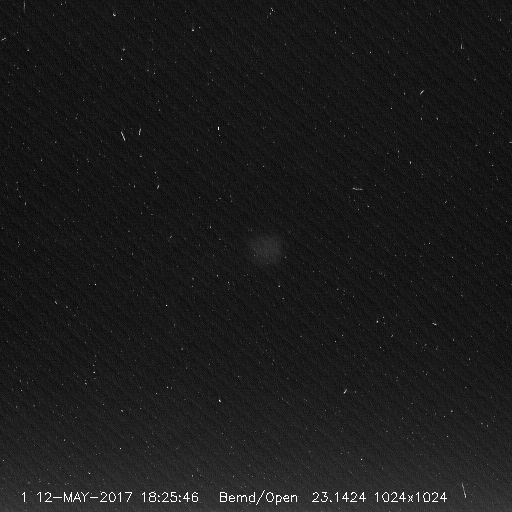
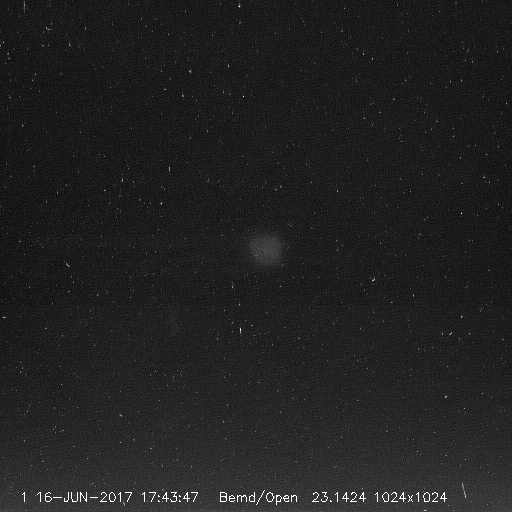
| med-Be,20170512(32s) - phase 2 - |
med-Be,20170616(23s) - phase 3 - |
|
|
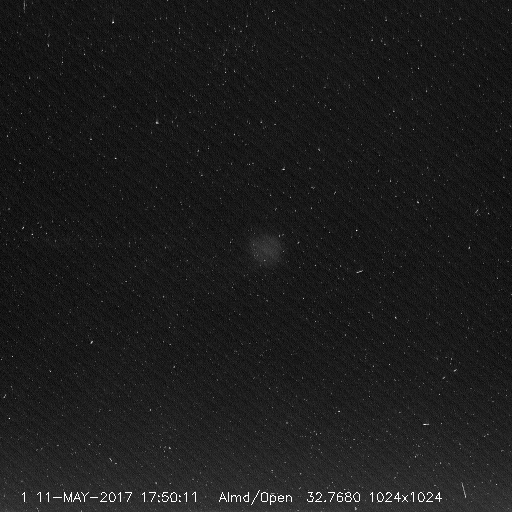
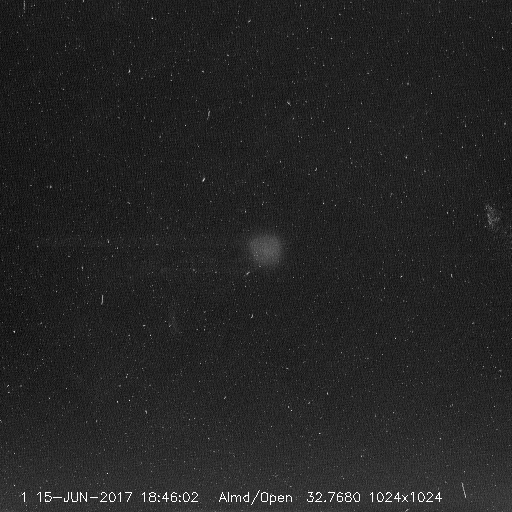
| med-Al,20170511(32s) - phase 2 - |
med-Al,20170615(32s) - phase 3 - |
|
|
| Before subtracting stray light img. | After subtracting stray light img. | Intensity profile, image(*,512) |
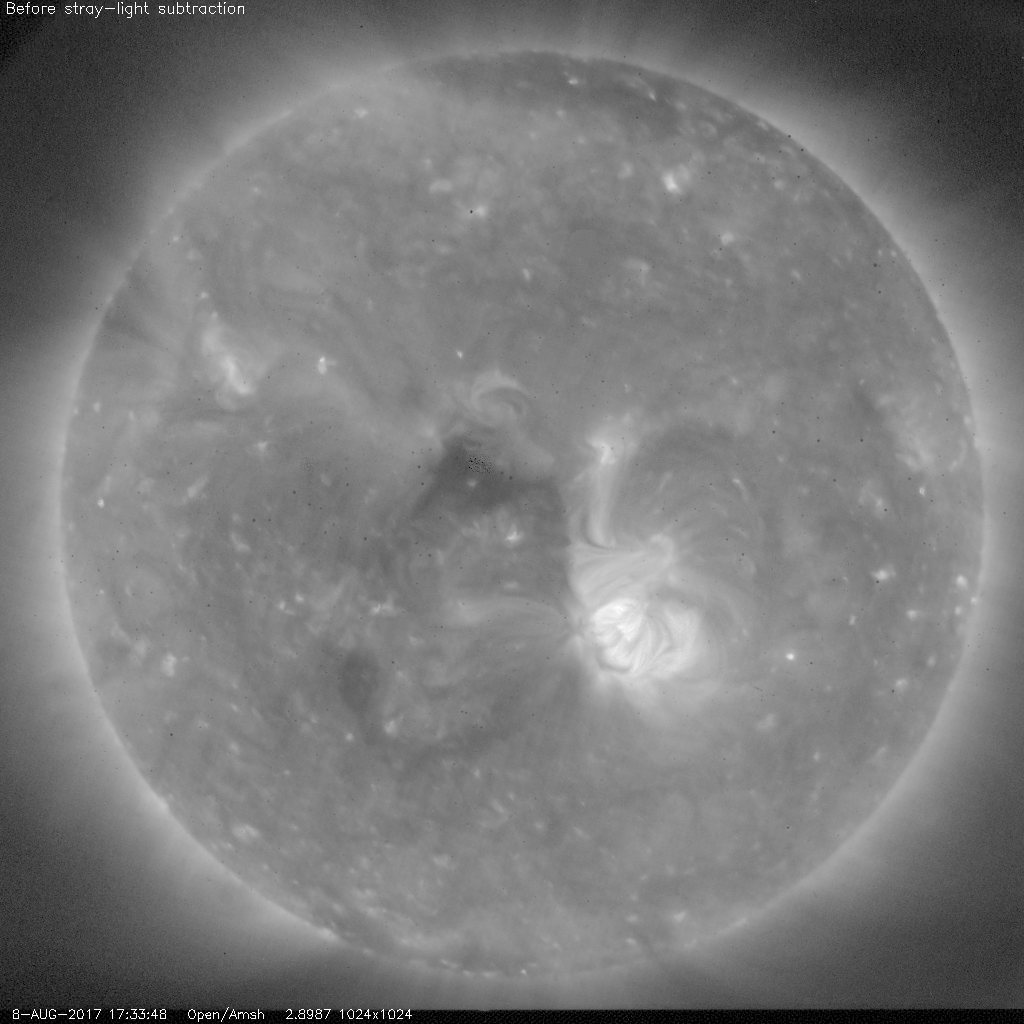
|

|

|
| Before subtracting stray light img. | After subtracting stray light img. | Intensity profile, image(*,512) |
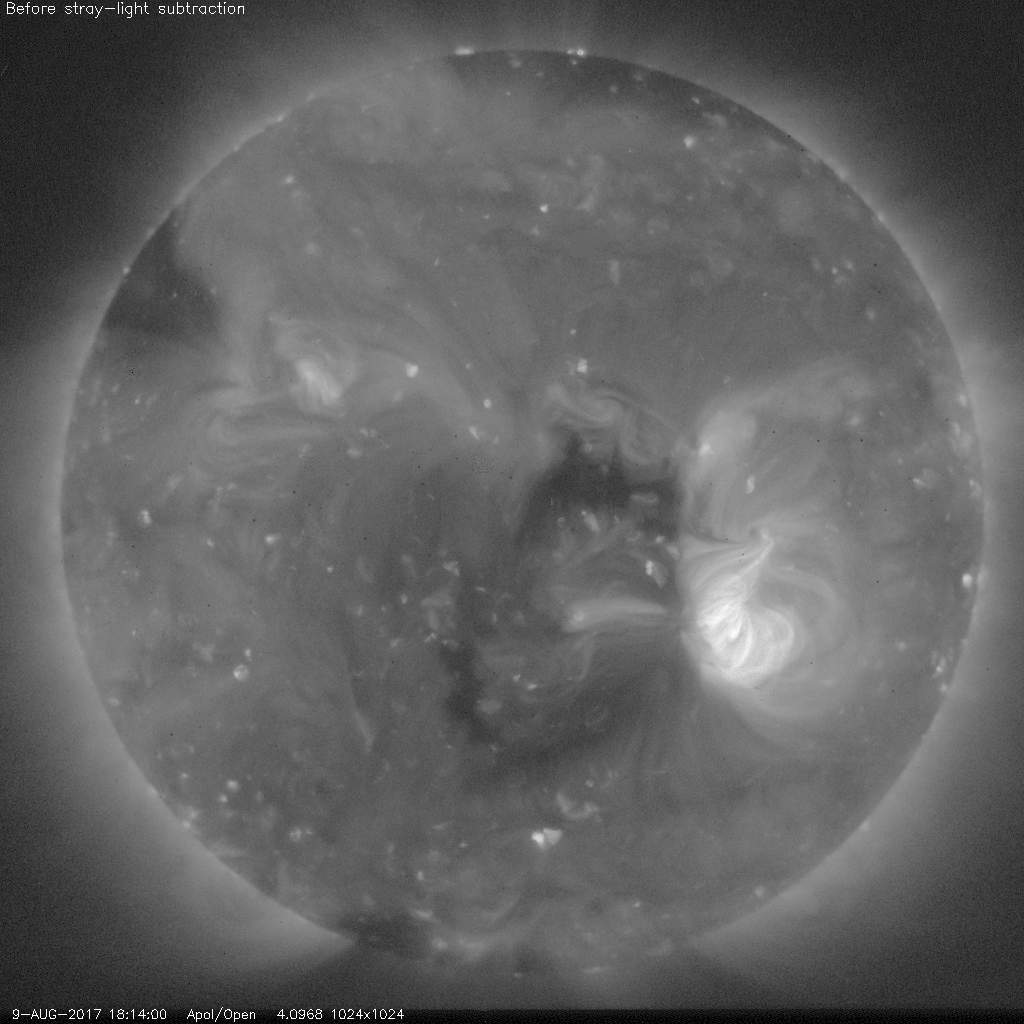
|
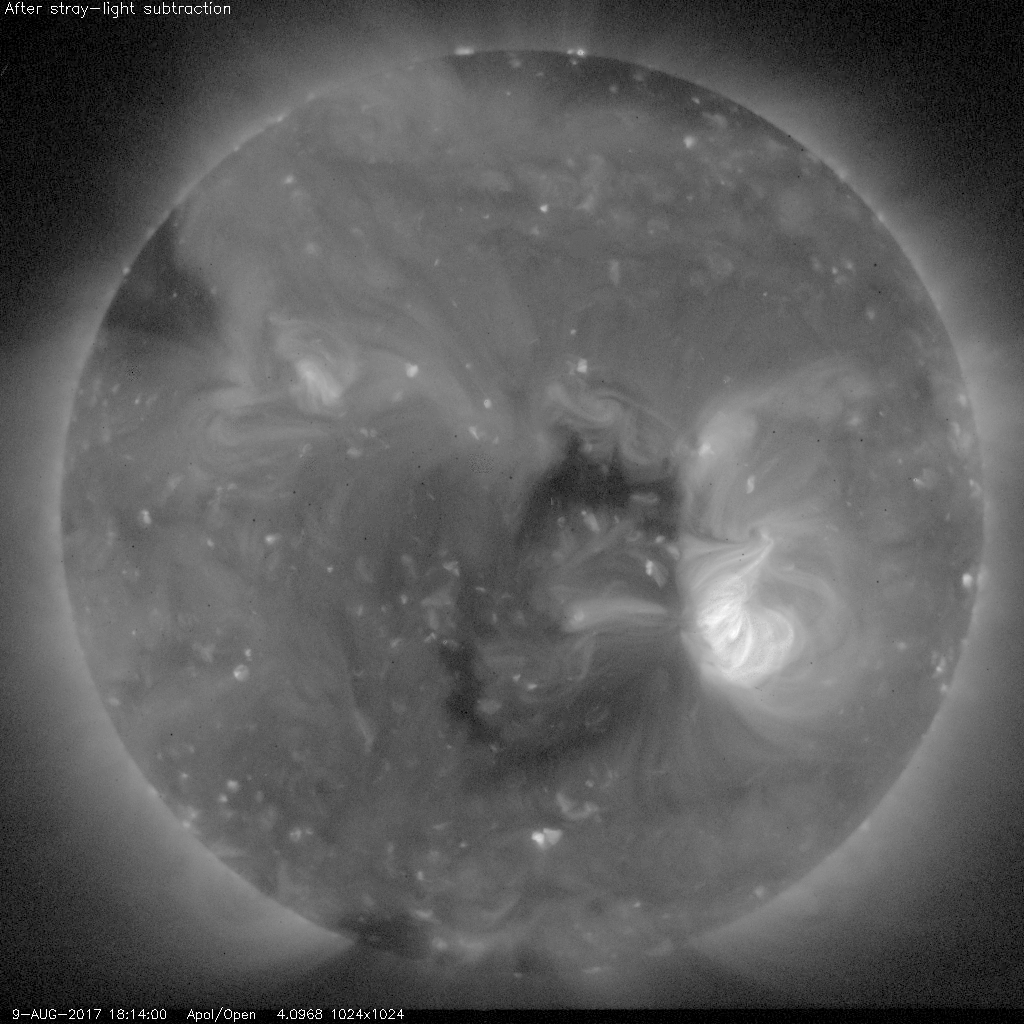
|
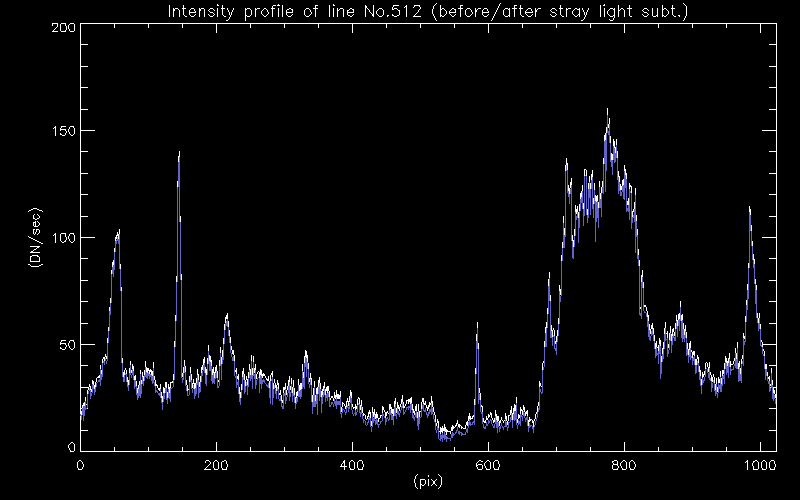
|
I_corrected = I_uncorrected - I_straylight * kThe time variation of the factor k was determined by using the intensity correlation between Ti_poly and Al_mesh images taken closely in time so that the correlation after subtracting stray light component becomes closest to the correlation of these two filters before we have the stray light problem. The factor k was well determined with this method, and it turned out that the resulting k values predominantly reflect the variation of CCD contamination thickness obtained from G-band images.
[Attempt 1]
So, we first tried the same method as the Ti_poly image correction
during the phase 1.
This time, we use Al_mesh and Al_poly intensities, and compare their
correlation in phase 3 with that in phase 1 (during which the stray
light component of Al_mesh or Al_poly filters were both negligible).
However, this method didn't work: We could not determine the value
of k in a descent value range (0.5 to 2.0) by comparison with the
phase 1. We also tried to find the k that maximize the correlation
coefficient after the stray light correction, but without success.
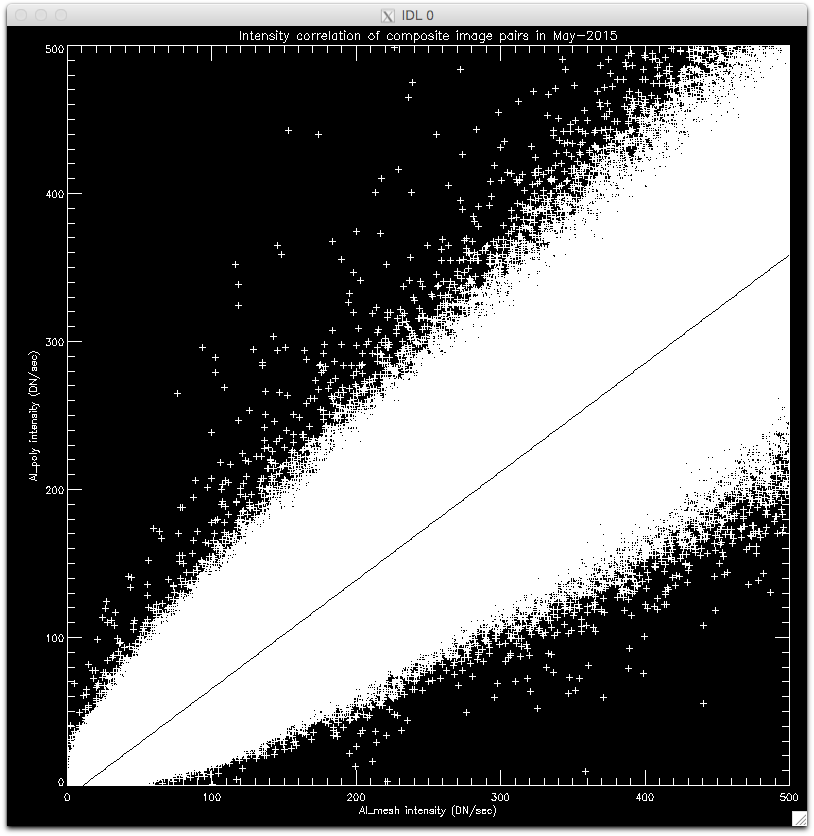
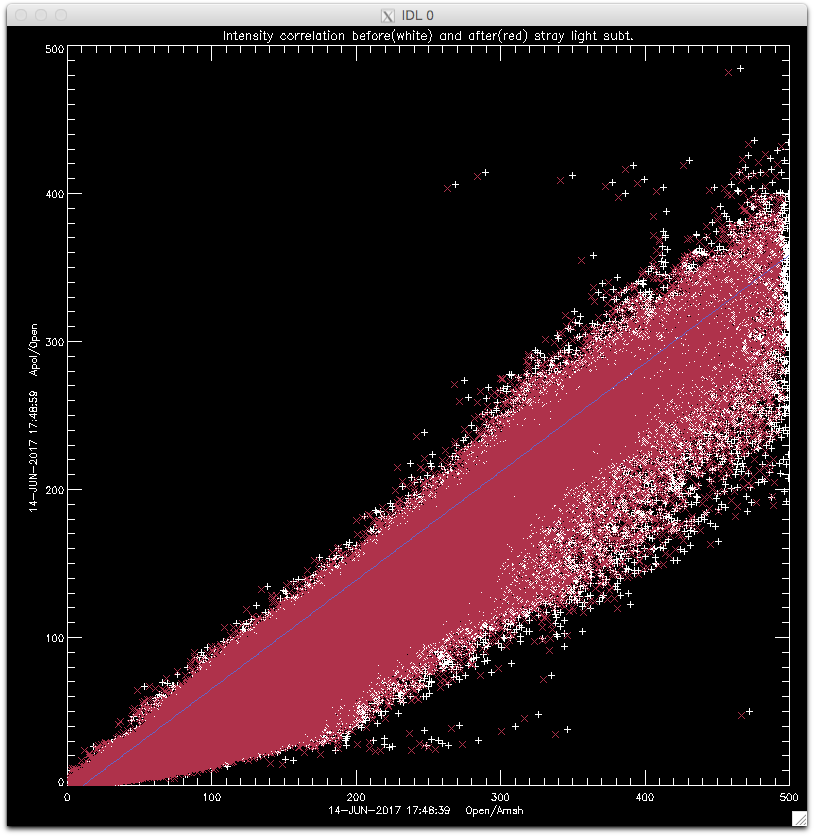
The failure of this method is due to the fact that the stray light
subtraction does not make substantial change in distributions
of data points of cross-correlation (Fig. 6.2):
|
Fig.6.1 : Al_mesh vs Al_poly intensity correlation in May 2015 (phase 1). |
Fig.6.2 : Al_mesh vs Al_poly intensity correlation on 14-Jun-2017 (phase 3). |
|
|
[Attempt 2]
As the next step, we tried to use the G-band stray light (VLS=close)
variation to estimate the variations of Al_mesh and Al_poly stray
light, by assuming their behavior being the same as G-band's.
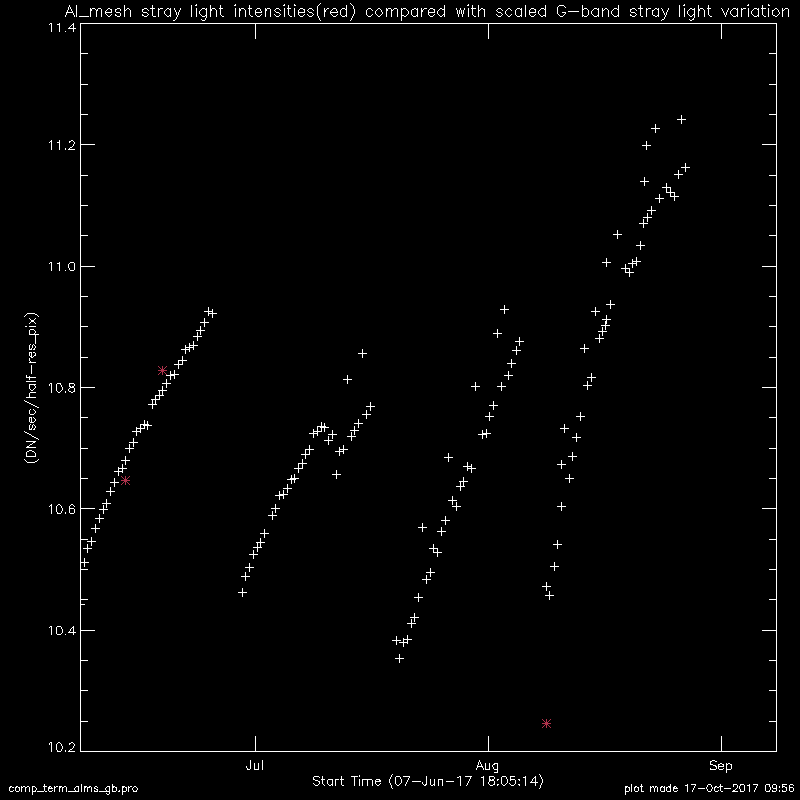
The G-band stray light intensities are measured regularly in the course of creating CCD contamination layer thickness DB by K. Yoshimura. To compare with these data, the stray light intensities of Al_mesh and Al_poly were measured for the same location as G-band's (i.e., 256x256 area around disk center for half-res images), then compare with the G-band stray light variation scaled to match the level of stray light intensities observed with Al_mesh and Al_poly filters.
However, it turned out the behavior of Al_mesh and Al_poly stray light is different from G-band's (Fig. 6.3 and 6.4). This suggests that there is other factor (than CCD contamination) that affects Al_mesh and Al_poly stray light intensity. One candidate of such factor is the difference in pointing. All the stray light image used for these plots were taken at the disk center for Hinode satellite, but there is an offset between Hinode's and XRT's pointing which varies with season. The time variation of the offset is generally large in eclipse seasons, according to K. Yoshimura who prepares the XRT co-alignment DB. While the stray light level is lower, the effect of other factors becomes larger.
So, it is therefore not appropriate to use the G-band stray light
variation to simulate the time variation of Al_mesh and Al_poly
stray light intensities.
[click image to enlarge]
| Fig.6.3 : Al_mesh and G-band stray light variation. | Fig.6.4 : Al_poly and G-band stray light variation. |
|

|
[Conclusion and my suggestion]
Our two attempts to determine the correction factor (the k-factor,
or fudge factor) both failed. We should not provide the correction
factor for the Al_mesh and Al_poly stray light correction.
Rather, we should simply use a stray light image taken at
the closest XRT pointing to data, then allow about 10% error
for this correction.
Comparison with the Phase 2 (Jan-2016).