1. Stray light measurements in 2020.
This is a digest version of the following page:http://solar.physics.montana.edu/takeda/xrt_sl2020/xrt20_sl.html
1.1 Measurements 2020 at a glance.
| ID No. | date & time (UT) | XOB | purposes (link: obtained plots & images) | memo |
| 1 | 7-May-2020, 18:37:30 | 1C81 | light crv., Al-mesh (1.4s) and Al-poly (2.0s) at DC. | previous bakeout + 14 day. |
| 2 | 8-May-2020, 18:54:30 | 1C82 | light crv., thin_Be (11.3s) at DC. | prev. b.o. + 15 day. |
| 3 | 13-May-2020, 18:22:00 | 1C83 | light crv., Al-mesh (1.4s) and Al-poly (2.0s) at DC. | prev. b.o. + 0 day. Many lost frames. |
| 4 | 14-May-2020, 19:08:00 | 1C84 | light crv., thin_Be (11.3s) at DC. | prev. b.o. + 1 day. |
| 5 | 12-Jul-2020, 01:16:30 | 1C88 | light crv., Al-mesh (1.4s) and Al-poly (2.0s) on AR. | prev. b.o. + 21 days. |
- Minimum measurements due to "COVID-19 emergency focus mode".
- only 5 runs.
- 3 main synoptic filters (Al_mesh, Al_poly & thin_Be).
- Disk Center pointings
- Comparison of CCD bakeout before/after
1.2 Summary of Results.
- No new pre-filter failure confirmed.
- [Al_mesh]
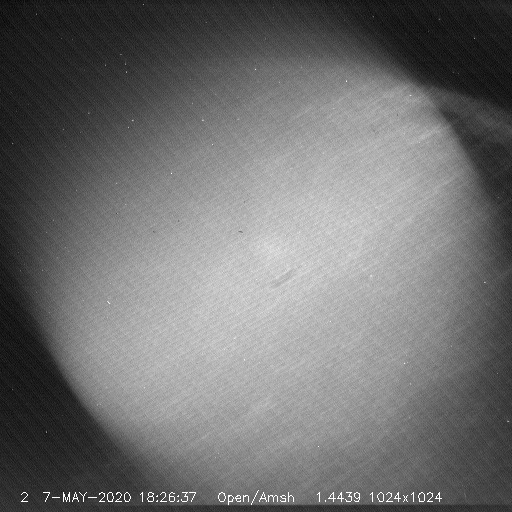
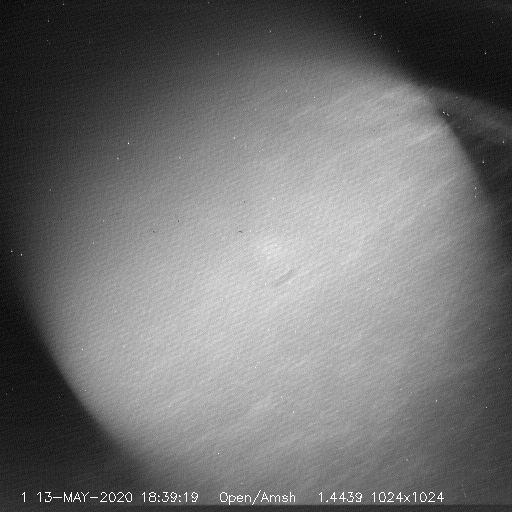
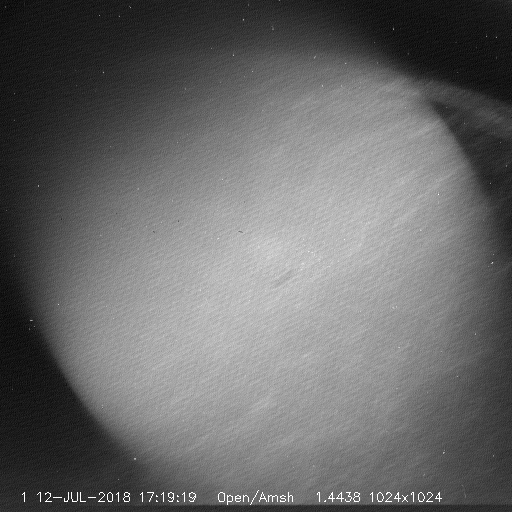
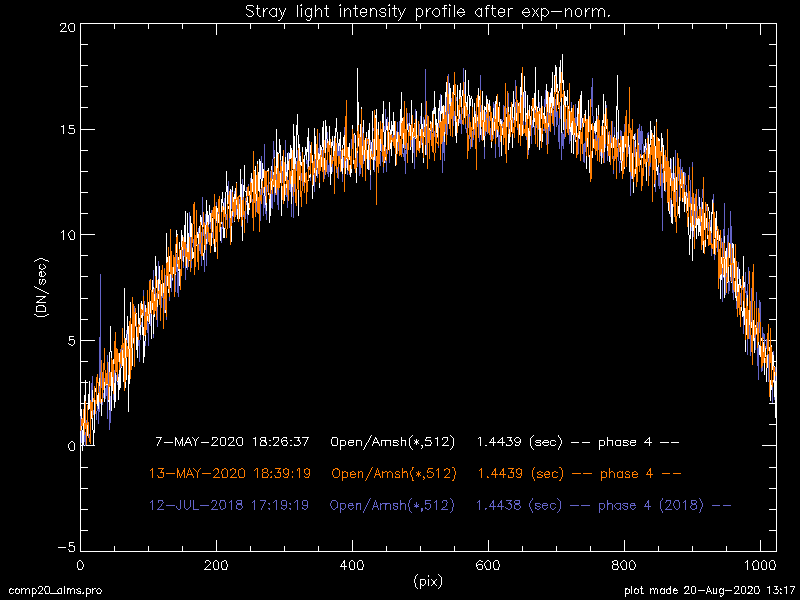
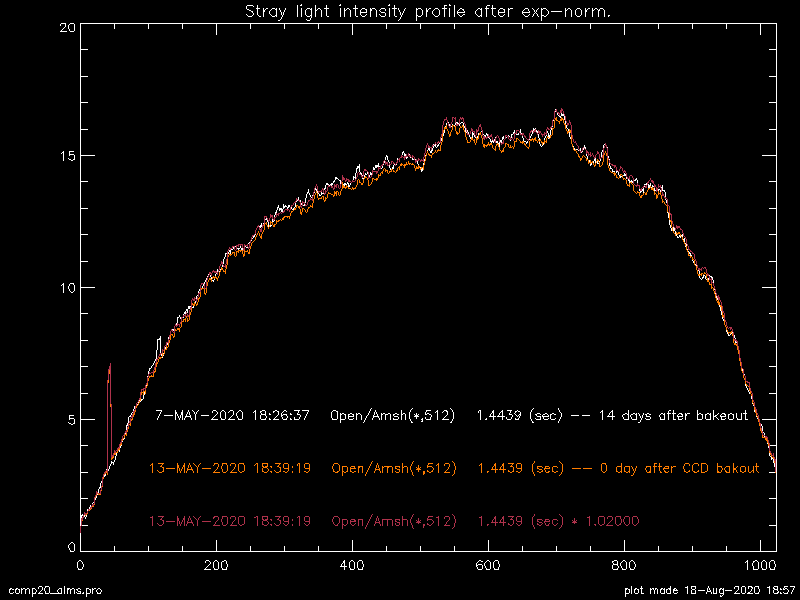
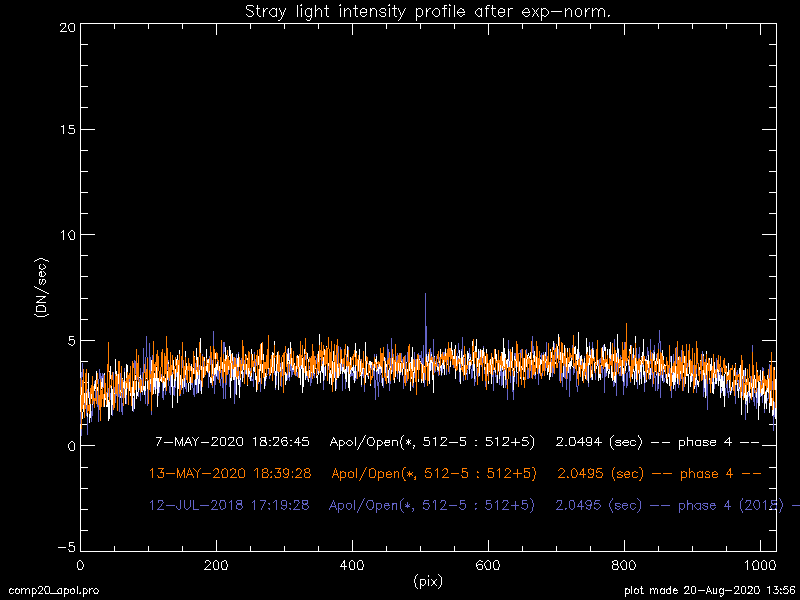
- No change in the stray light component (pattern & intensity level) since the beginning of the phase 4 (Aug-2018).
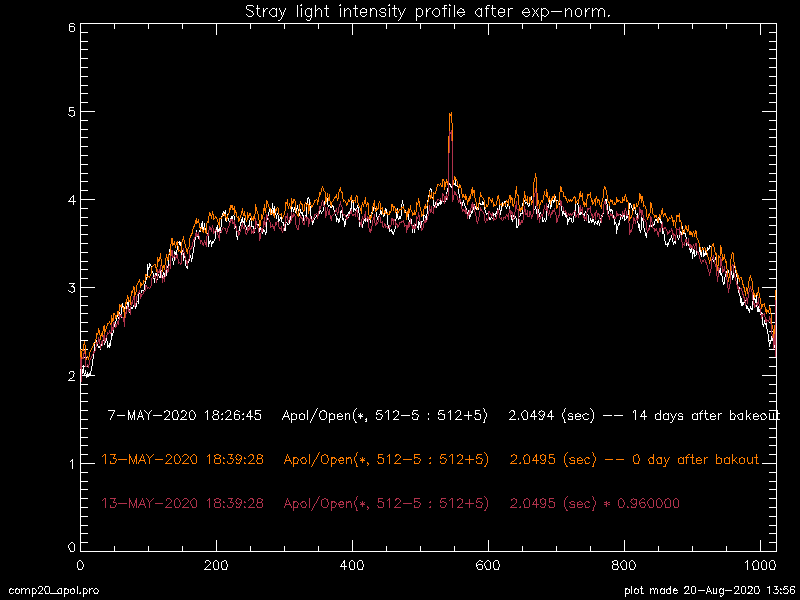
- ~2% increase before/after CCD bakeout (due to growing layer of contamination layer in 14 days).
- [Al_poly]
- No change in the stray light component, either.
- West-pointing anomaly (significant increase of visible light component noticed near West-limb pointing) reproduced.
- Puzzling behavior of stray light intensity before/after CCD bakeout: the before is ~4% smaller than the after.
- [thin_Be] Stray light component is still in a negligible level.
1.3 Sample images
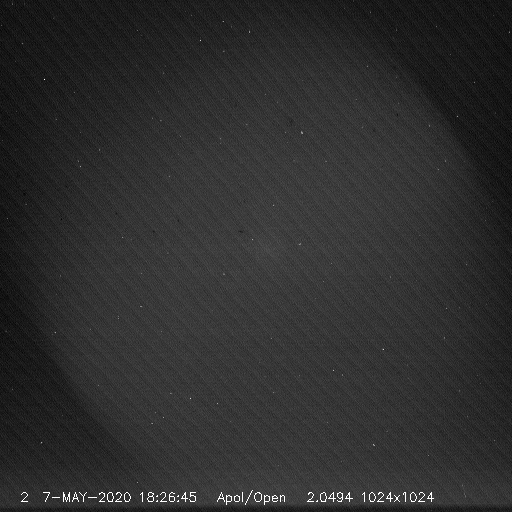
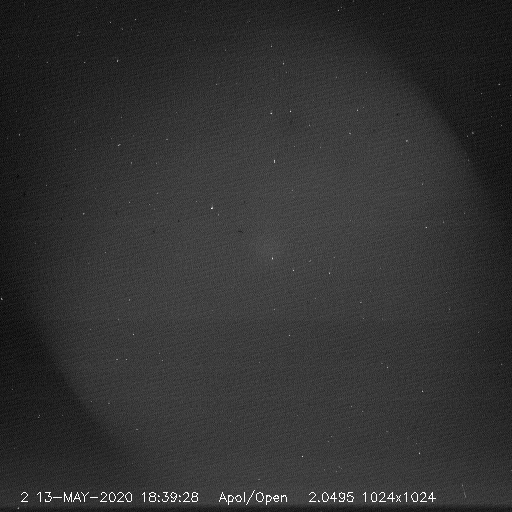
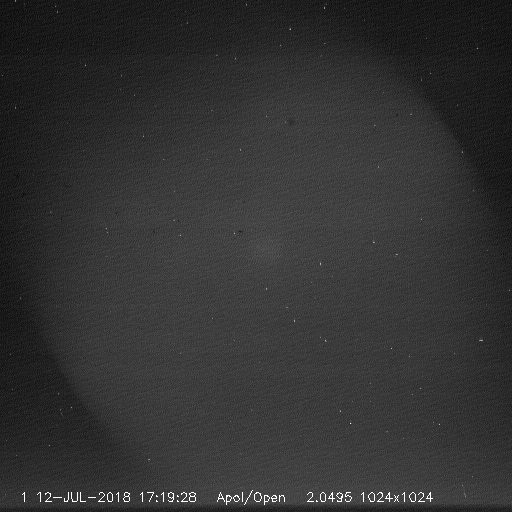
- Al_mesh filter
- Al_poly filter
- Other pointings
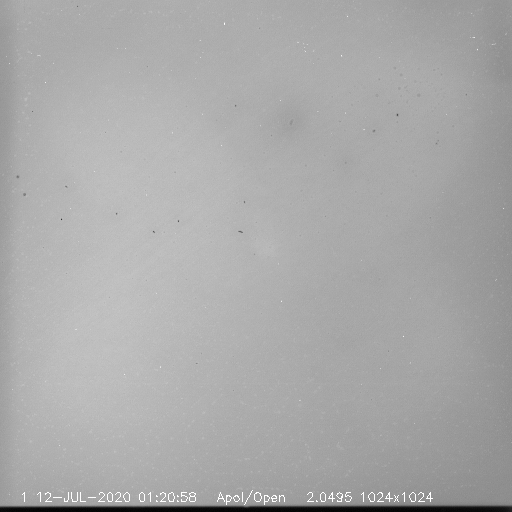
| Al-poly, 20200712(2.0s) [bd+21d] pnt.(881.0, 73.5) |
|
1.4 Additional analysis of G-band monitor (VLS=Open/Close) images.
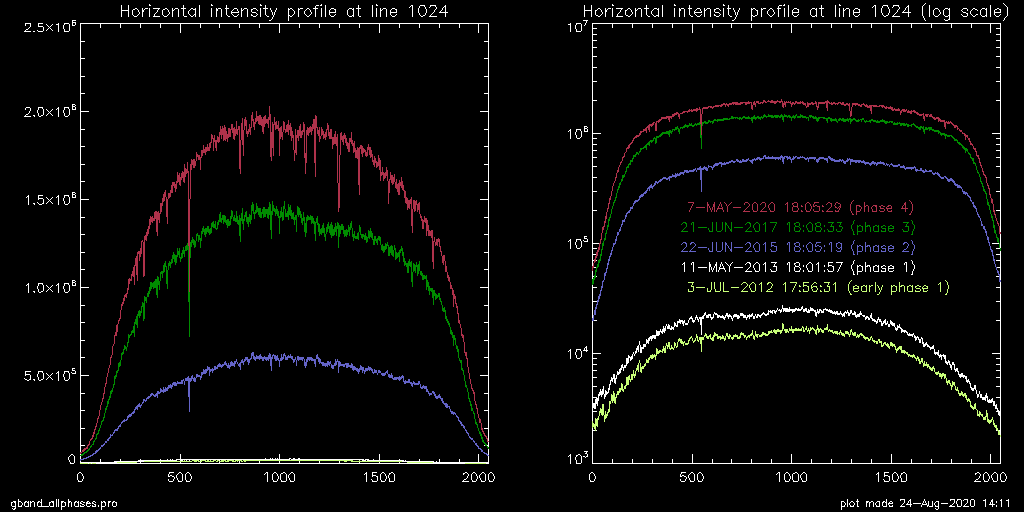
"Attempt to determine the pre-filter opening ratio."Intensity profiles of G-band VLS=close full-Sun images for the phase 1 to 4. Intensity is normalized to (DN/sec/full-res pix).
|
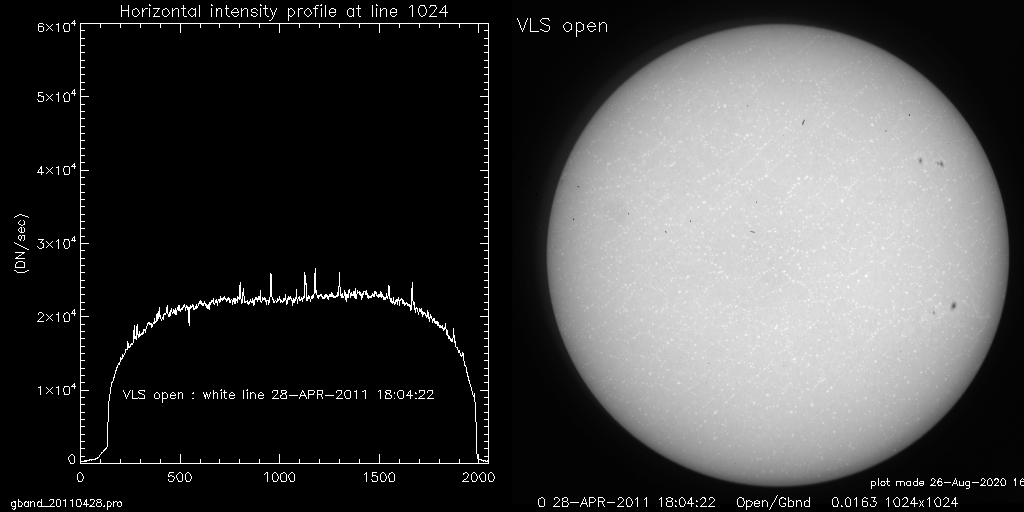
- VLS=open : G-band Sun (via G-band optics) + stray light (via X-ray system)
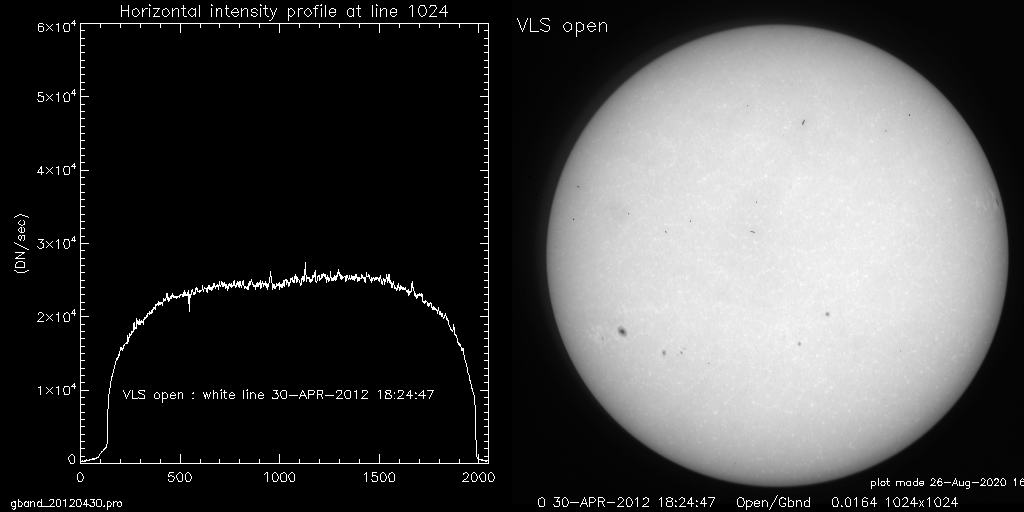
- VLS=close : only stray light (via X-ray system)
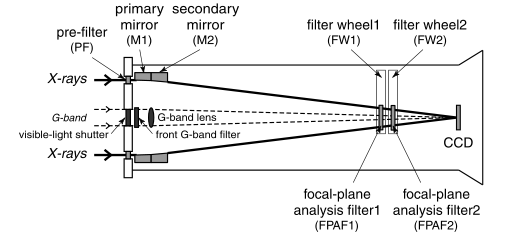
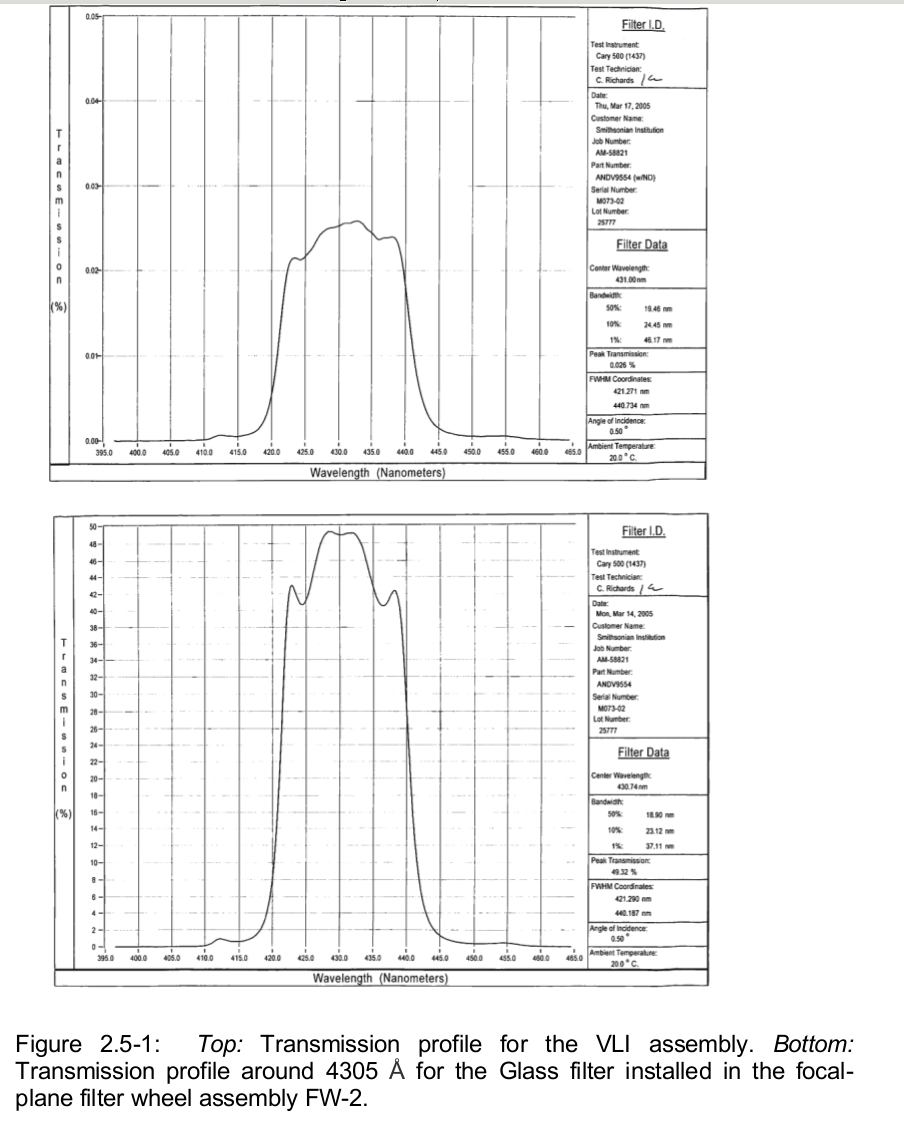
| XRT elements | Pre-filters | G-band lens & filters |
|

|
|
[Observed intensity of the G-band Sun] =
I_sun * [aperture of G-band system] * [G-band system's transmission] * [transmission of FW G-band filter]
[Observed stray light intensity] =
I_sun * [aperture of X-ray system] * [pre-filter opening ratio] * [transmission of FW G-band filter]
- Phase 0 (2011/04/18 & 2012/04/30)
|
|
- Phase 1 (2013/05/11)
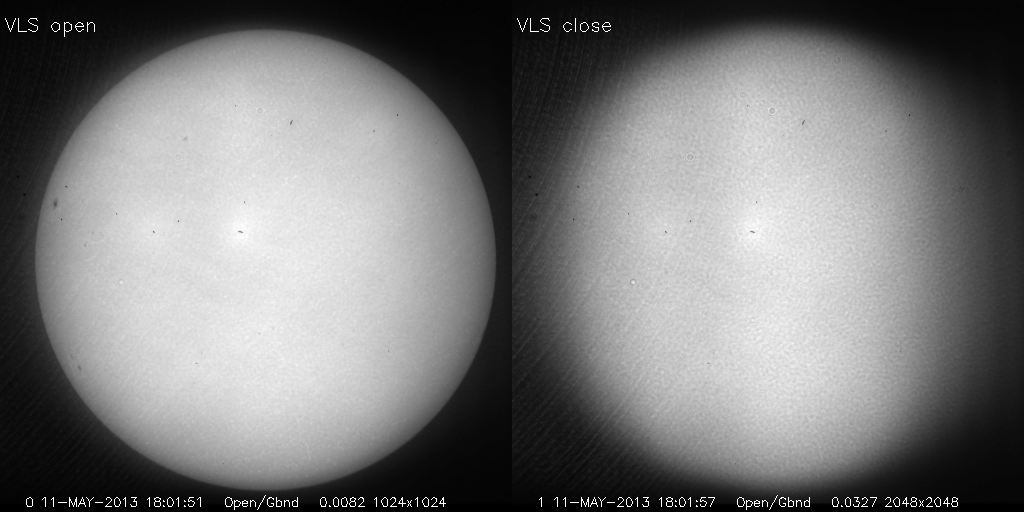
|
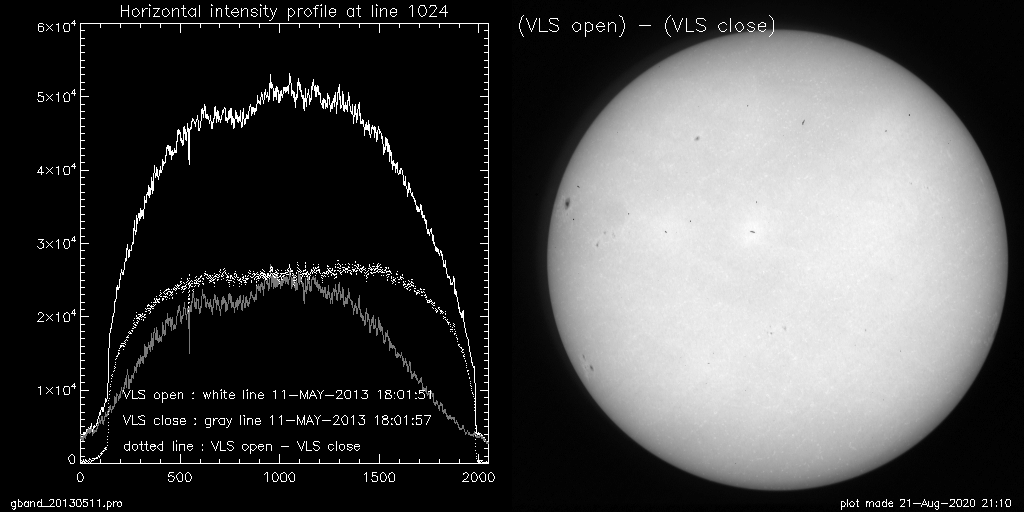
|
- Phase 2 (2015/06/22)
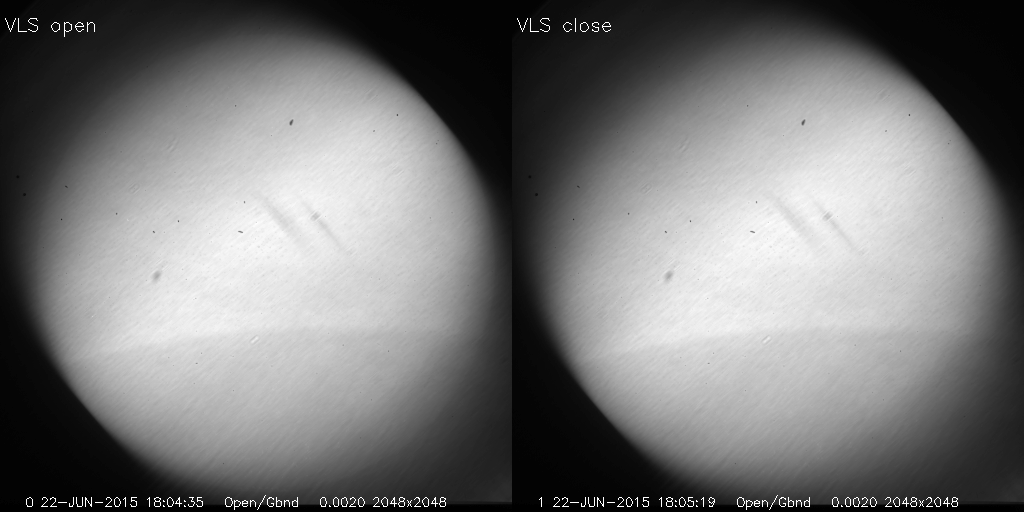
|
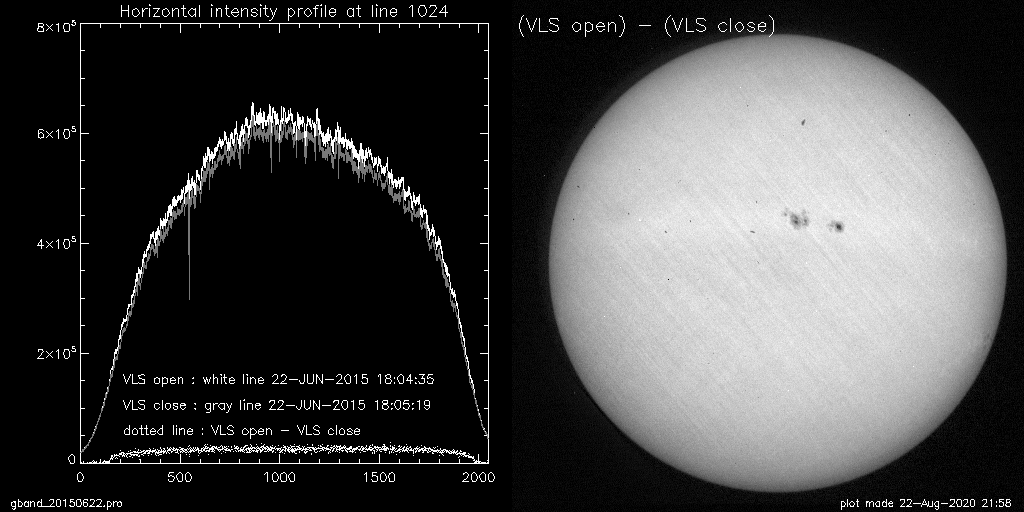
|
Using the ratio of disk-integrated G-band and stray-light images, the pre-filter open ratio for each phase was calculated as follows.
Estimation of pre-filter open ratio
2. Status of XRT full-Sun irradiance study.
This is the science topic I have tackled for these years, but it requires to estimate the effect of the stray light contamination on XRT's effective area function.This study was partly contributed by Suman Panda, through our summer project, Jun-Sep 2020. http://solar.physics.montana.edu/takeda/REUproj2020/index.html
2.1 Derivation of soft X-ray irradiance using XRT full-Sun images
- [step 1] find pairs of images taken within 5 minutes apart.
- 2007.1 - 2015.5 : Al_mesh and Ti_poly
- Ti_poly became unavailable due to stray light contamination (since 14-Jun-2015).
- 2015.3 - present : Al_mesh and Al_poly
- Eliminate pairs with bad images (missing frames, SAA, cosmic rays, saturation, etc.)
- [step 2] collect signals of 1.10 R_sol from image pairs.
- stray light correction applied. Al_mesh and Al_poly).
- Mask outside 1.10 R_sol and get total intensities.
- [step 3] calculate filter ratio temperatures and emission measures.
- apply xrt_teem.pro
- elemental abundances : corona (traditional)
- [step 4] calculate soft X-ray isothermal spectrum with CHIANTI
ver.9.0.1 DB and SW, then convert them to irradiance.
- elemental abundances : corona (traditional)
- wavelength range : 5-60A (XRT), 1-8A (for GOES)
(1) Subtraction of stray light image from each X-ray images.
(2) Modify XRT response functions (through
effective area function
modification) so that they reflect the contamination of the stray light.
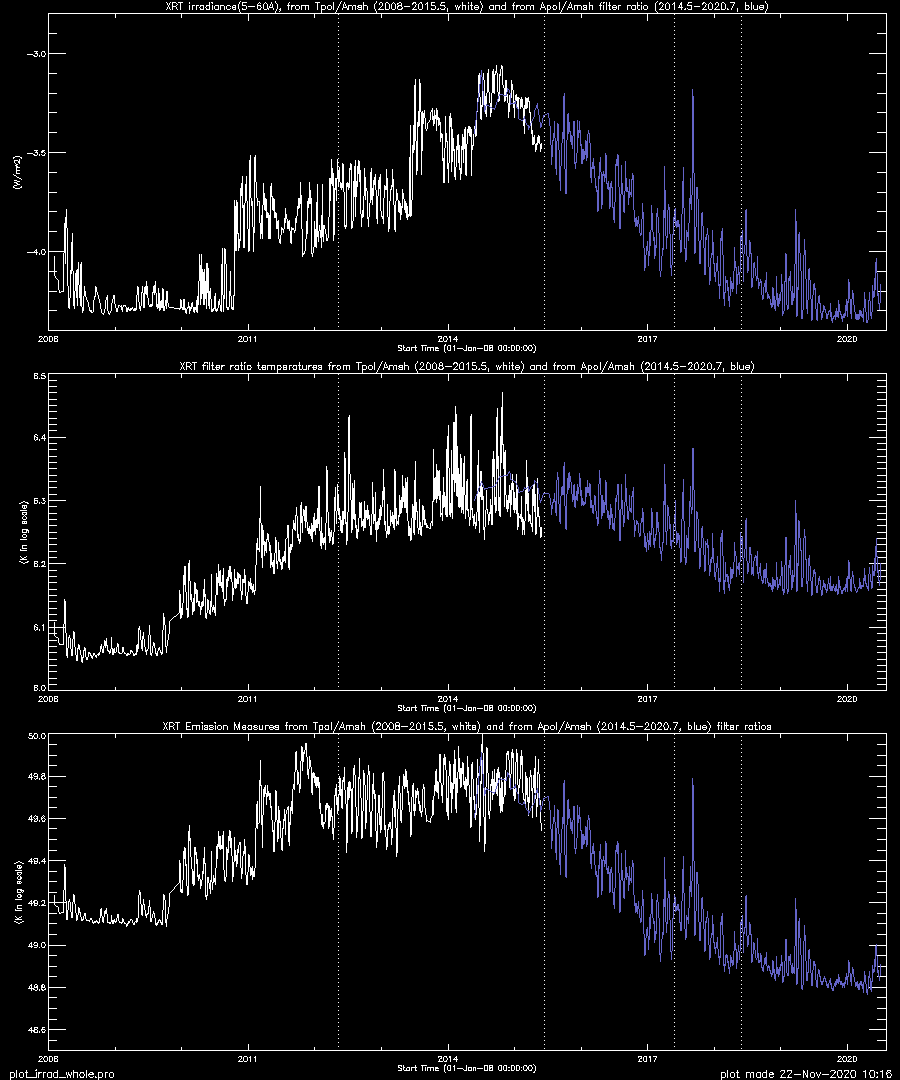
2.2 XRT irradiance (5-60A), filter ratio Te and EM
- Stray light image subtraction done : No correction of effective area functions.

|
We initially tried to determine the pre-filter opening ratio by
comparing the XRT irradiance with other instruments, like GOES/XRS
and TIMED/SEE. Suman contributed to prepare the daily averaged
data set from GOES-15/XRS (1-8A) and TIMED/SEE (1-10A and 1-60A).
However, this method did not work: it turned out that the irradiances
from different instruments are not similar enough to correct the
deviation of XRT irradiance curve from that supposed to be without
pre-filter failure. Later we figured out other method using G-band
images to determine the pre-filter opening ratios.
- Image subtraction done : effective area modification(pre-filter opening ratio below are assumed) done.
- Pre-filter open fraction obtained from G-band data analysis:
- open_fraction at phase 1 (after 9-May-2012 12:00) : 0.001
- open_fraction at phase 2 (after 14-Jun-2015 12:30) : 0.033
- open_fraction at phase 3 (after 27-May-2017 11:00) : 0.075
- open_fraction at phase 4 (after 29-may-2018 00:00) : 0.099
|
Despite our current best effort of correction, the above plots have serious problems, which need to be further corrected.
