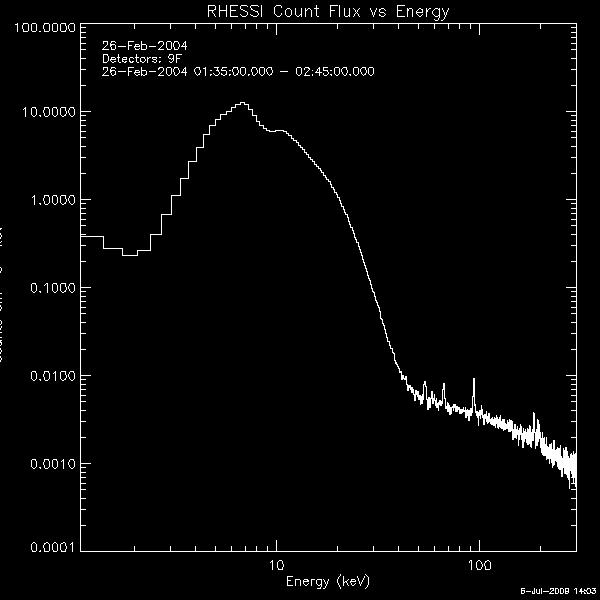
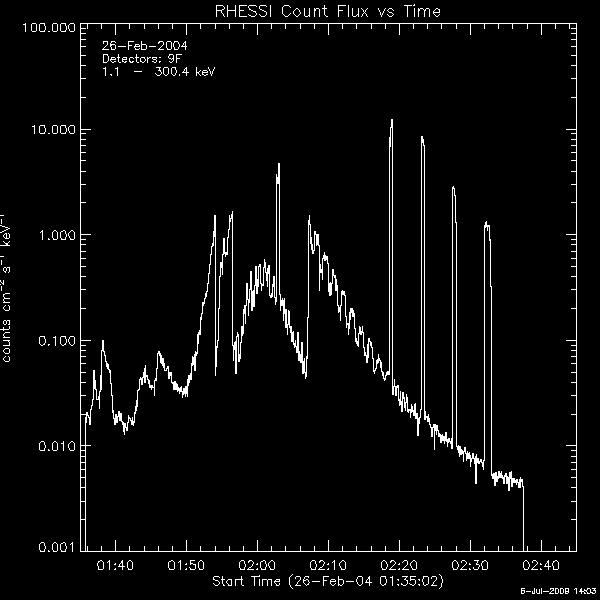
WEEK FIVE
June 29,2009
I was able to move to a different computer to verify that the xwin
programs was the problem with the OSPEX GUI but the problem is in the
OSPEX problem. Now the next step is to contact Kim the writer of the
OSPEX GUI.
I started to
look at Amanda Dillman's, a REU student from 2005,
plotting programs to make graphs of the various components with respect
to time.
June 30, 2009
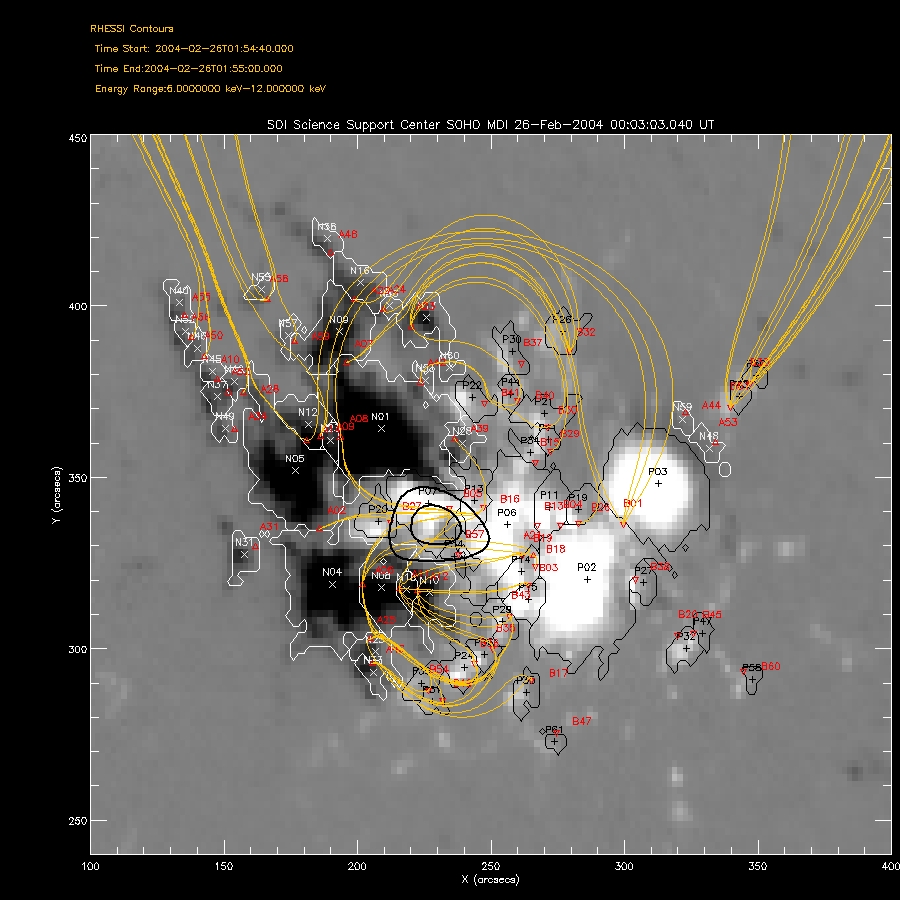
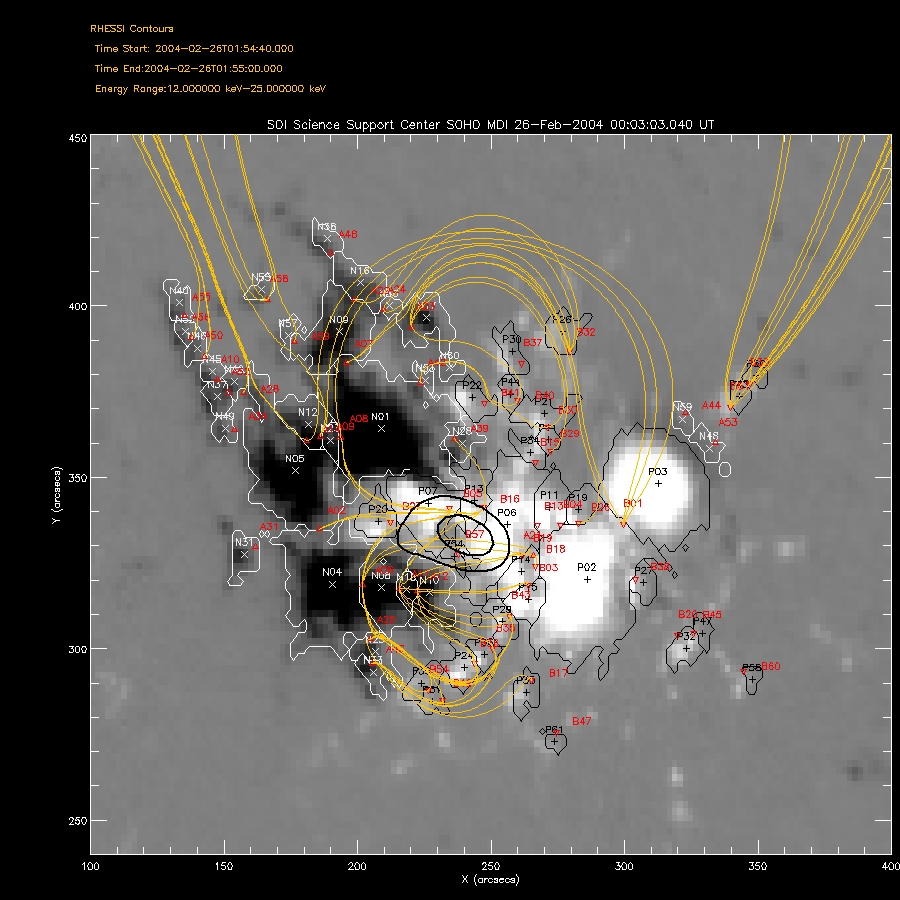
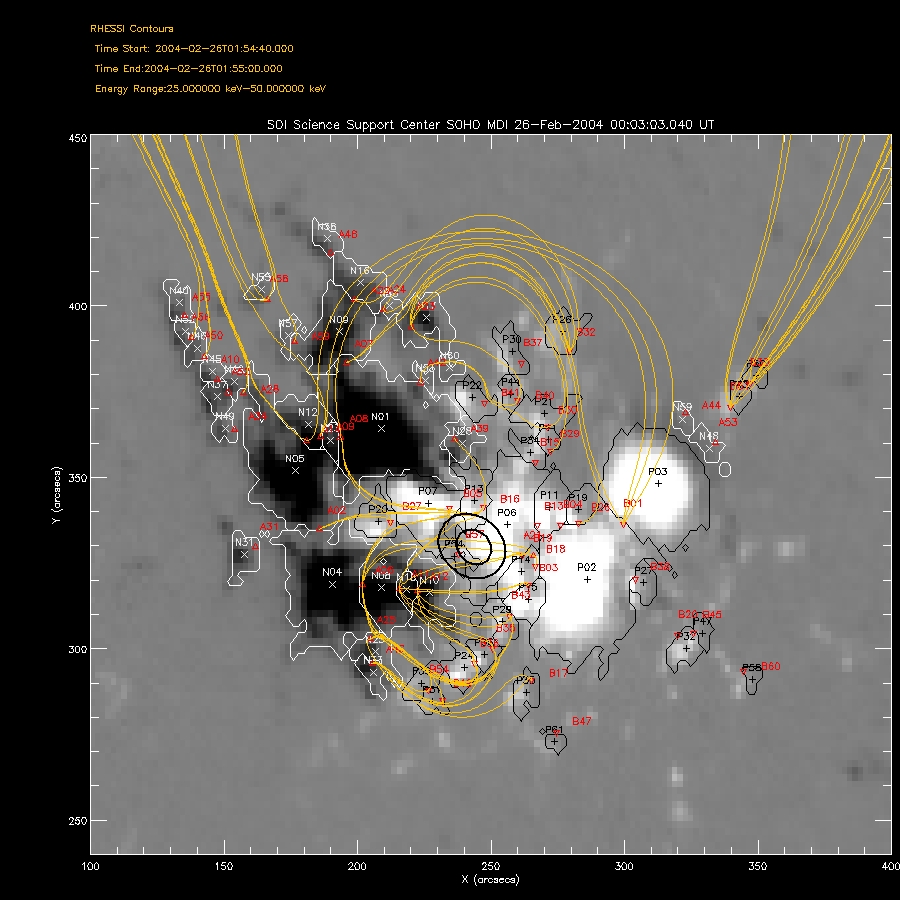
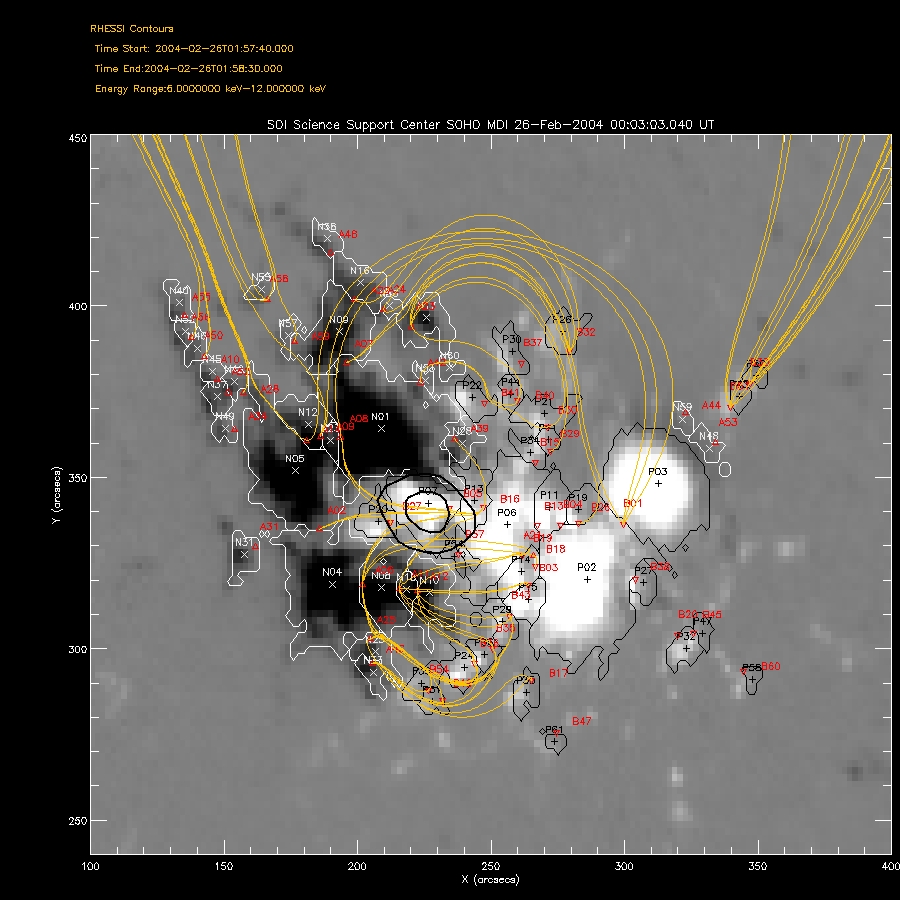
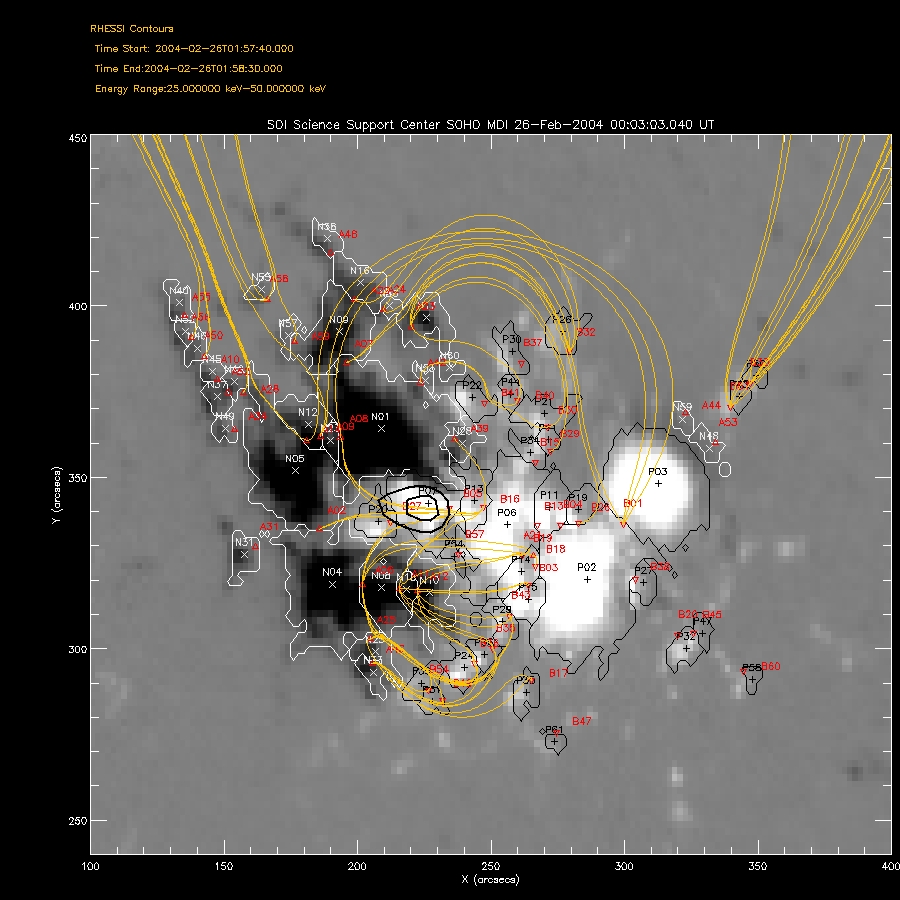
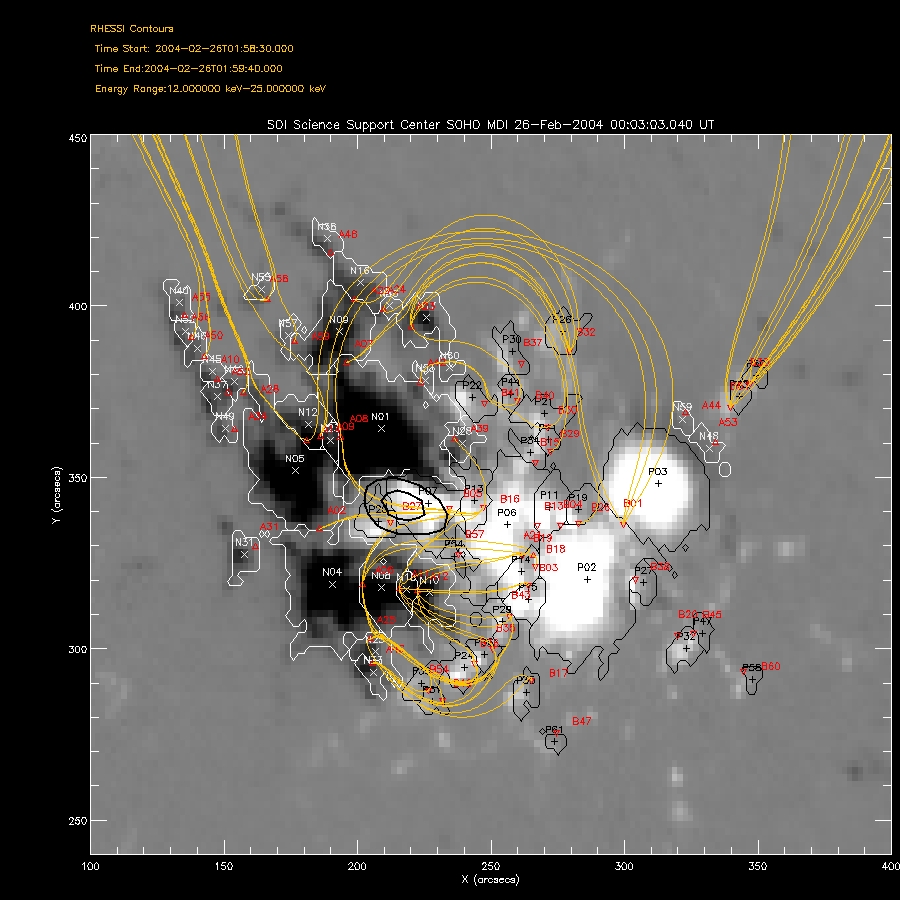
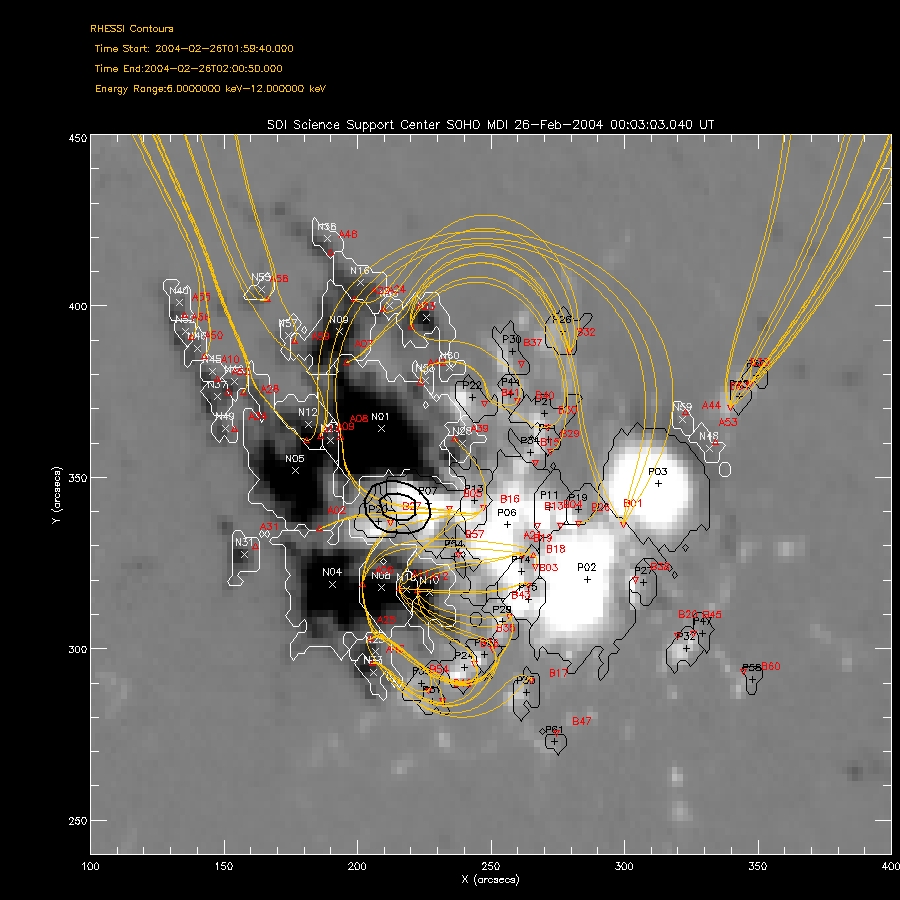
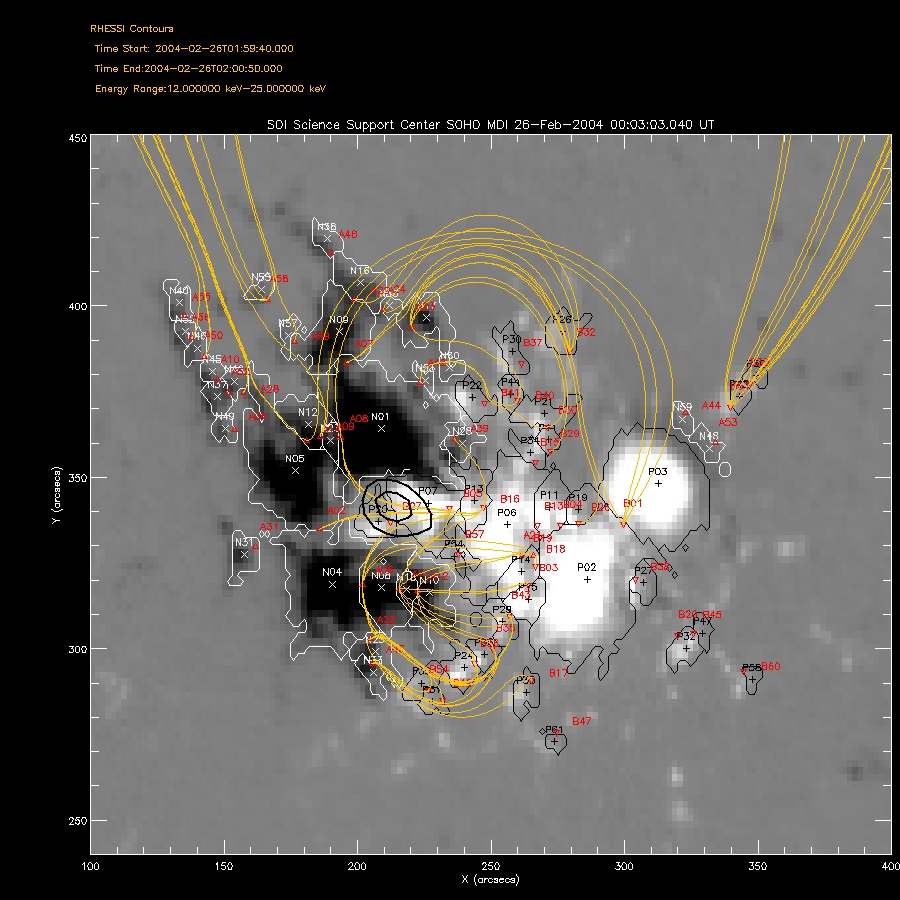
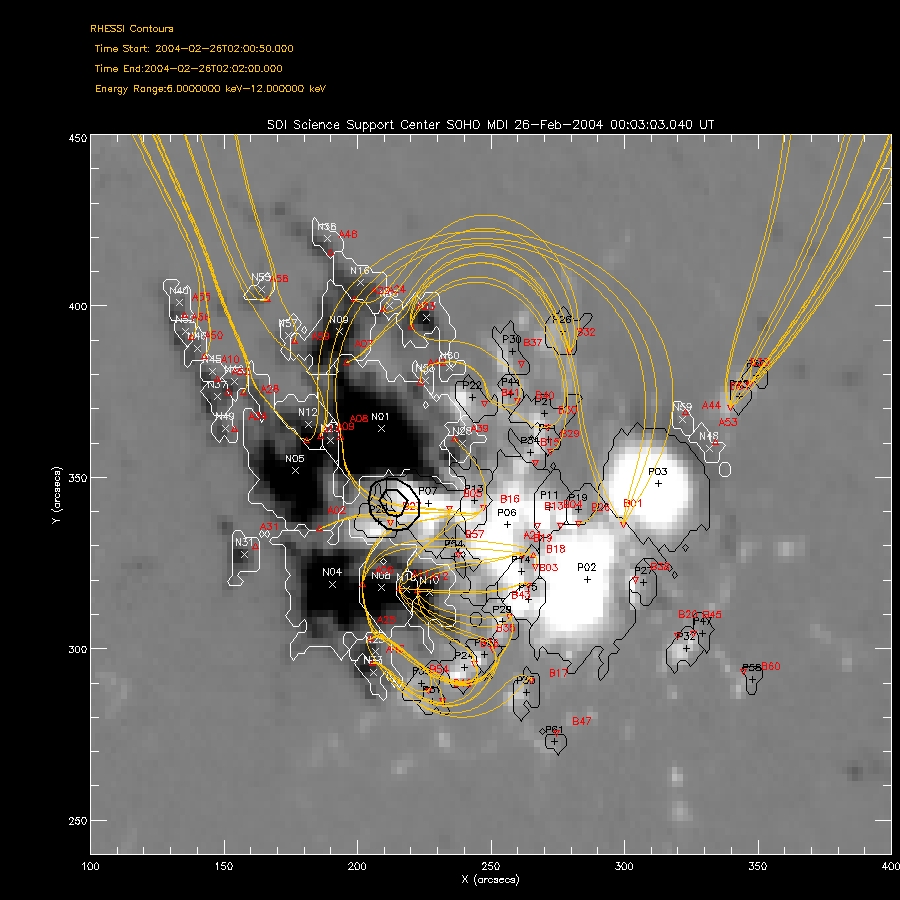
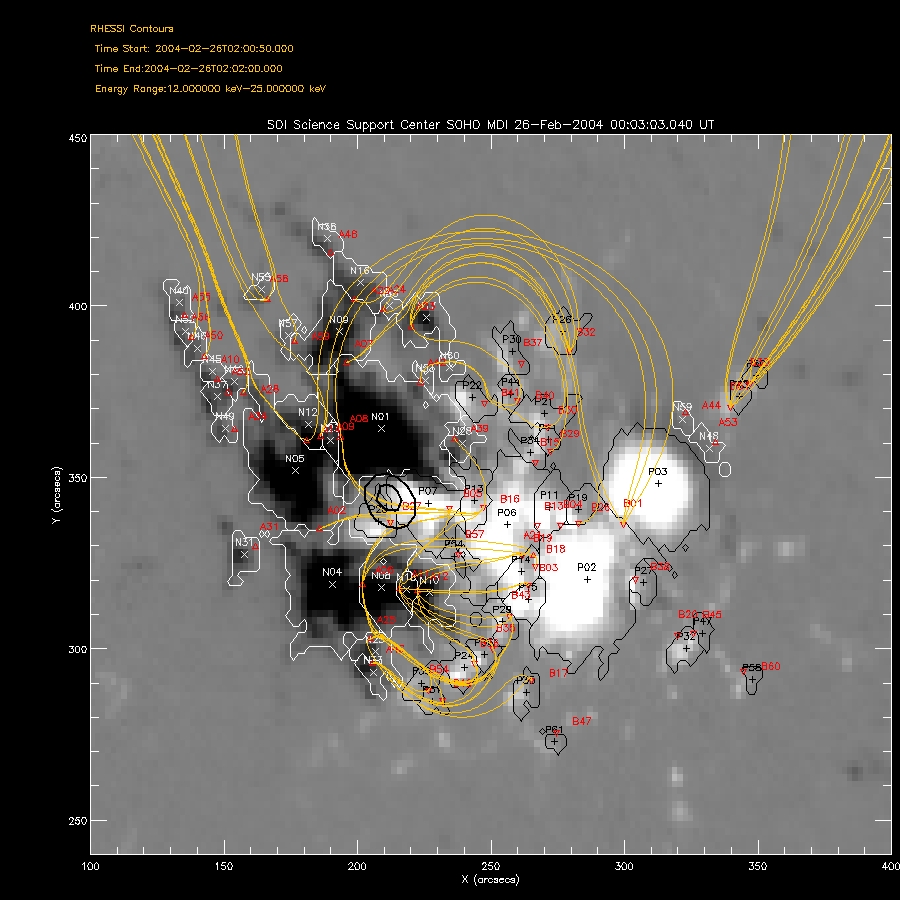
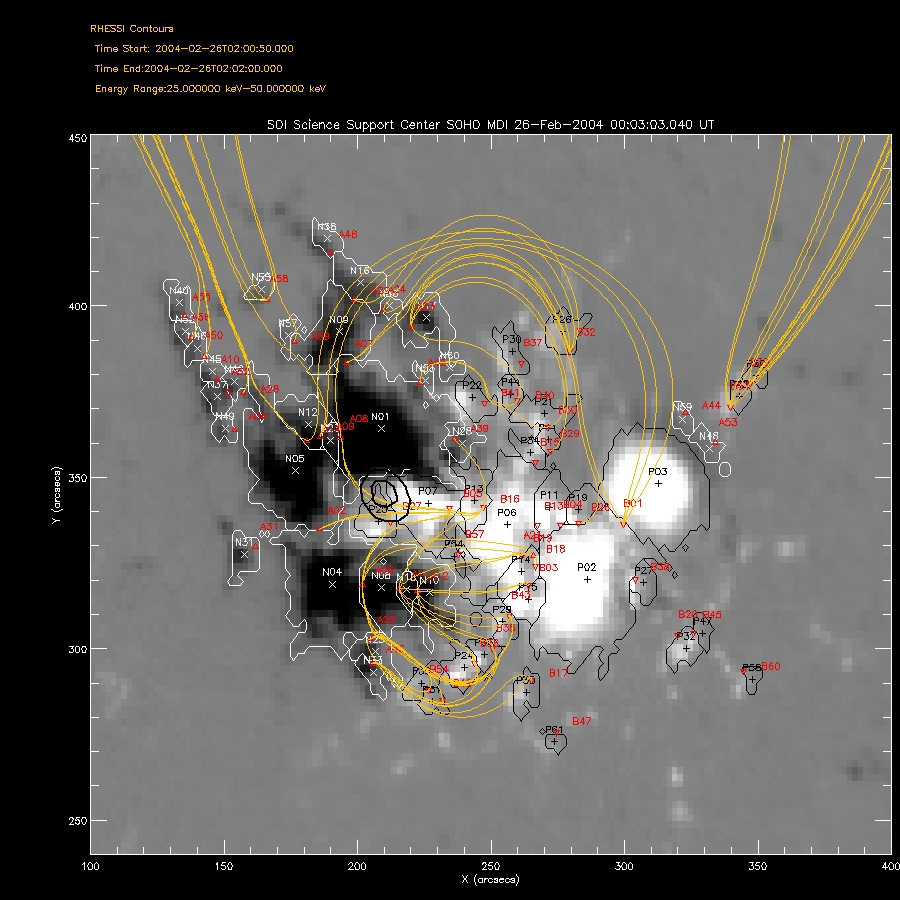
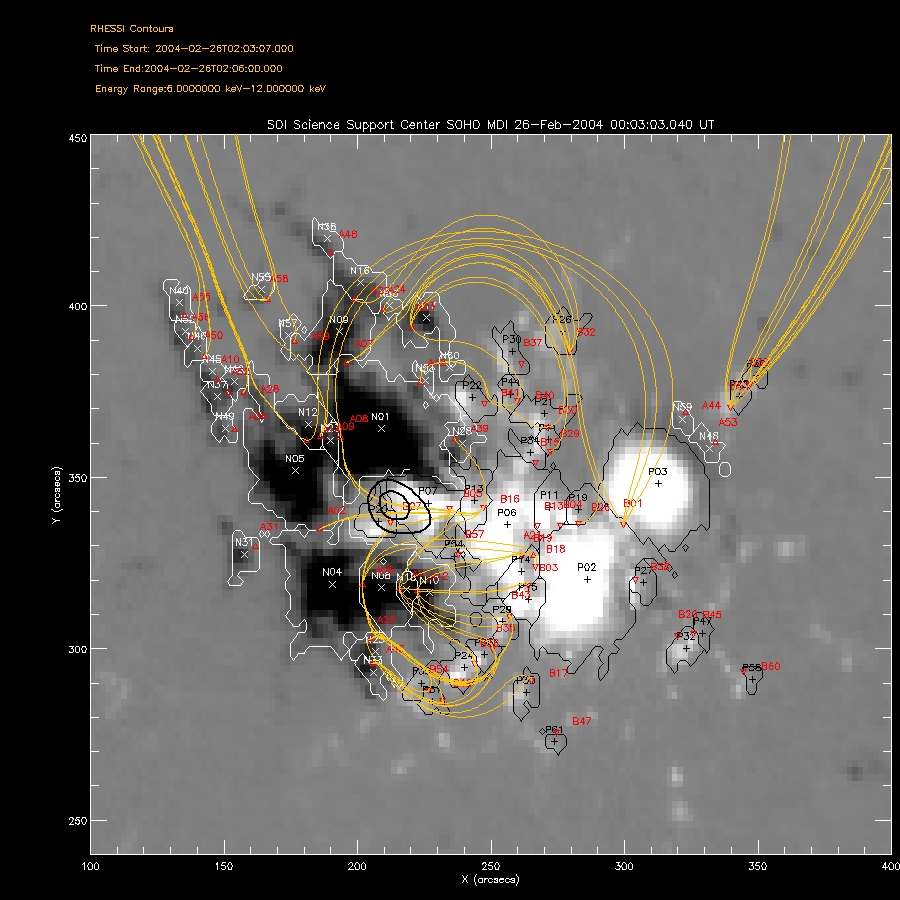
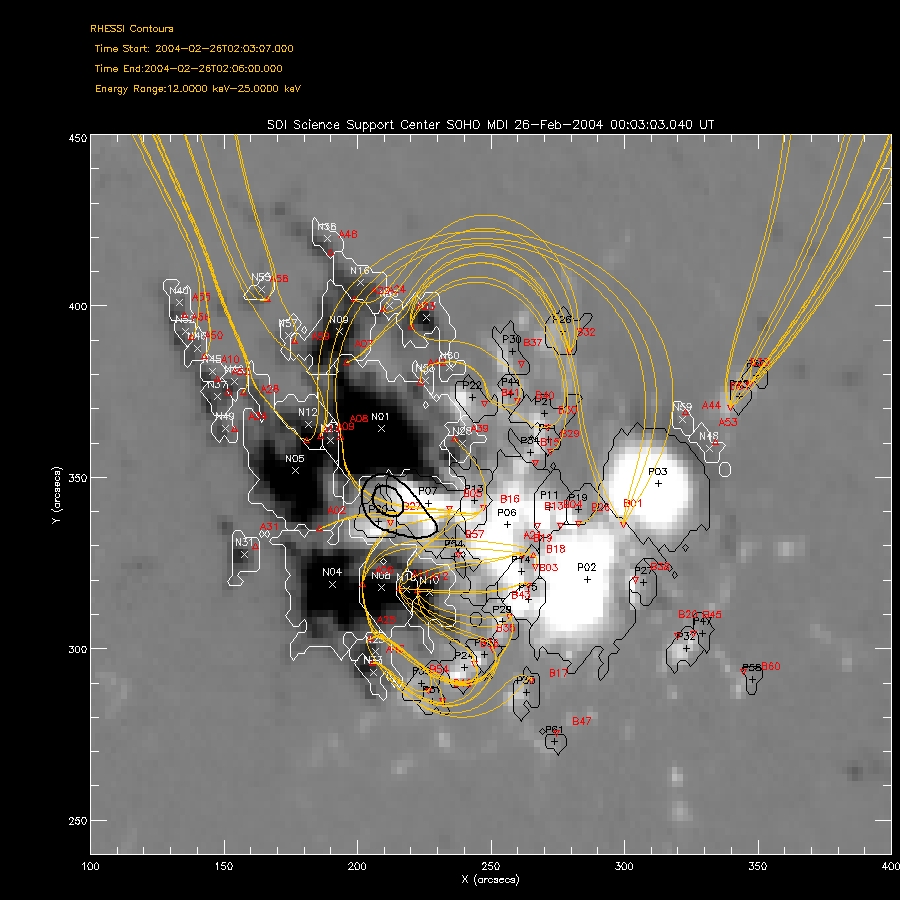
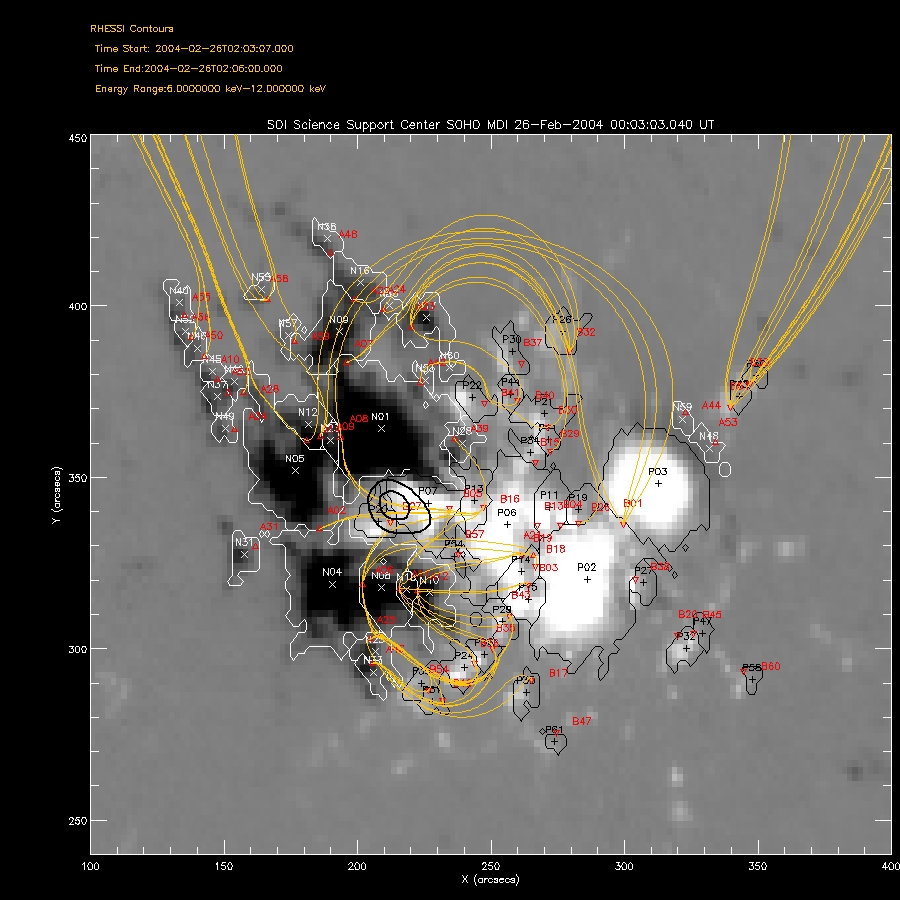
Made RHESSI overlays using a different mdi
magnetogram.
Impulsive phase
1:42:05- 2:00:53
Time start- 1:54:40
Time end- 1:55:00
Time Start- 1:57:40
Time End-1:58:30
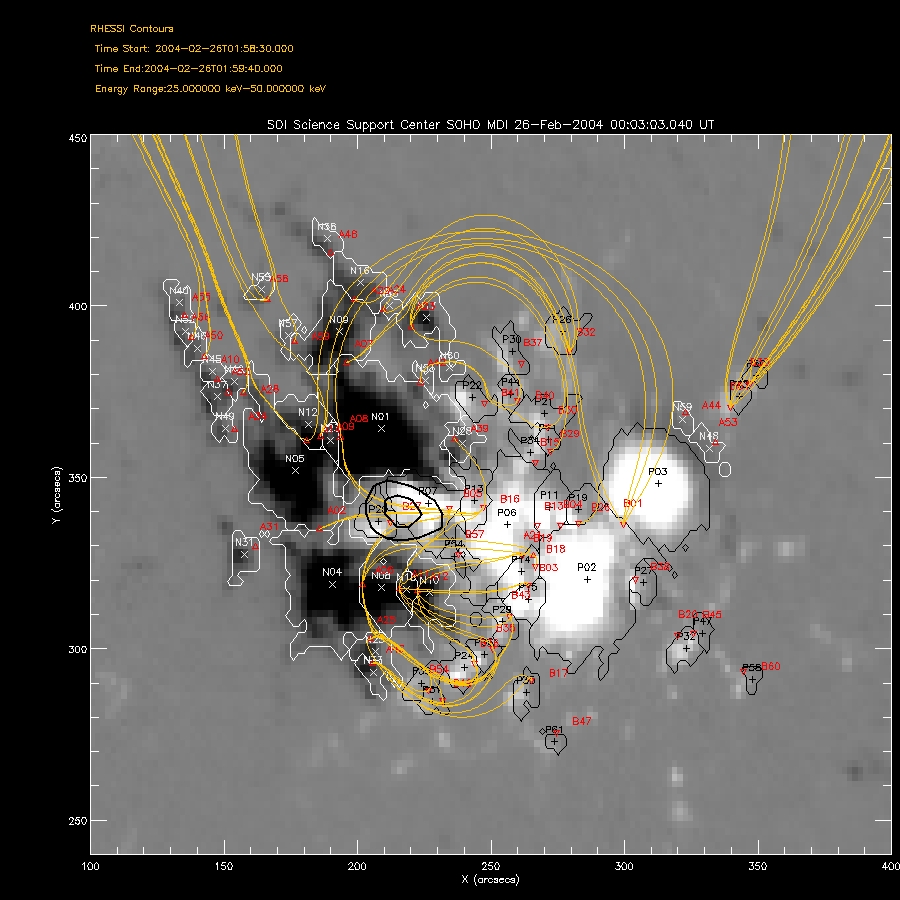
Time Start-1:58:30
Time End-1:59:40

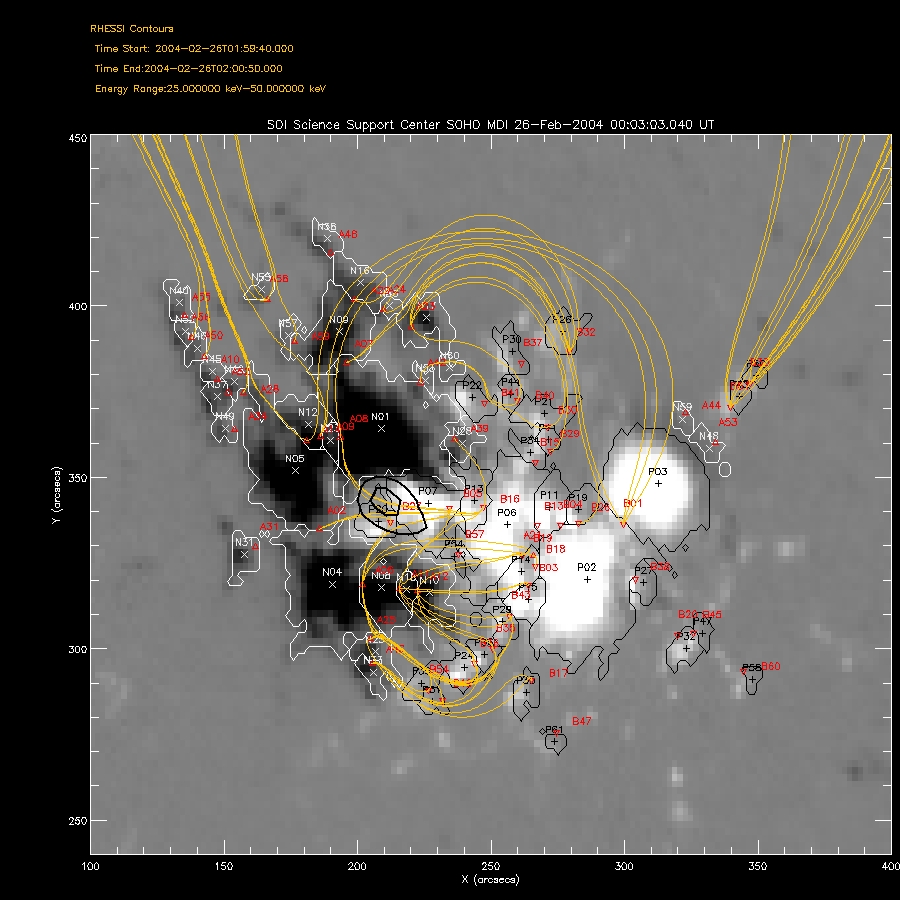
Time Start- 1:59:40
Time End-2:00:53

Peak
Time Start- 2:00:50
Time End-2:02:00
DECAY
PHASE
Time Start- 2:03:07
Time End-2:06:00
July
1, 2009
I started writing a program to
correct the pointing on the TRACE
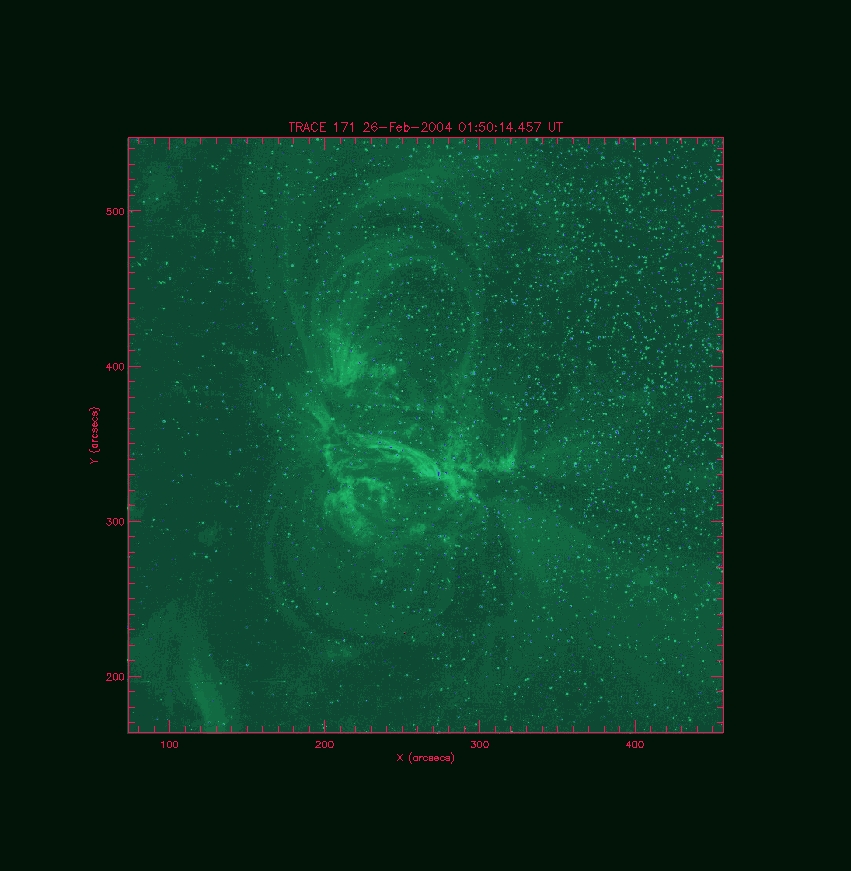
with reference to the SOHO MDI information for my flare. The TRACE
files for my flare finished downloading in the late afternoon and I
started working on a movie. TRACE is the Transition Region and Coronal
Explorer its a NASA Small Explorer mission to take images of the
solar
corona at high angular and temporal resolution. For more information
check out the official TRACE web
site.
FLARE
X 1 MOVIE
July 2, 2009
I realized the program I was
writing would not help me due to the
TRACE files I have are all corrected. All I need to use is one program
called trace_mdi_align. Unfortunately once I input both fits files for
SOHO MDI and TRACE into the program its output told me it could not
find "GET ORBIT" data so now I have to figure out where it might me
located in the structure.
Brian Dennis, an Astrophysicist
from Goddard, told Angela about a new
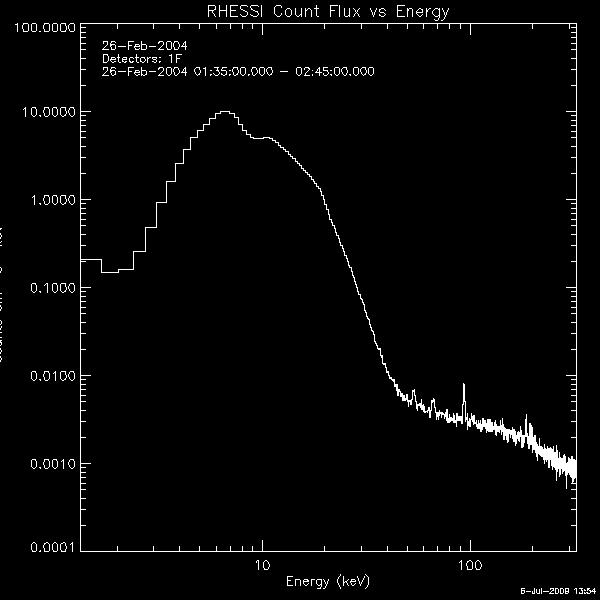
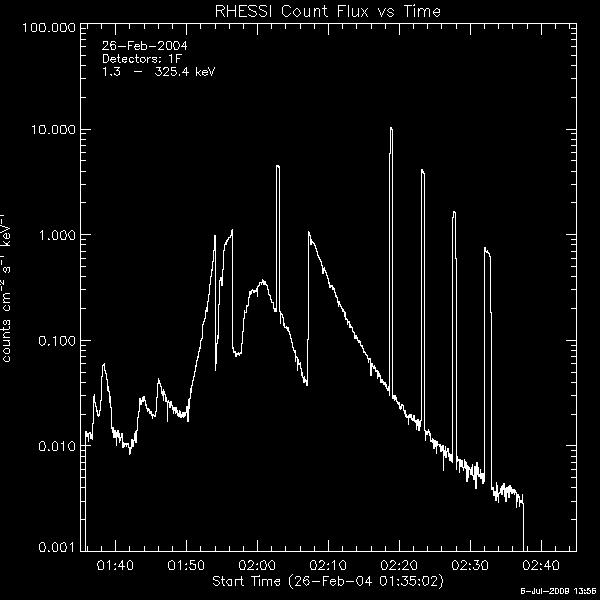
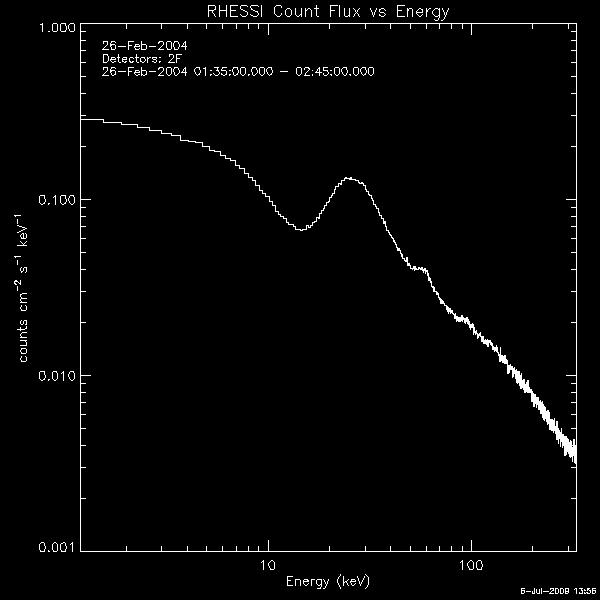
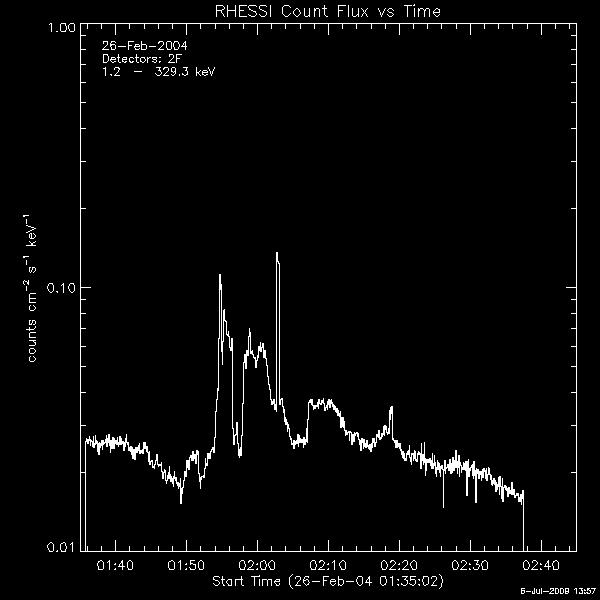
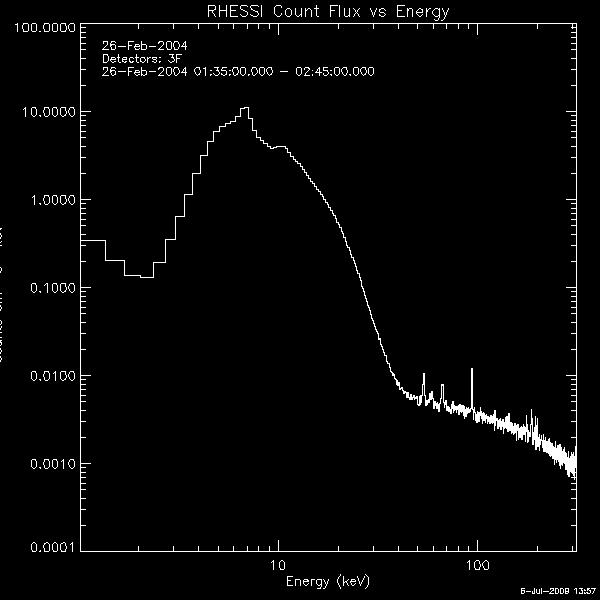
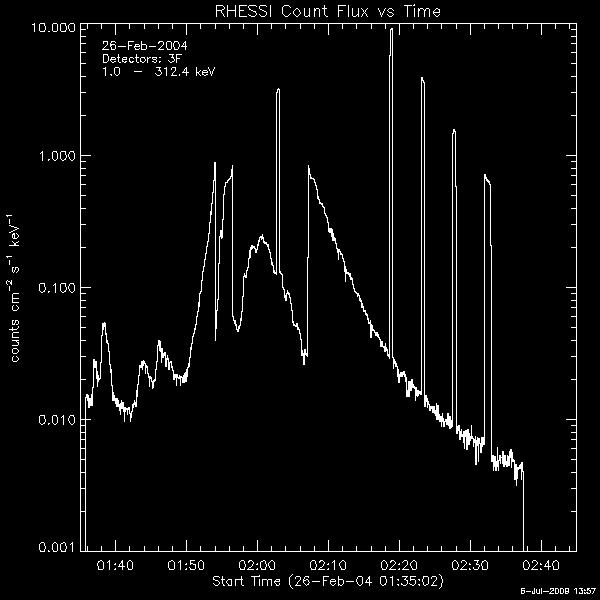
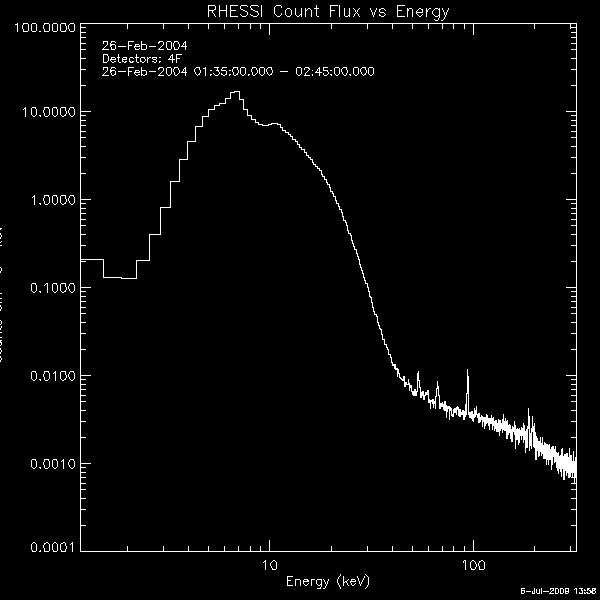
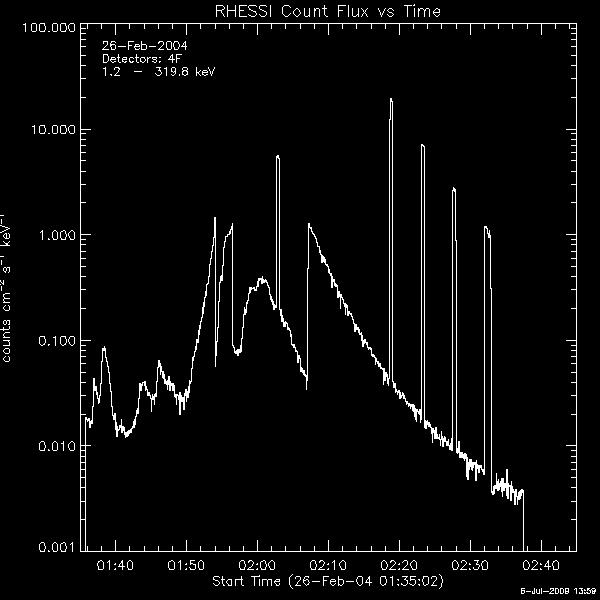
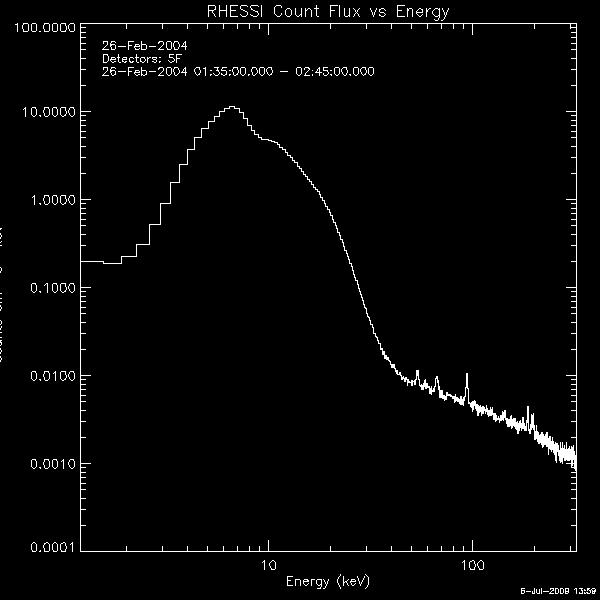
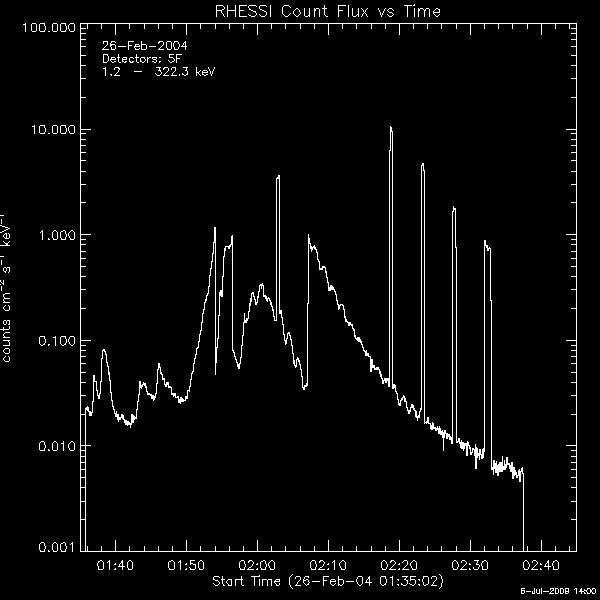
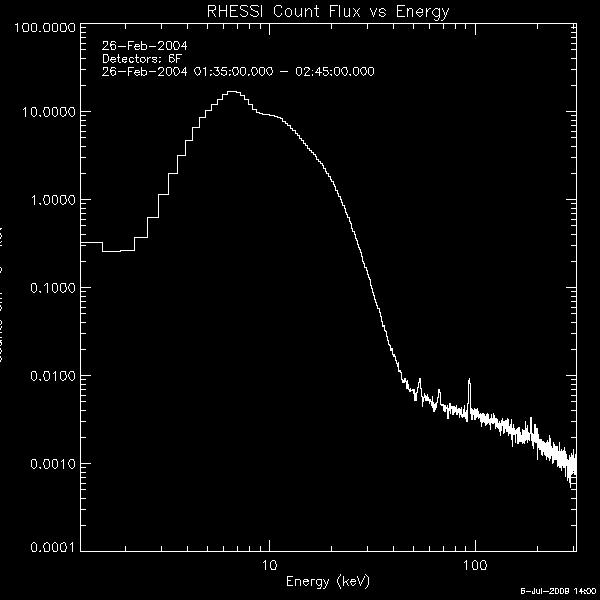
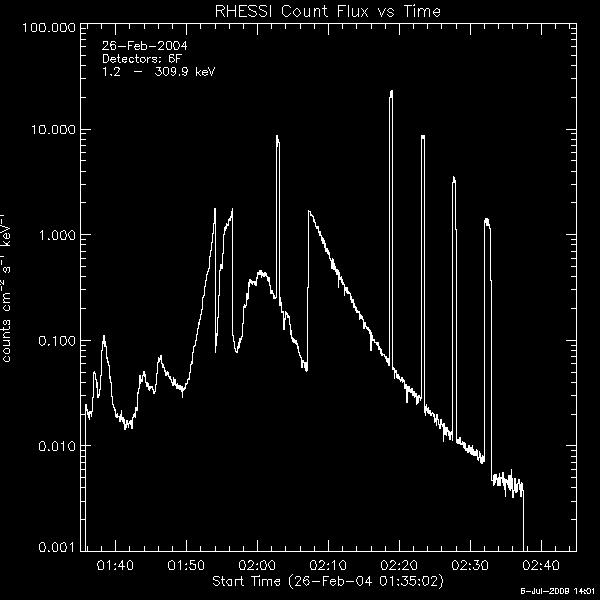
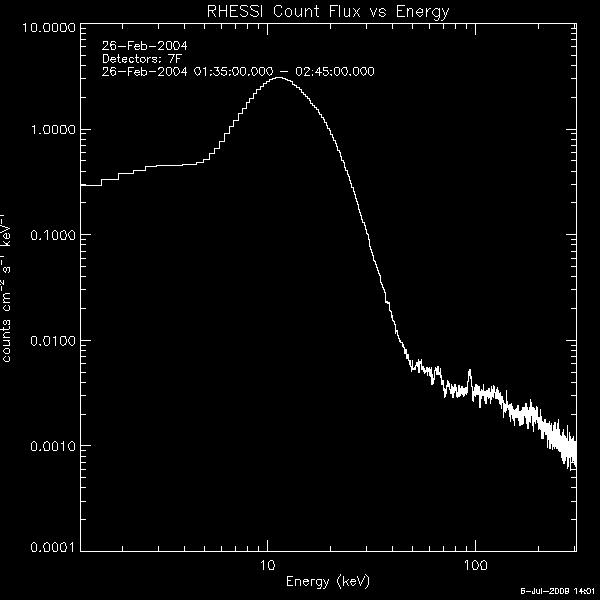
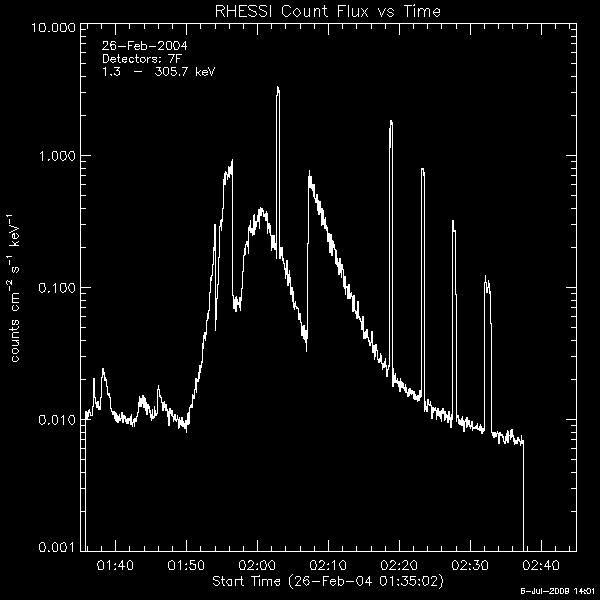
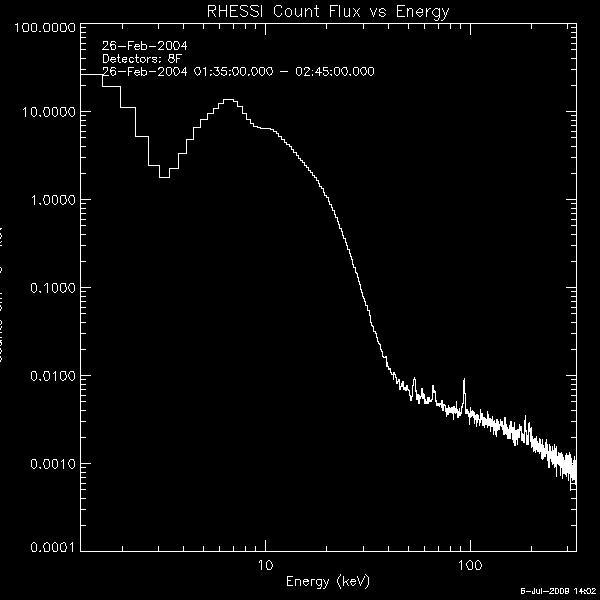
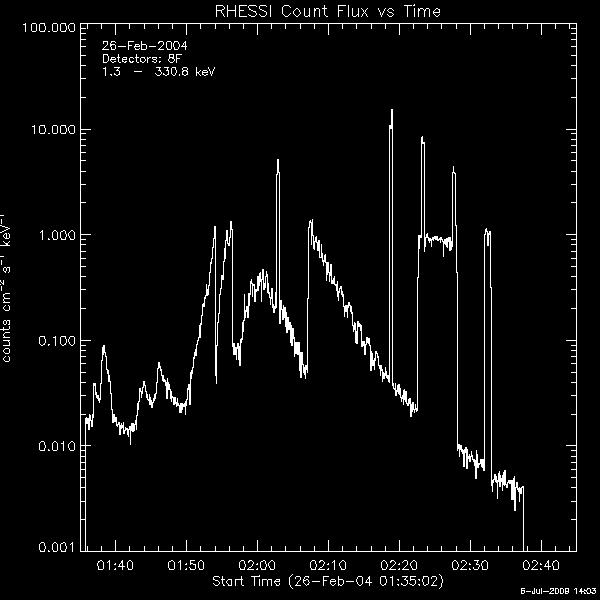
program called HSI_SPECTRUM_SEP_DET_FILES. Its purpose is to generate
separated spectrum and srm files for each RHESSI detector when given
the time interval of the flare. This is a new way to analyze spectral
data. The spectrum plots for each detector are below.
Detector 1
Detector 2
Detector 3
Detector 4
Detector 5
Detector 6
Detector 7
Detector 8
Detector 9
