
WEEK
TWO
June 8, 2009
This is the begging
of the second week
without the
IDL session. Now I have the chance to sit down and concentrate on my
project. Today Angela and I went over how to create a PNS file
which stands for stands for poles, nulls, and separators. I will be
using a program that Dana Loncope created; the program creates a
topological structure of a magnetogram using the MCT model.
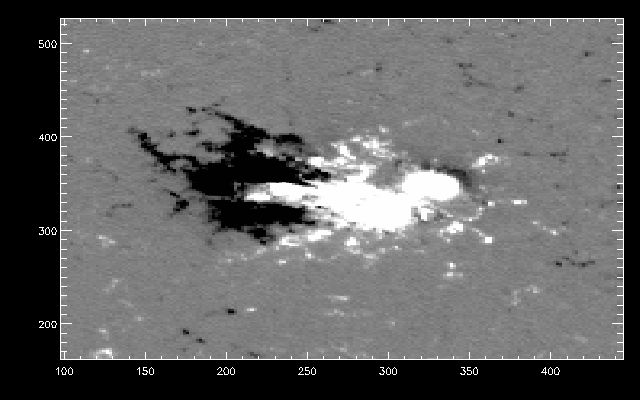
First, select the
area on the photosphere from the magnetogram where the flare is being
released on the sun.
This was
the image I originally produced but decided the
dimensions of the window was to small so I later increased it to
700x700.
-
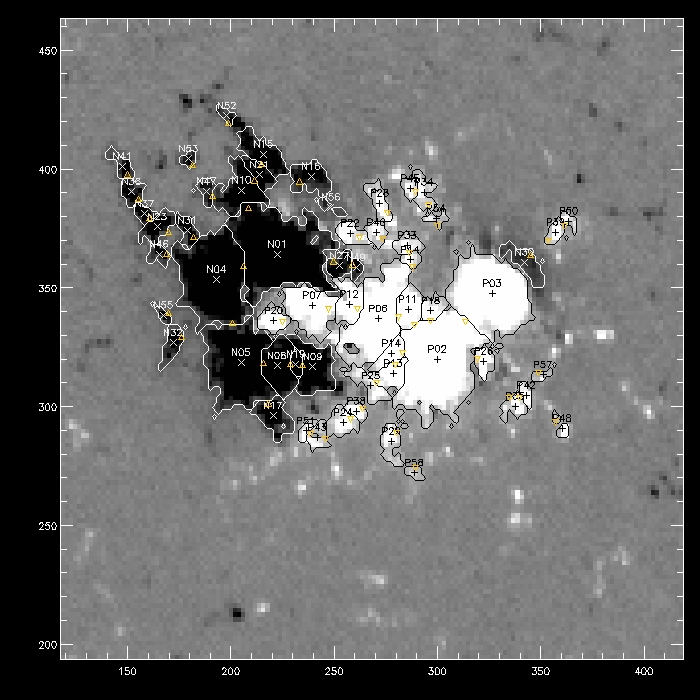
-Next step is to tell the program to create a mask that will
locate the poles and the
strongest array of magnetic flux.
It then
breaks
the magnetic field into different pieces.
-After creating a mask,
you tell the program to locate the poles
within
the mask. The conventional color schemes for the poles
are black spots
are negative and the white spots are positive.
The command tells the program to place a point source in the
center of each pole
but there is another command that will allow
the program to place a
quadrapole in the center( I will be doing this later).
The second to last step
is to find the nulls. Nulls are the
location where
magnetic field
lines vanish and are between to like
sources.
The null points are symbolized by yellow triangles.
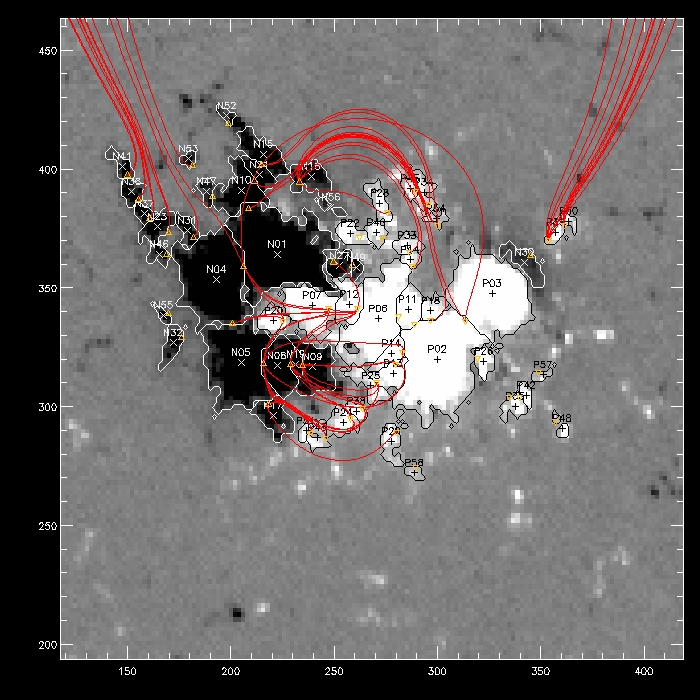
Finally,
find the
separators connecting each null.
I made the
separators red to see them clearly on
the magnetogram. This is
the
final image
:
I
continued to make an overall light curve that spanned from 01:55 to
2:10 UT this enabled me to see the various intervals of energy and to
observe when there was a change in the attenuators.
-An attenuator is an electronic device that reduces the amplitude or
power of a signal
without appreciably
distorting its waveform.
I then continued to make three separate light curves that avoided the
attenuator change. The attenuator periodically changes to check
the
level of x ray flux and decides if it should change to higher
or
lower attenuator depending on the flux. The avoidance
of the attenuator
change gives an accurate account of the
count range. I created a naming scheme to place
in my home directory to distinguish
my files:
light curves -
lgt_curve_time start_time end_energy
intervals_
resolution (secs)_ attenuator.jpg/ps
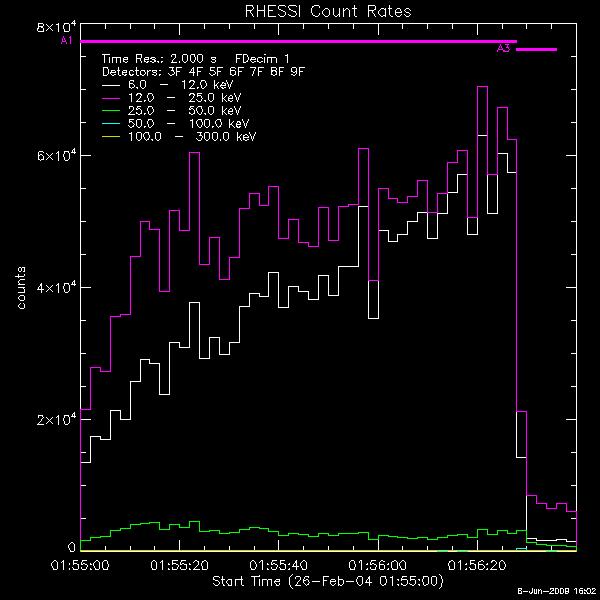
Time start-
1:55
Time end-1:56:40
Resolution- 2 sec
Energy intervals-5
Attenuator- A1
File name: lgt_curve_155_1564_5_2
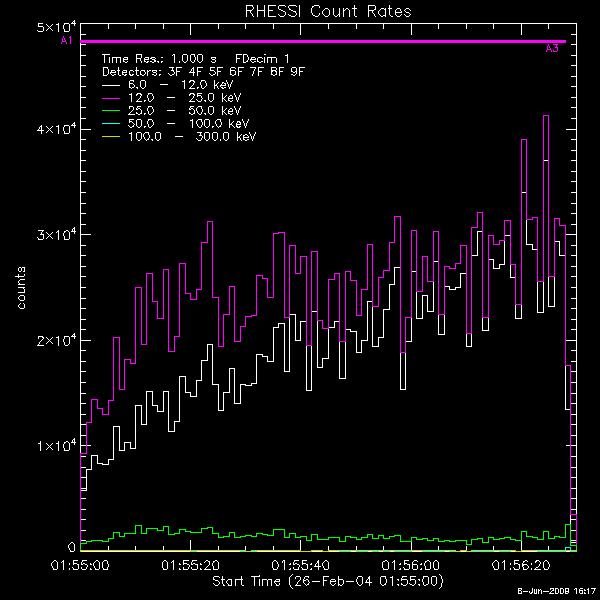
Time start- 1:55
Time end-1:56:33
Resolution- 1 sec
Energy intervals-5
Attenuator- A1
File name: lgt_curve_155_15633_5_1_a1
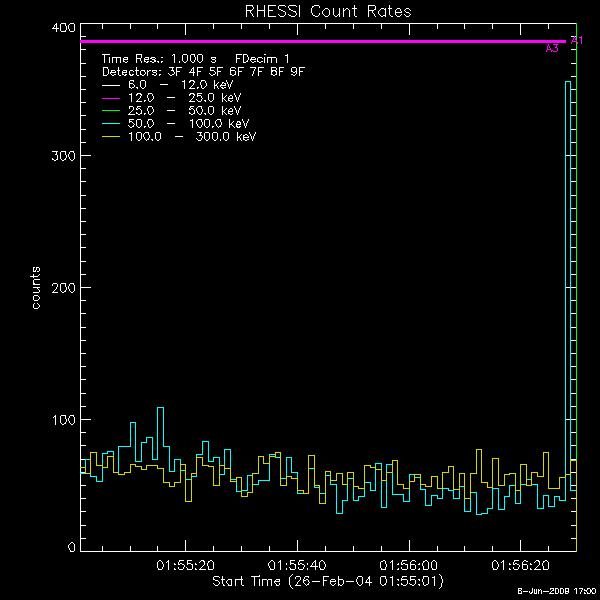
Time start- 1:55
Time end-1:56:30
Resolution- 1 sec
Energy intervals-5
Attenuator- A1
File name:
lgt_curve_155_15630_5_1_a1
Time
start- 1:55
Time
end-1:56:30
Resolution-
1 sec
Energy
intervals-5 zoomed into
see higher energy bands to see if had enough counts to produce a image
50 to 300 keV
Attenuator-
A1
File name: lgt_curve_155_15630_50-300_1_a1

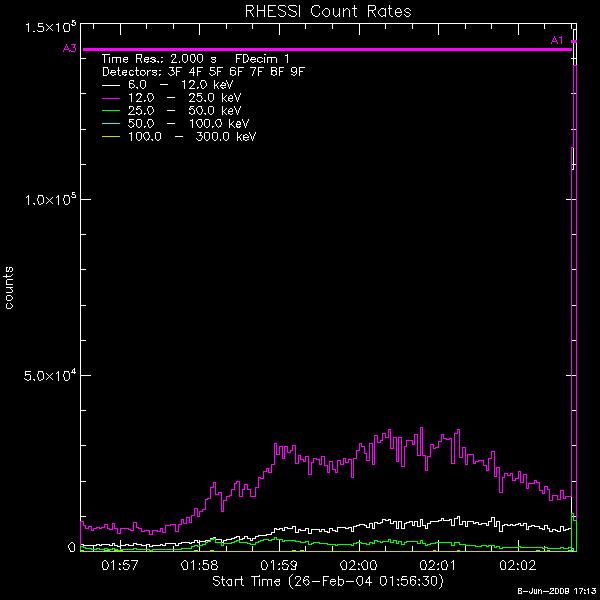
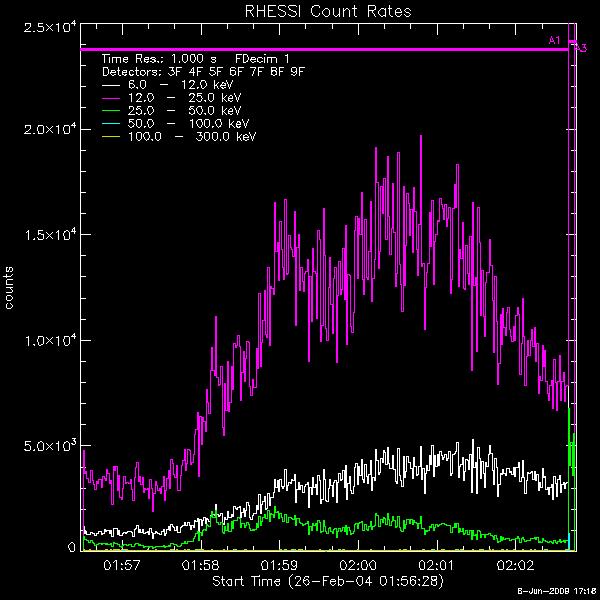
Time start- 1:56:30
Time end-2:02:45
Resolution-2 sec
Energy intervals-5
Attenuator- A3
File name:
lgt_curve_1:56:30¬_2:02:45_5_2_a3
Time start-
1:56:30
Time
end-2:02:45
Resolution-1sec
Energy
intervals-5 zoomed
Attenuator-
A3
File name: lgt_curve_1:56:30¬_2:02:45_x5_1_a1
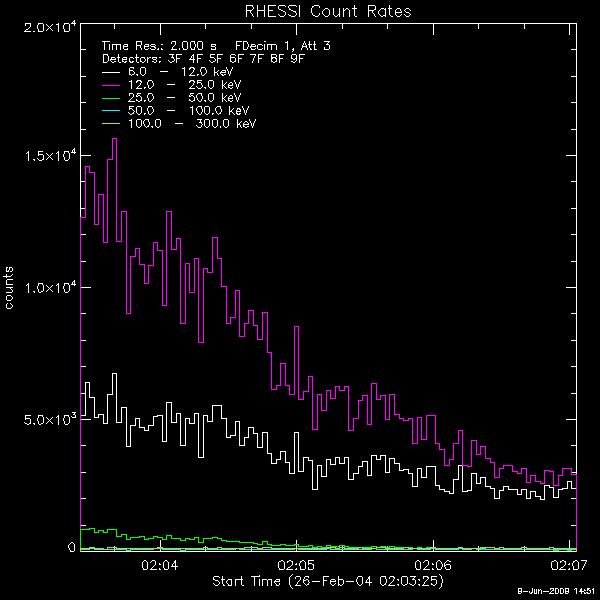
Time start- 2:03:25
Time
end-2:07:45
Resolution-2sec
Energy
intervals-5
Attenuator-
A3
File name:
lgt_curve_2:03:25_2:07:45_5_2_a3
June 9, 2009
Today was
the start of
our bi weekly solar lectures. Our first
lecture was given by Dana
Loncope discussing the sun as star,
which it is. The lecture was very
interesting because it incorporated
physics with the concepts that I
have learned about the sun.
I struggled with computer issues on my lap top and then on the desktop
but finally after a couple of hours I was able to use Helios
properly.
I made a couple of clearer light curve images.
Time
start- 1:55:30
Time
end-1:56:30
Resolution-2
sec
Energy
intervals-5
Attenuator-
A1
File
name:
lgt_curve_1:55:30_1:56:30_5_2_a1

Time start- 2:03:25
Time end-2:07:03
Resolution-2 sec
Energy intervals-5
Attenuator- A3
File name: lgt_curve_2:03:25_2:07:03_5_2_a3

From
the light curves I was
able to clearly see if there were enough
counts
to make images of
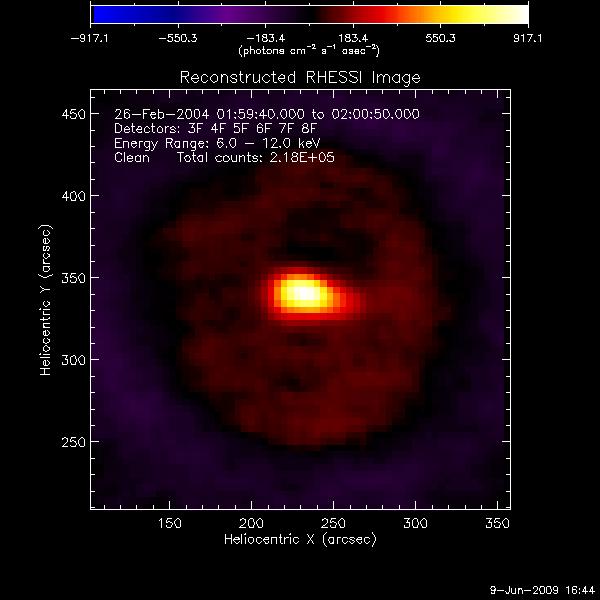
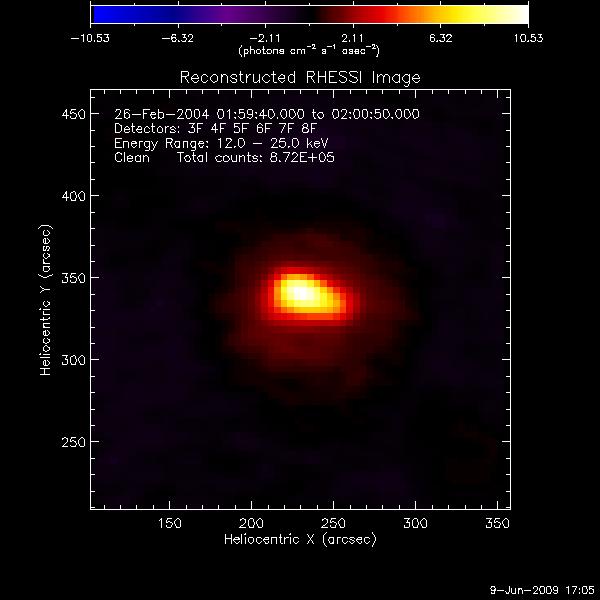
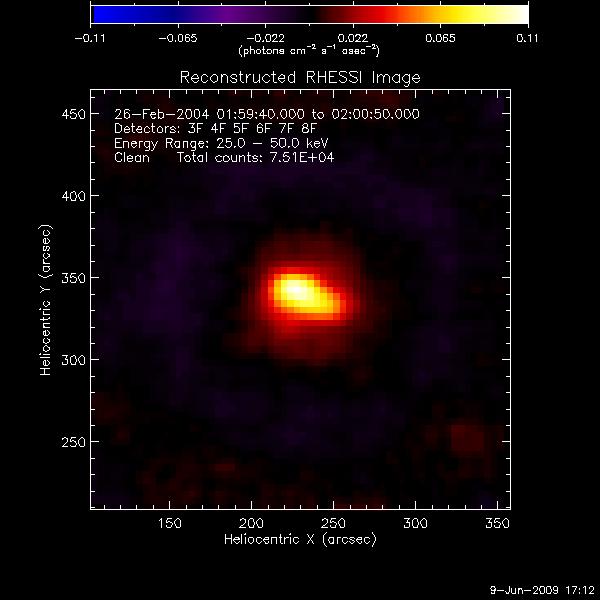
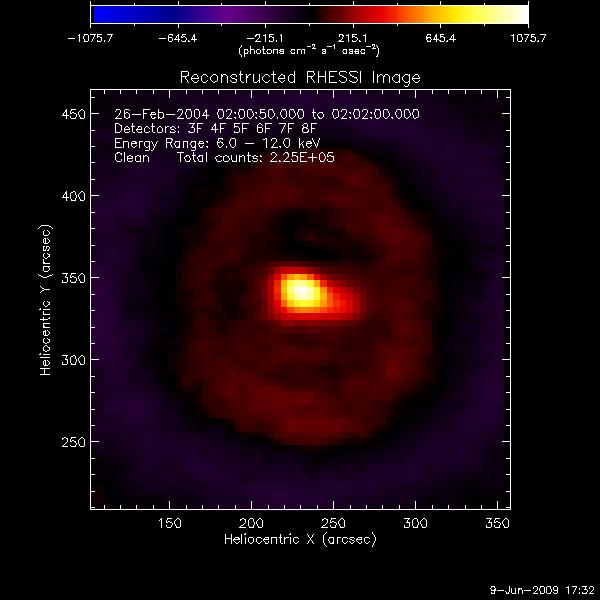
various energy intervals. I then created
images
with smaller time
intervals. I also created a naming
scheme
for RHESSI images.
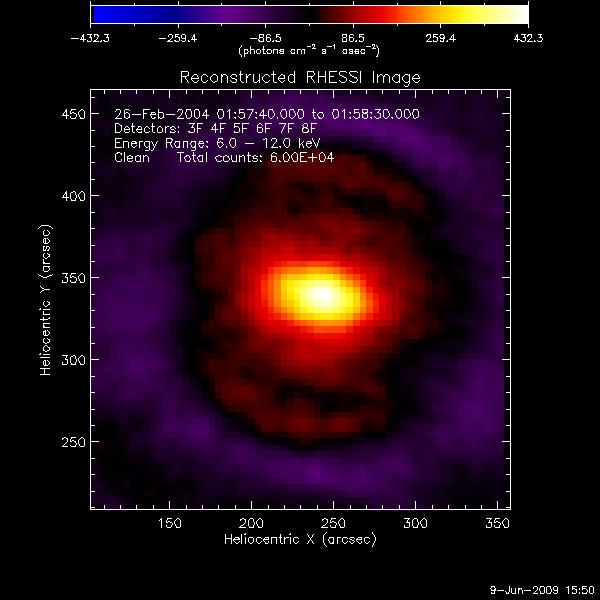
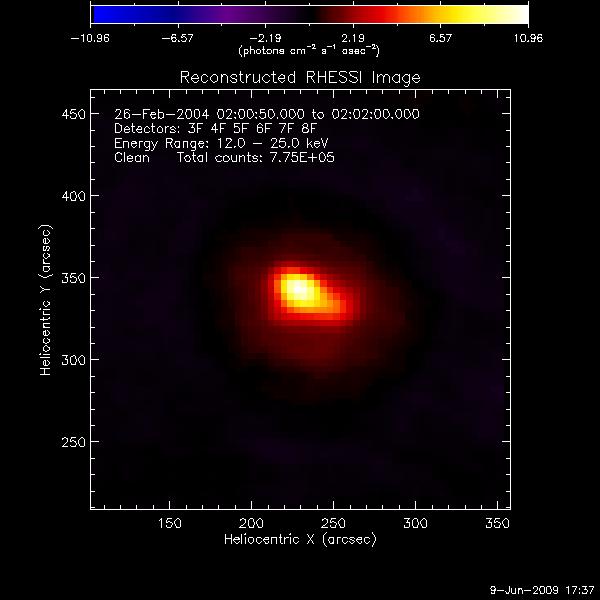
File name: hessi_images_start time-end time_energy interval
Time start- 1:57:40
Time end-1:58:30
Energy intervals-6-12
File name:
hessi_images_1:57:40-1:58:30_6-12
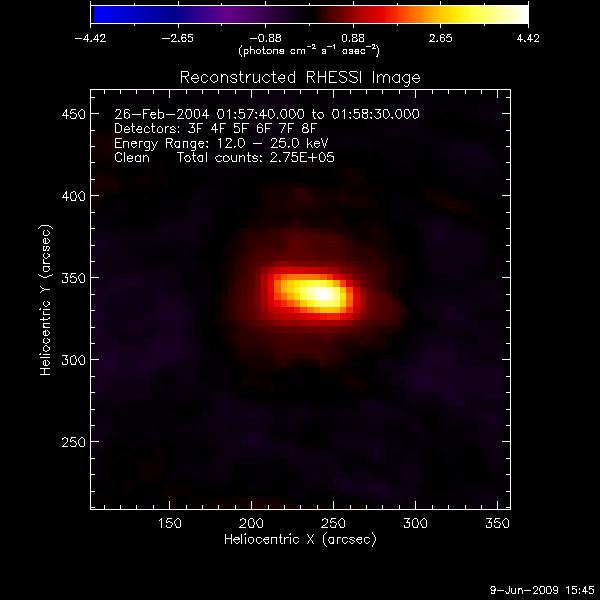
Time start- 1:57:40
Time end-1:58:30
Energy intervals-12-25
File name: hessi_images_1:57:40-1:58:30_12-25
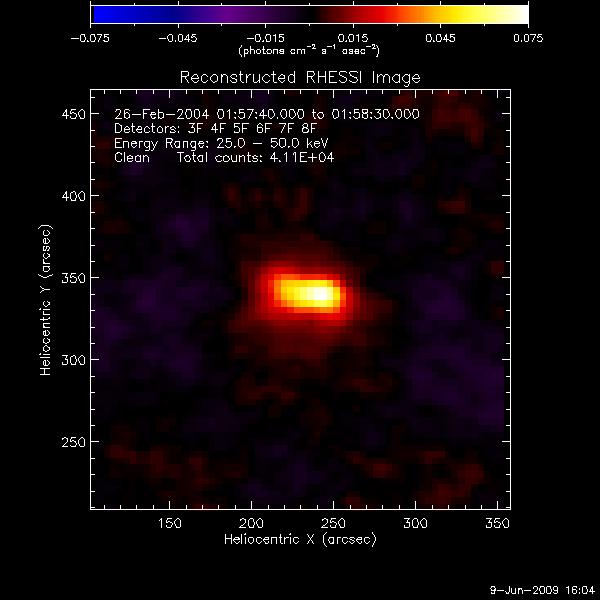
Time start- 1:57:40
Time end-1:58:30
Energy intervals-25-50
File name: hessi_images_1:57:40-1:58:30_25-50
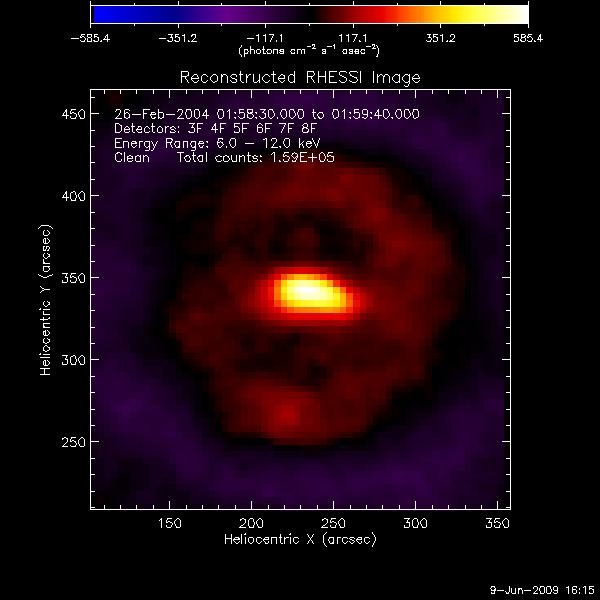
Time start1:58:30
Time end-1:59:40
Energy intervals-6-12
File name: hessi_images_1:58:30-1:59:40_6-12
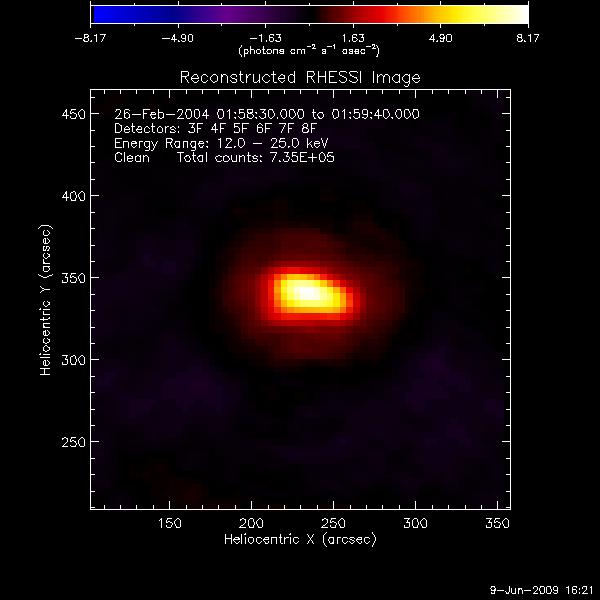
Time start1:58:30
Time end-1:59:40
Energy intervals-12-25
File name: hessi_images_1:58:30-1:59:40_12-25
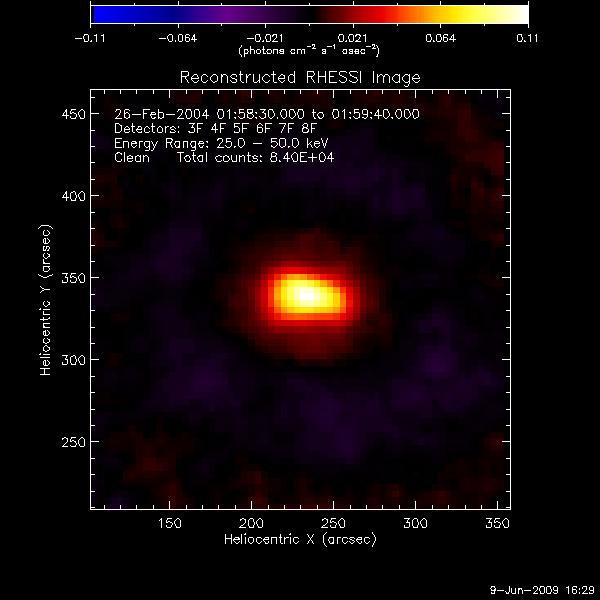
Time start1:58:30
Time end-1:59:40
Energy intervals-25-50
File name: hessi_images_1:58:30-1:59:40_25-50
Time start-1:59:40
Time end-2:00:50
Energy intervals-6-12
File name: hessi_images_1:59:40-2:00:50_6-12
Time start-1:59:40
Time end-2:00:50
Energy intervals-12-25
File name: hessi_images_1:59:40-2:00:50_12-25
Time start-1:59:40
Time end-2:00:50
Energy intervals-25-50
File name: hessi_images_1:59:40-2:00:50_25-50
Time
start-2:00:50
Time end-2:02:00
Energy intervals-6-12
File name: hessi_images_2:00:50-2:02:00_6-12
Time start-2:00:50
Time end-2:02:00
Energy intervals-12-25
File name: hessi_images_2:00:50-2:02:00_12-25
June
10, 2009
I continued to make images
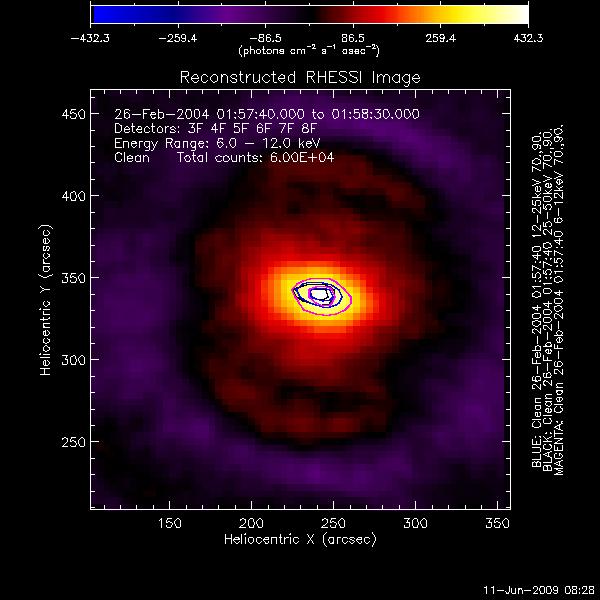
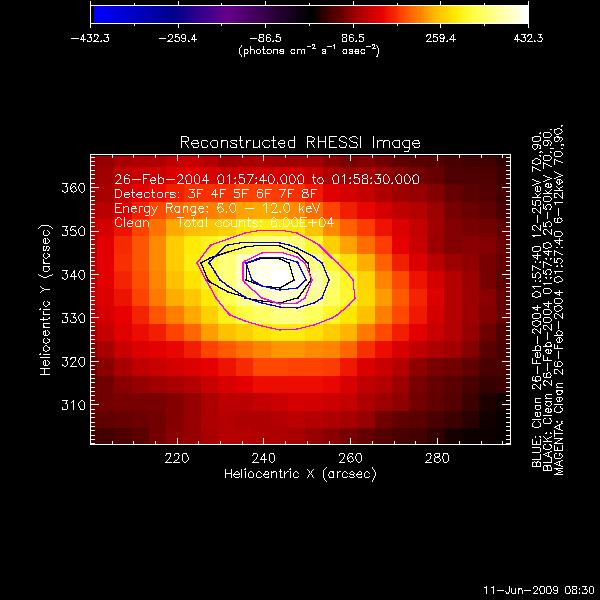
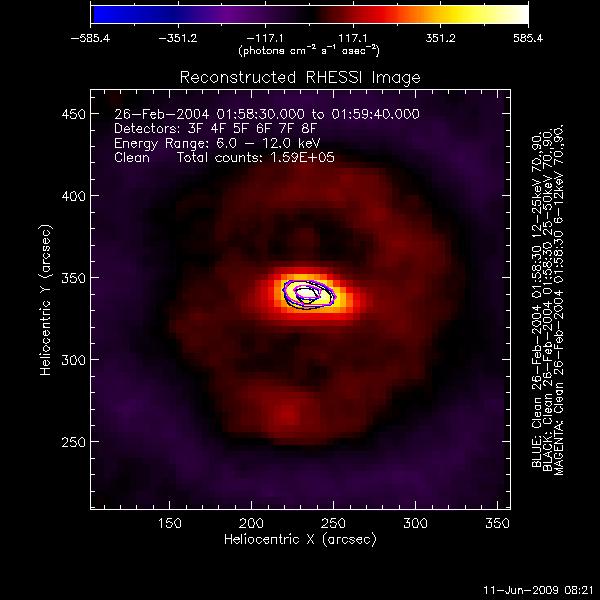
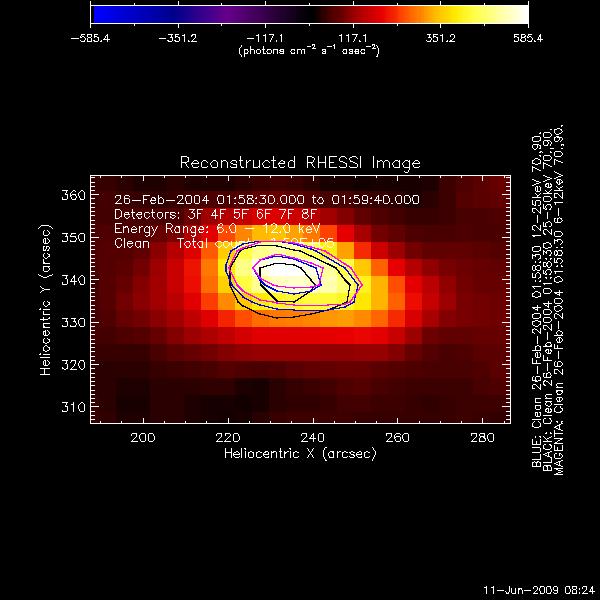
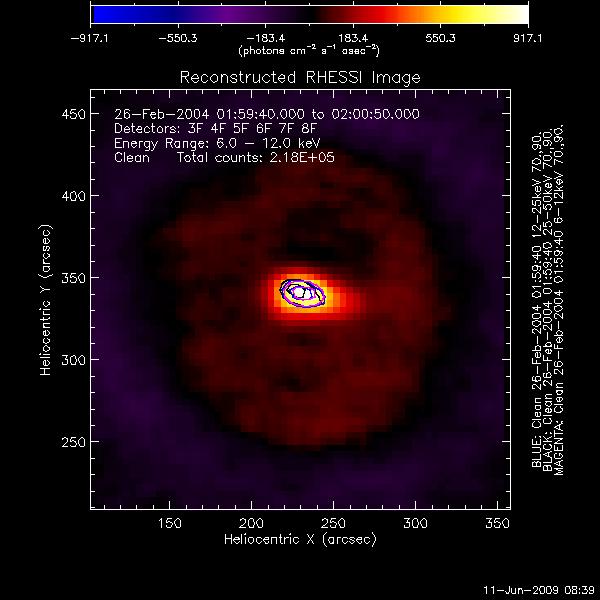
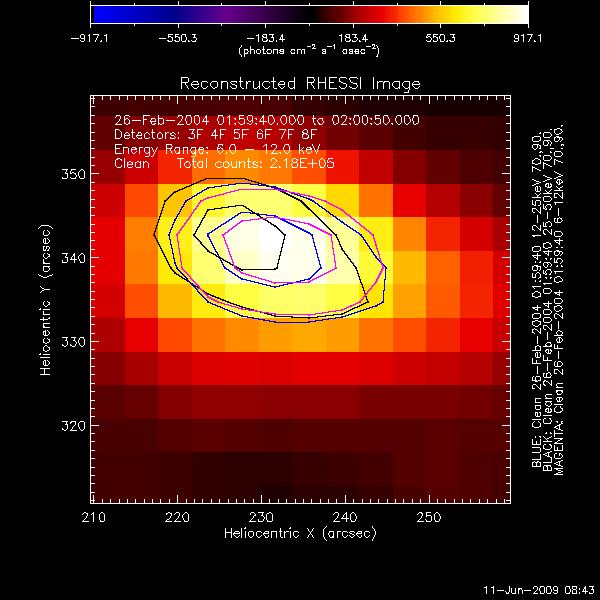
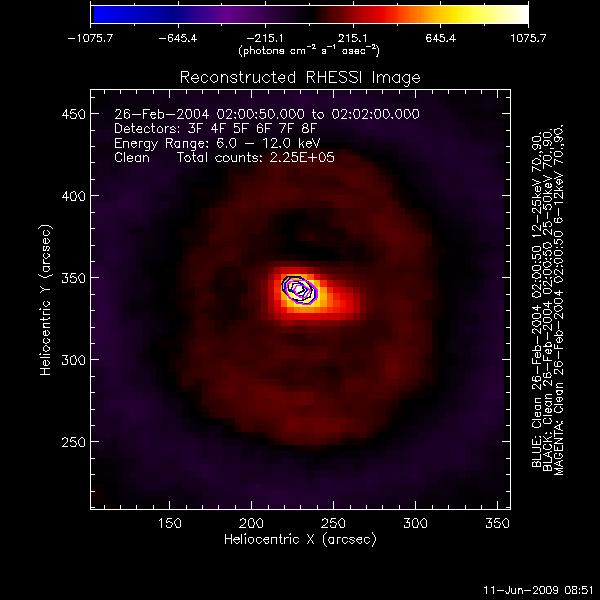
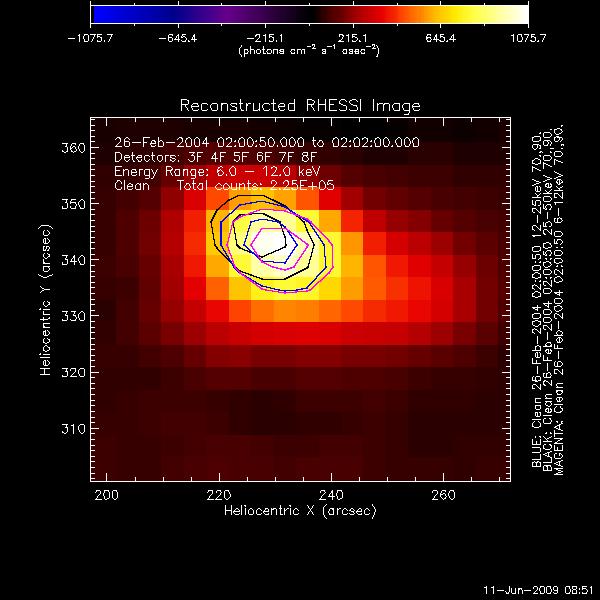
but this time I overlaid the 6-12 keV
clean image with contours 70 and 90 percent of the max from 6-12 keV,
12-25 keV, and 25-50
keV energy levels.
The contours allow you to see the source moving with respect to the
different energy intervals. My flare is interesting because
the source point hardly
moves making it a source of heat and not a foot
print. The images speak for themselves.
The colors equal:
-
magenta contours-6-12 keV
-blue contours-12-25
keV
-black contours-25-50 keV
Full view
Zoomed view of the source
point
June 11,2009
There
was a
lecture on instrumentation by Dr. Charles Kanelborg.
He focused
on the various trajectories of satellites and how
EUV imagers operate.
I
started the first of a two part tutorial on OSPEX.
OSPEX stands for Object Spectral Executive it is an
object-oriented
interface for X-ray
spectral analysis of solar data. I will be
using OSPEX to analyze
RHESSI data for the class X-1 Flare.
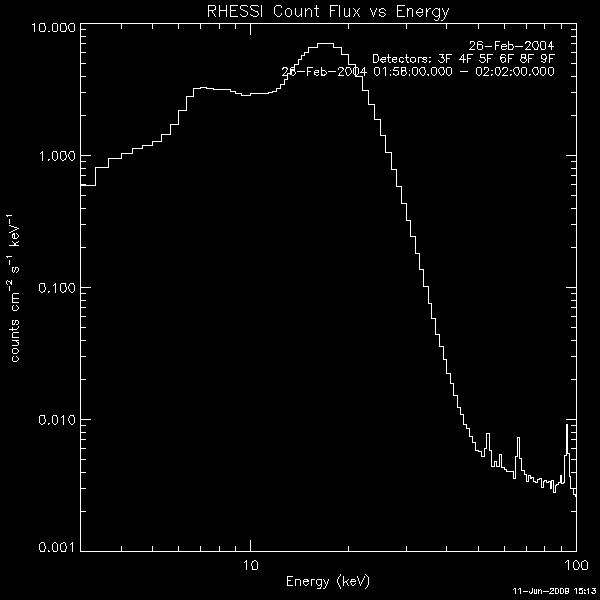
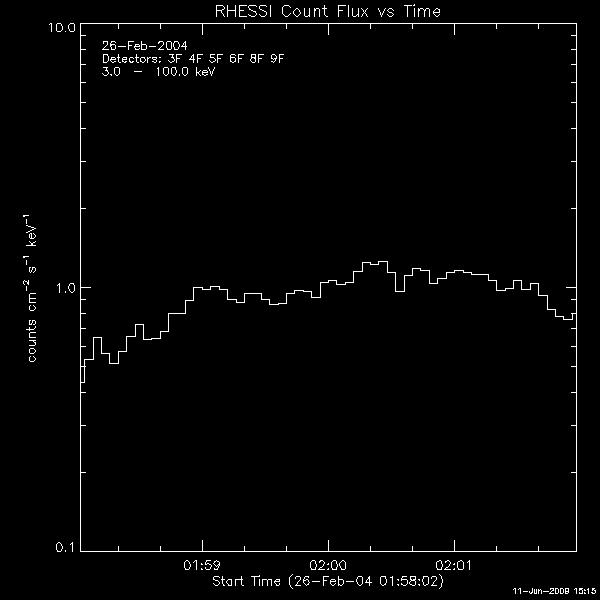
I
made spectral graphs starting from 1:58 to 2:02 UT.
I
created a
new directory and a naming scheme for the
for the X-ray spectral graphs.
Hessi_spectrum_time
start-time end_plots.extension
 June 12, 2009
Today I started writing a program
that would
overlay the hard X ray
contours over the topology.
I spent most of the day
writing it and going
through trial and error to get
it to run properly.
Luckily, I was interrupted to
participate in my
weekly solar flare meeting to
give the solar flare
team an update on my week’s
work. The meeting
was successful because I
was able to see my fellow
REU colleague’s projects. I
was able to compare their
solar flares to mine. A common
occurrence in their
flares was their flares
had foot points and in mine I have a
foot point at the beginning of the rise phase and then it becomes
a thermal
source. My flare is considered a
thermal source due to
the lack of movement, spectroscopy, and the heating from the top of the
loop.


