 WEEK
NINE
July
27, 2009
This week I'm doing the finishing touches on collecting data and then
Angela and I will start analyzing it.
Below are TRACE images overlayed with 6-12 keV and 25-50 keV
RHESSI contours.
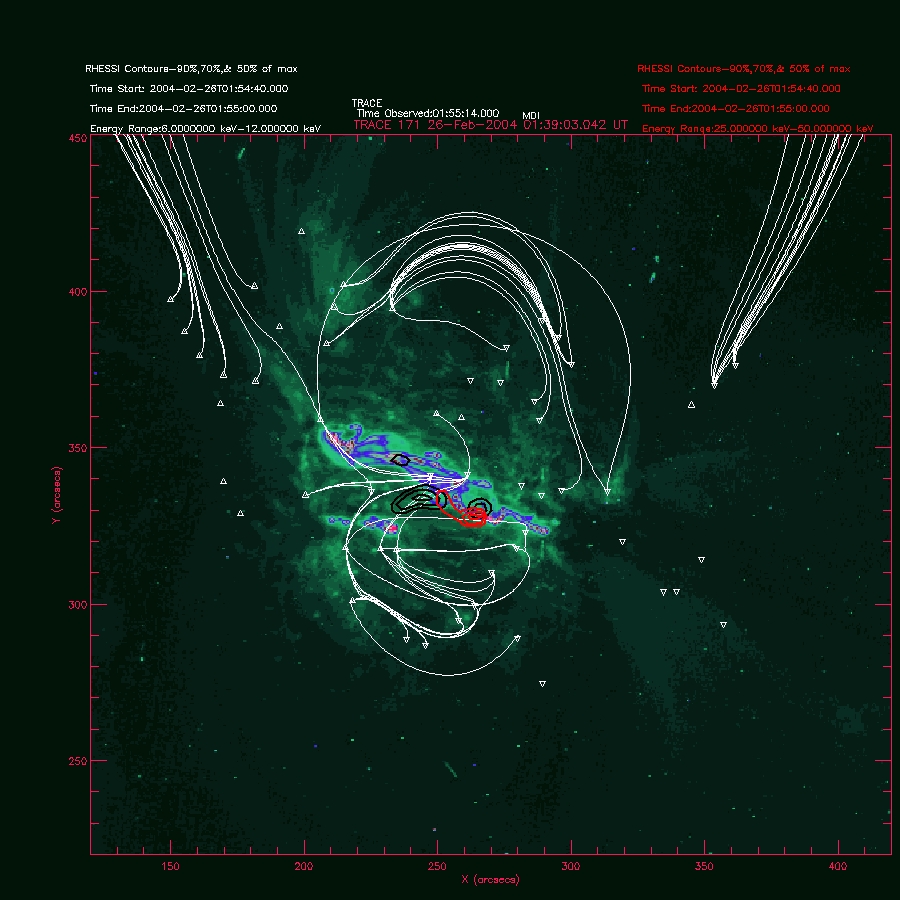
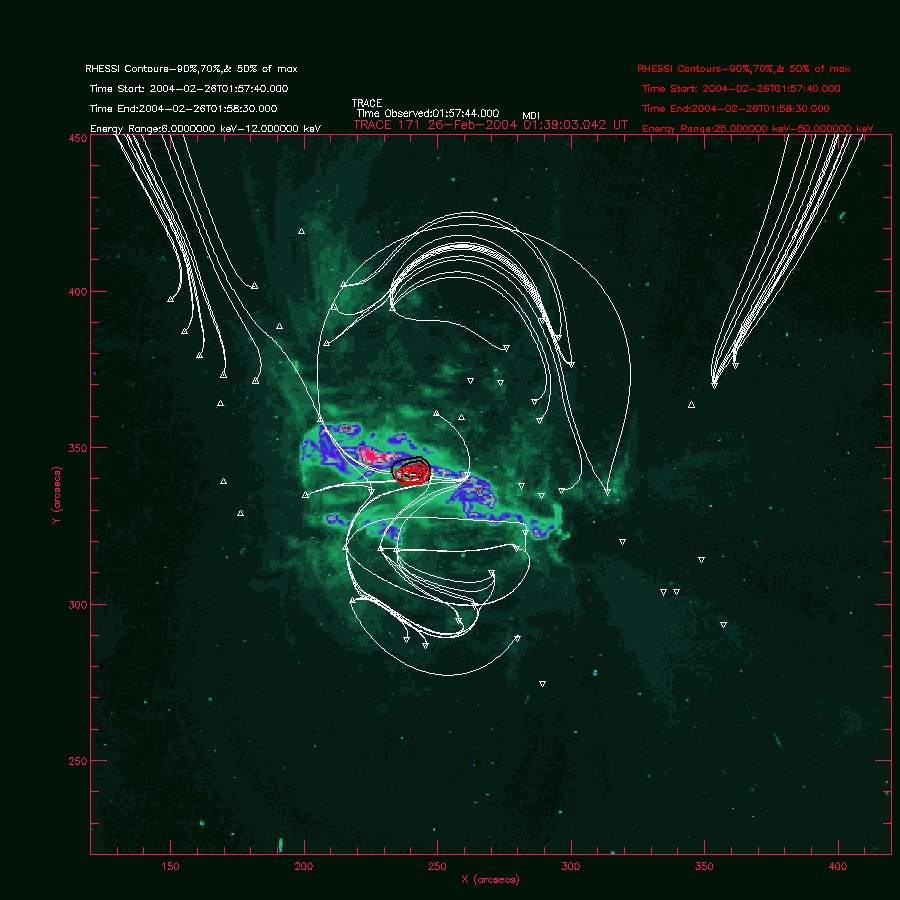
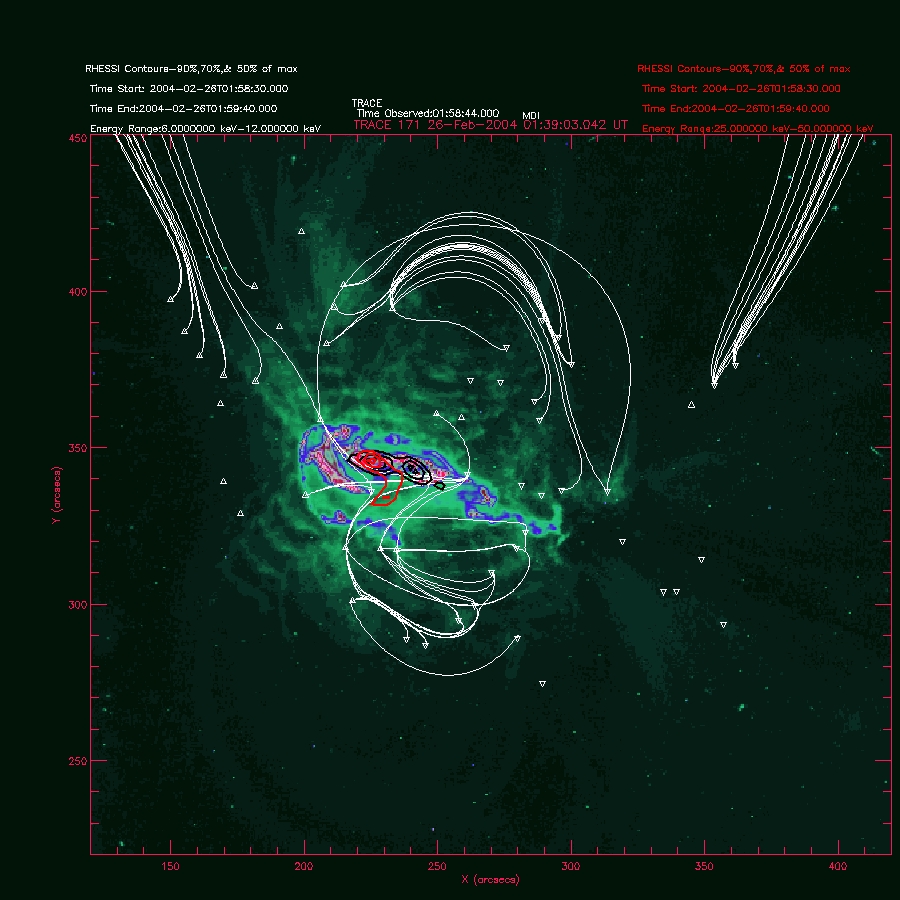
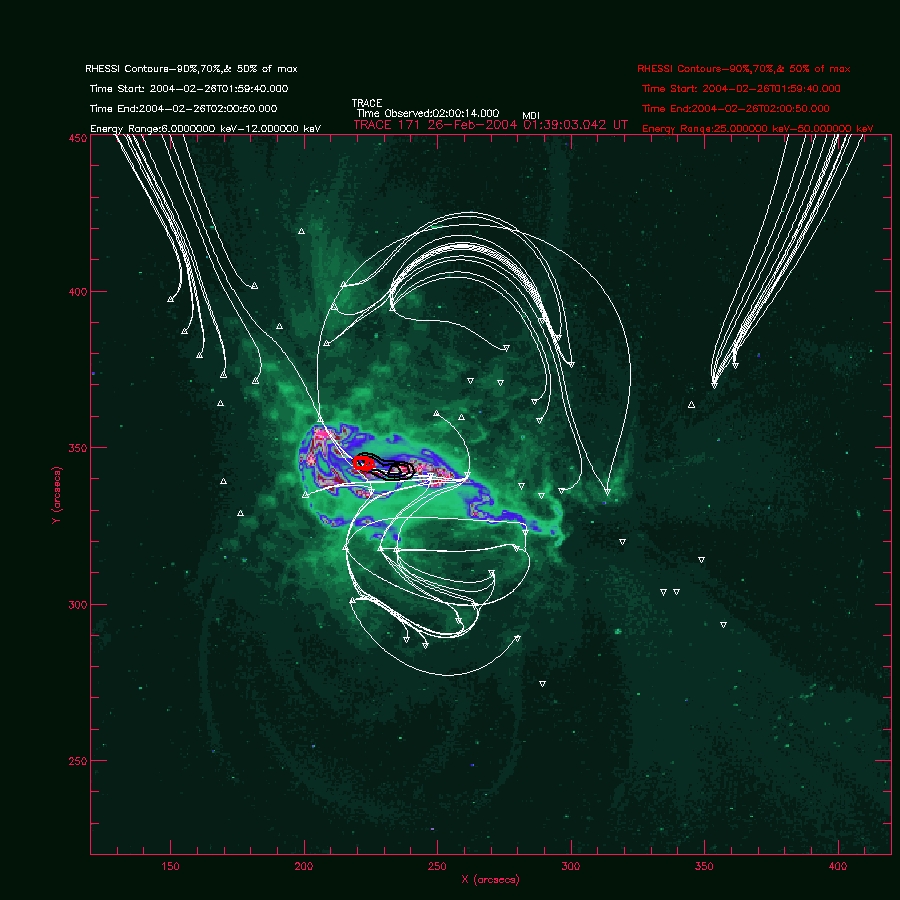
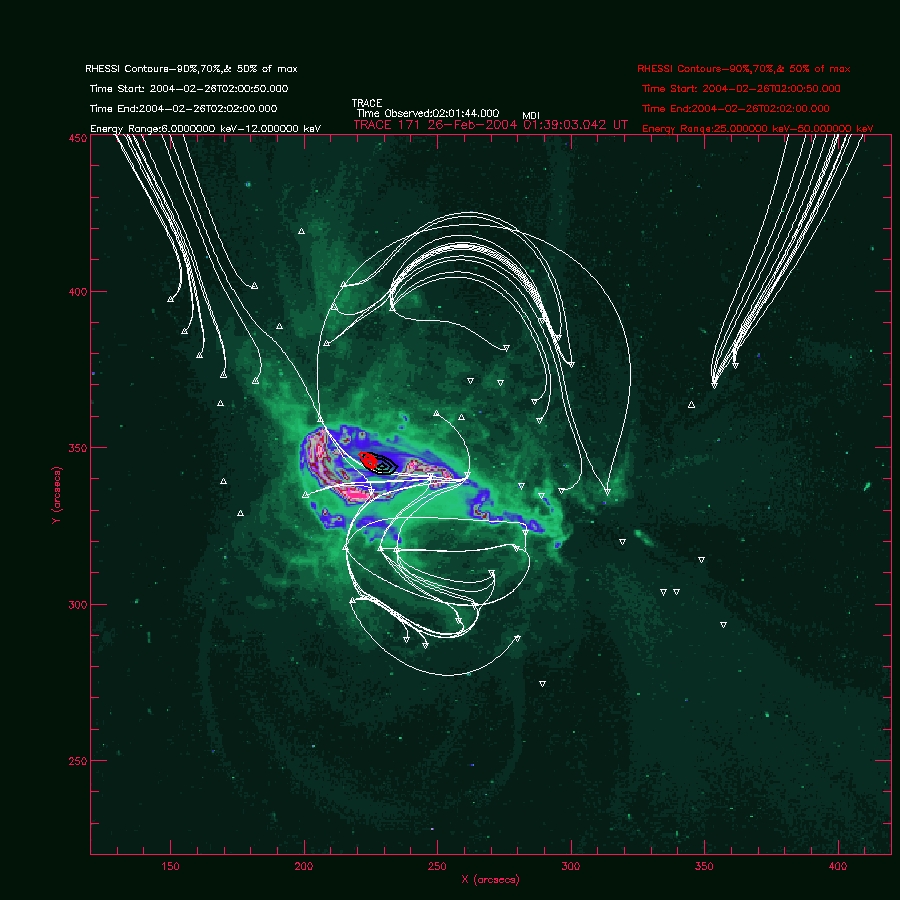
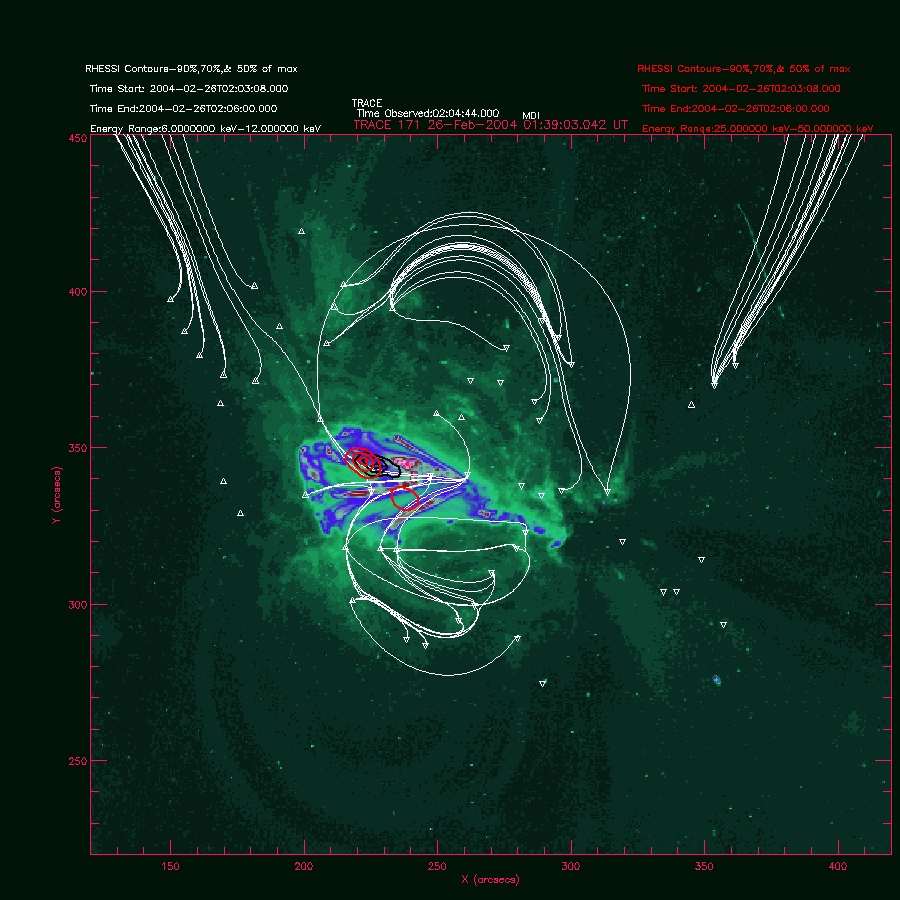
We know the
main source of heating is coming from the top of the loop. If this
flare does not have a SHTC then what other possible explanations can we
find in oder to account for this type of behavior? One idea was
purposed by Dick that reconnection occurred in a very dense region. How
do you find a dense region of the reconnection? Idea: Look at the
cooling times from the temperature average from Detectors 3 and
4.
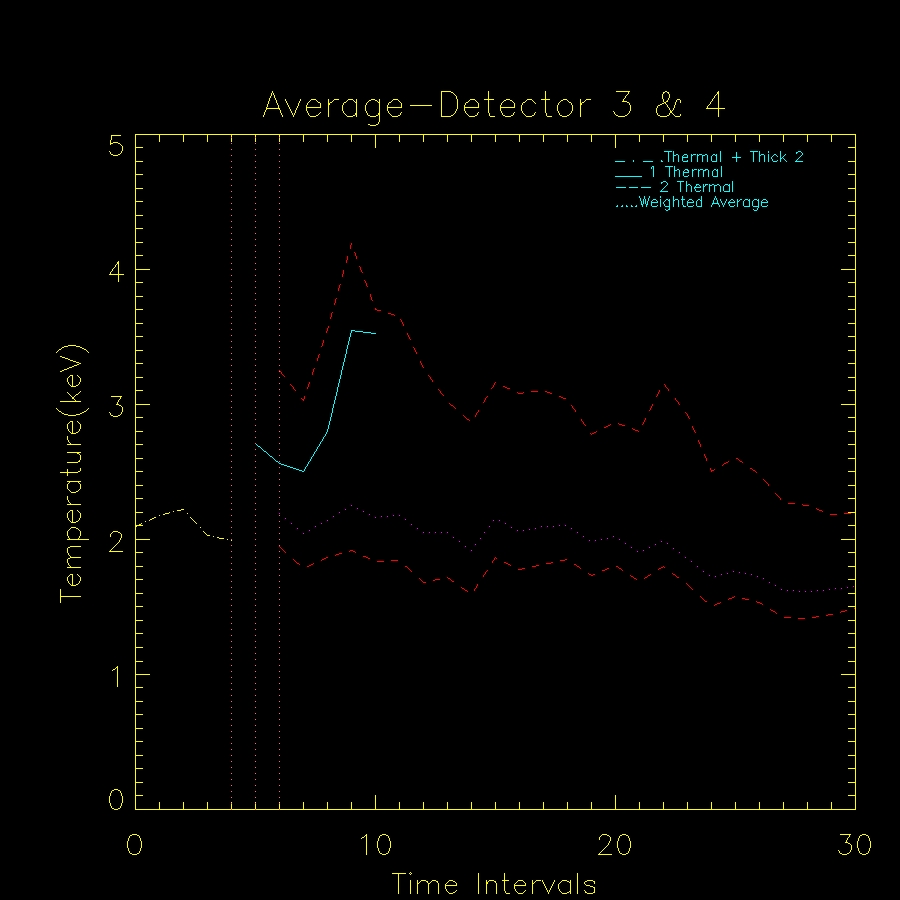
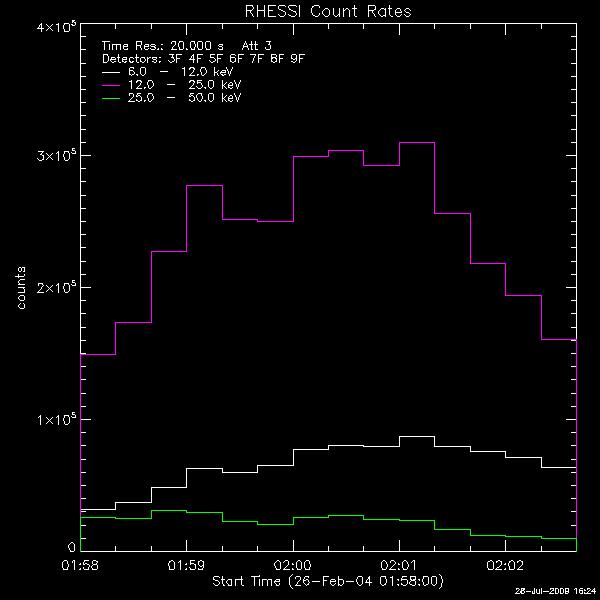
Peaks
occur at time intervals 9,15,22, and 25(not to sure).
Interval 9- 1:58:00- 1:58:20
Interval 15-2:00:00- 2:00:20
Interval 22- 2:02:20- 2:02:40
Interval 25- 2:04:00 - 2:04:20
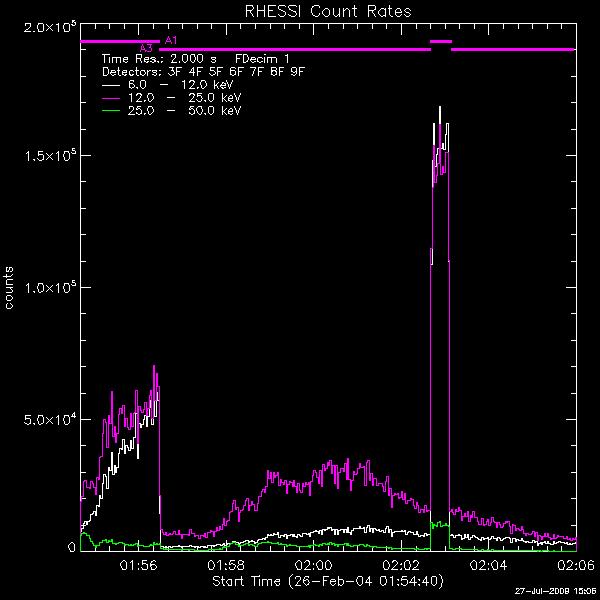
Overall light curve that is associated with these intervals:
July 28,2009
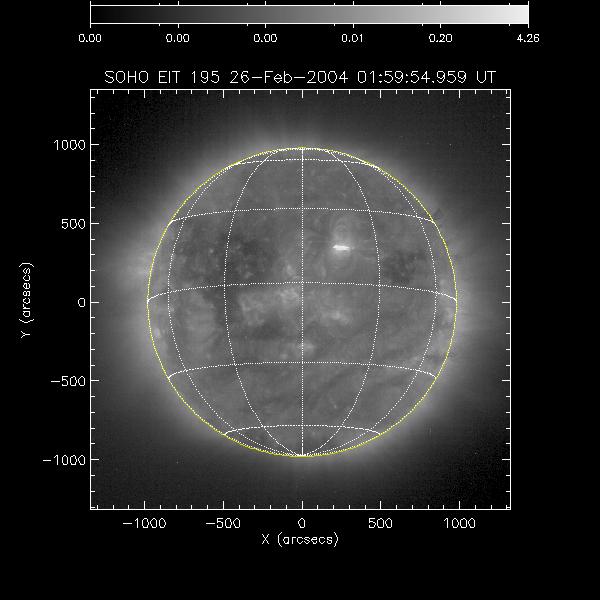
Today I'm looking at my flare's active region.
-Does the active region fit the characteristics of a
X1.1 Flare?
-What are the characteristics of an active region
and how is it classified.
-What are the characteristics of a X1 flare vs a M
flare?
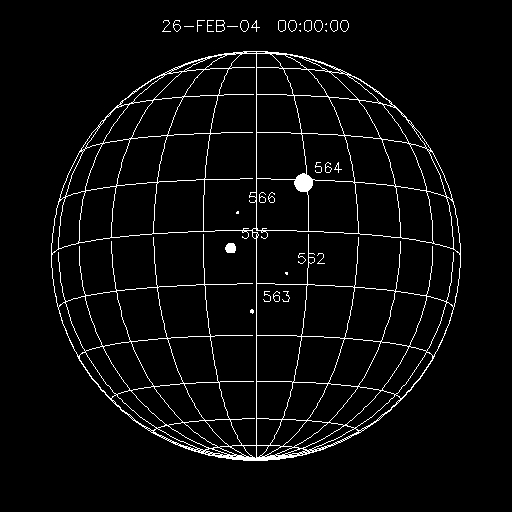
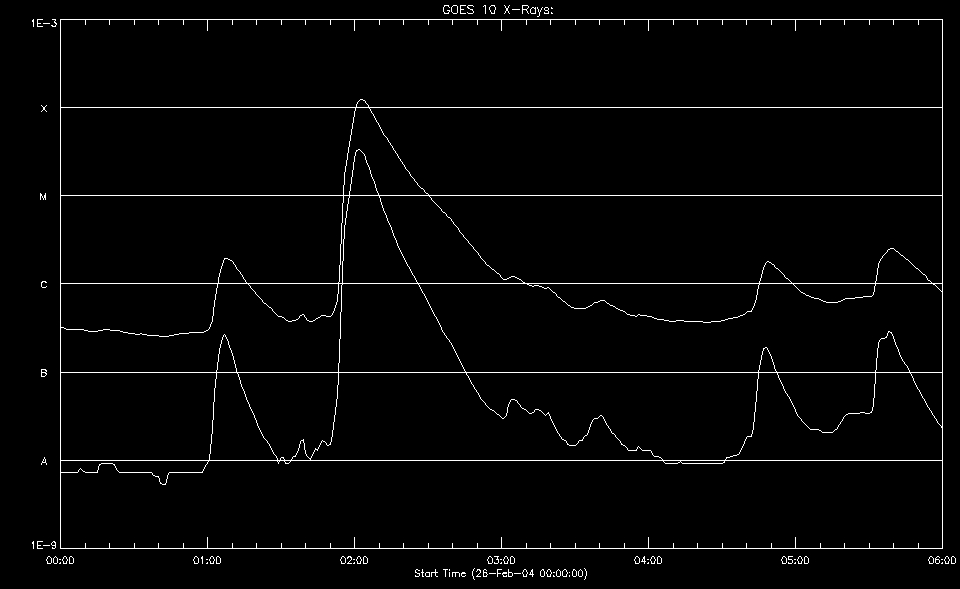
February 26,2004 X1.1 Flare Active Region Stats:
Region
number: 564
Location: N14 W14
Area:
540 microhemispheres (μhs)
Magnetic Type: Beta-Gamma
I read The
Dependence of Large Flare Occurrence on the Magnetic Structure of
Sunspots by Ian Sammis, France Tang, and Harold Zirin to help me
understand active regions of solar flares.
The study
was focused on the largest flare (X1 or greater) in each active region,
the
largest spot area, and the highest magnetic classification. They accumulated 8 years of data
from 1989-1997: 104,475 observations of 2789 regions collected by USAF
Solar Optical Observing Network (SOON) and the Mount Wilson
Observatory.
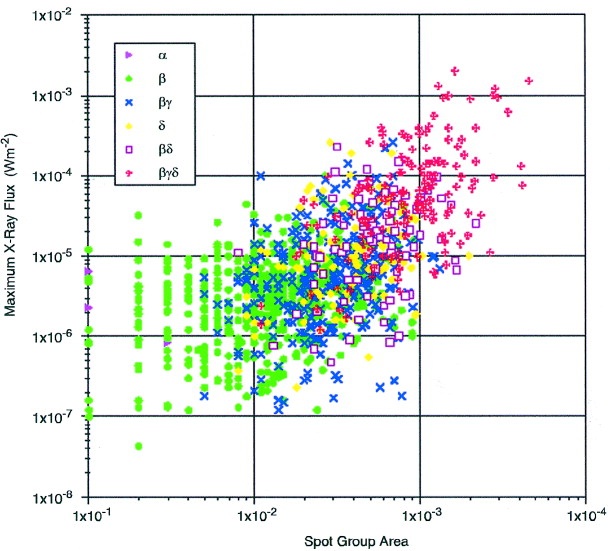
Fig 2.-Peak flare intensities
in W m^-2 each spot as a function of peak in disk fraction, with each
magnetic class plotted
separately.
Clearly all the big events at upper right occur in δ
spots, those classed
βγδ by SOON. Regions producing
no flares have been omitted. (Sammis)
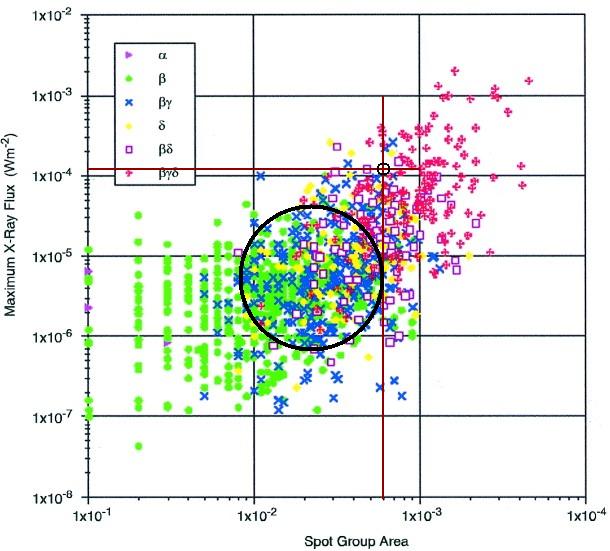
Looking at the same figure but with Feb 26, 2004 X1.1 spot group
area at 540μhs and 1.1
x10^-4 Wm^-2 in the cross hairs. The large black circle is
over the most dense region where other Beta-Gamma type flares occur. As
you can see from the graph there is a small percentage of a flare of
this magnitude occurring in the smaller circle region compared to dense
region of Beta-Gamma enclosed by the larger circle.
July 29, 2009
July 30, 2009
Creating an outline of my presentation using several sources to
help me put all the information together to see the bigger picture:
1. Title Page
2. Brief outline of the discussion
3. General information on flare
4. Why is this flare unique?
-discuss
hypothesis
* From a previous study of this flare it was hypothesized that this
flare exhibited a Super Hot Thermal Component(SHTC).
** Should I give a brief
description of the characteristics of SHTC?
i)Occurs in impulsive flares
ii) temperature decreases while emission increases
iii) SHTC is seen within the lower temperature component
Observations
5.Reuven Ramaty High-Energy Solar Spectroscopic
Imager(RHESSI) ** Information gathered from The RHESSI Imaging Concept
by Hurford,Schmahl,Schwartz....
Purpose: to
gather data of the energy released and particle acceleration in solar
flares
( The output pulse from each photon detected is
amplified,shaped,digitized and passed to the Instrument Data Processing
Unit (PDPU). )
*The
role in detectors and data system- to record the
time and energy of each photon detected, allowing the modulated
count rate to be determined as function of rotation
angle. The detectors and the modulation collimators enable flare
spectra and images to be obtained from both xrays
and gamma rays.
Detectors are high -purity germanium crystals,
divided into front and rear segments
- Front segment- ~1cm thick is
sensitive to 3 keV to ~ 200 keV( X-rays)
-Back segment- ~ 7 cm thick
response to 17 MeV( gamma rays)
*I used front detectors 3-9 for images
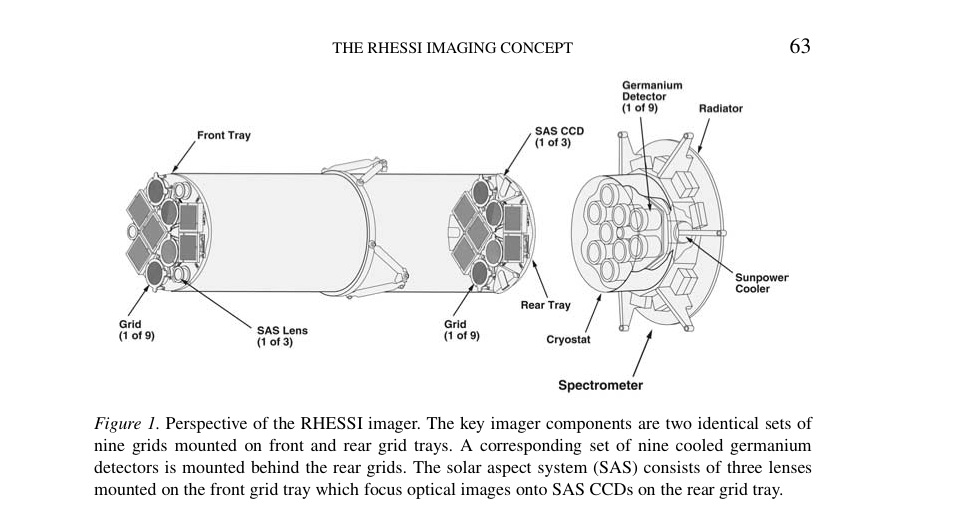
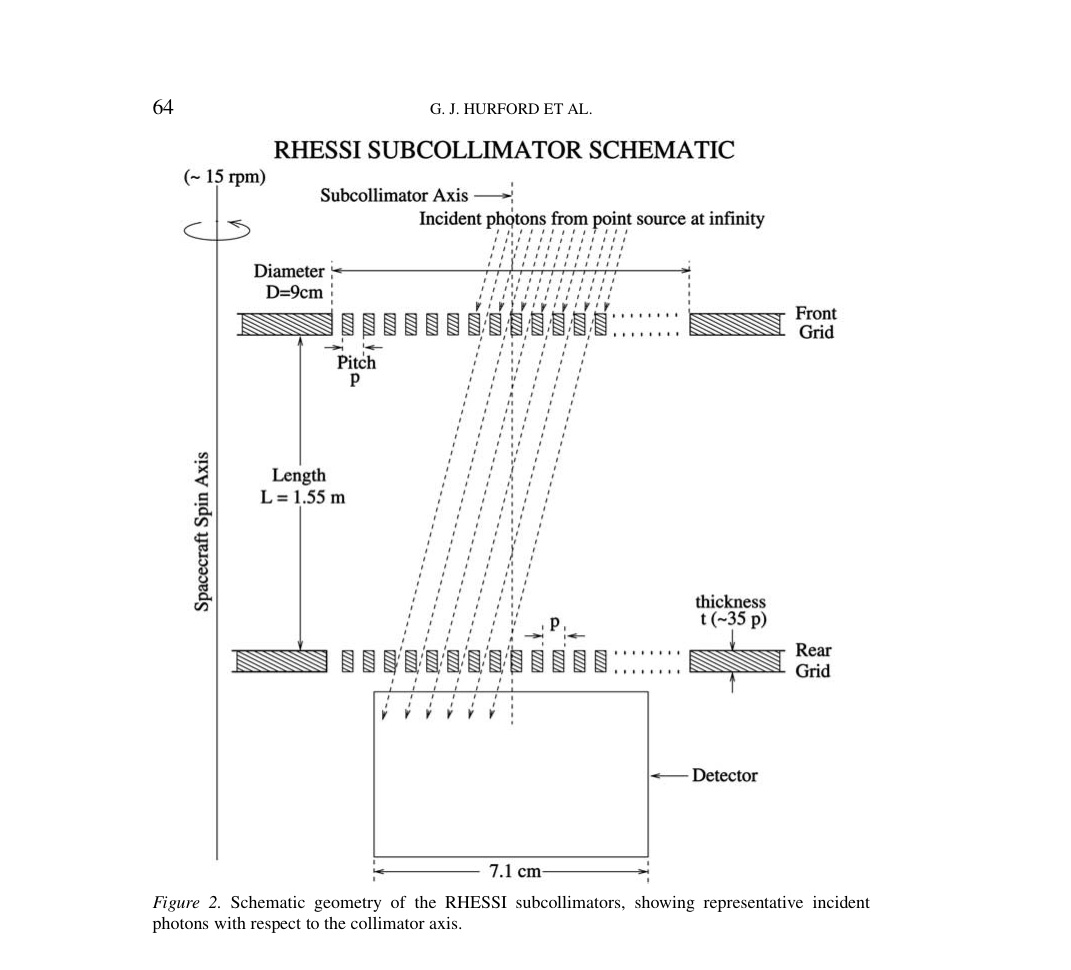
Grids- nine bi-grid subcollimators, each consisting of a pair of
widely separated grids in front of the non imaging
detectors.
- Set of rotating collimators to
time modulate the detection of photon flux
6. Discuss data gathered from RHESSI
Images- Pixon Image from time period 1:54:40 energy range
30 -100 keV: the foot point
**Should I show the overlay of the lower energy
ranges as well?
Pixon image of the peak and the decay(overlay
or just images)
7.)
***Information from The Topology of Magnetic Reconnection in
Solar Flares by Angela Colman Des Jardins
Introduce data collected from
Solar and
Heliospheric/Michelson Doppler Imager (SOHO/MDI): line of sight
magnetograms to
obtain the topology using the Magnetic Charge
Topology (MCT) model.
Describe the MCT model./?
-MCT
model assumes the photospheric field can be divided into
individual unipolar regions.
1) A point source is
located on the poles of the photosphere.
2) Coronal field lines are then placed
in individual sources that are separated by adjacent regions "in which
the
normal component of the magnetic field lines is zero."(Des Jardins)
Each coronal field line is appointed to a flux
domain (- a volume
containg field lines all having the same sources at their end)
according to the poles
3) Nulls are placed at like pole
boundaries with zero magnetic flux
4) Separatrix -a surface lying at the
interface of two domains.
5)The separatrix intersect along separator
field lines. A separator is the location reconnection occurs in the 3-D
MCT coronal model
Images:
Topology with MDI at 00:00:03 and 01:39:03 to see the evolution of the
separators.
-topology with RHESSI contour overlay. ** I think I want
to show all if it together with TRACE
*impulsive
*peak
*decay
OR Describe the MCT Model show the before and during flare
topology and then show images of the TRACE overlay with topology and
then RHESSI contours of 6-12 keV and 25-50 keV overlay. ***killing two
birds with one stone.
Then I should talk a little bit about TRACE./?
8) Spectroscopy
Discuss the
new method to analyze the spectra through the OSPEX GUI.
Show: Spectra Graph
detector 3 and/or 4
* non thermal plus thermal fit (impulsive)
* two-thermal fit peak/decay phase
Show the overall graph of the spectra
information
average of thermal and emission measure
show graph with
temperature in MK
9) Results
RHESSI: Short duration of nonthermal emission causes a short impulsive
phase (image of foot point). From the images we can see we have a high
energy loop top source.
MCT:
Topology shows the separators are not twisted or kinked. Simple coronal
magnetic field
TRACE: Less stress in coronal magnetic field.
the MCT model is aligned with the TRACE data.
Spectroscopy: See similar characteristics as if we did have a SHTC as th
i)Occurs in impulsive flares YES!
ii) temperature decreases while emission increases YES!
iii) SHTC is seen within the lower temperature component-
this is not the case for this flare
The two thermal fit was the best choice compared to the one thermal fit
but the lower temperature didn't exhibit the characteristics needed to
be a SHTC.(Discuss more)
10) Conclusion
Restate Problem: What
makes this flare different?
Due to recent development of new methods on how to analyze
this flare through RHESSI imaging and spectroscopy you can see that it
does not have a SHTC but its a very thermal flare.
Several ideas on why its is different/thermal:
look at the
active region area, peak flare intensity, and magnetic classification.
Area:
540 microhemispheres (μhs)
Magnetic Type: Beta-Gamma
Peak
Flare intensity: 1.1
x10^-4 Wm^-2 (X1.1)
Show the study:
The
Dependence of Large Flare Occurrence on the Magnetic Structure of
Sunspots by Ian Sammis, France Tang, and Harold Zirin
The study
was focused on the largest flare (X1 or greater) in each active region,
the
largest spot area, and the highest magnetic classification. They accumulated 8 years of data
from 1989-1997: 104,475 observations of 2789 regions collected by USAF
Solar Optical Observing Network (SOON) and the Mount Wilson
Observatory.
Show image of the location of my flare on the graph
Looking at the same figure but with Feb 26, 2004 X1.1 spot group
area at 540μhs and 1.1
x10^-4 Wm^-2 in the cross hairs. The large black circle is
over the most dense region where other Beta-Gamma type flares occur. As
you can see from the graph there is a small percentage of a flare of
this magnitude occurring in the smaller circle region compared to the
dense
region of Beta-Gamma enclosed by the larger circle.
FIN!...I
HOPE.
 WEEK
NINE


 WEEK
NINE


