Weeks 5 and 6 were shorter weeks as we had a long weekend for the fourth of July, and we were unable to observe because the moon is not illuminated enough as it is around the New Moon. Instead, we spent a lot of time finishing up our calibrations, which included polarimetric calibrations, radiometric calibrations, and a spectral characterization. At the end of the week 6, I gave my midterm presentation for the department.
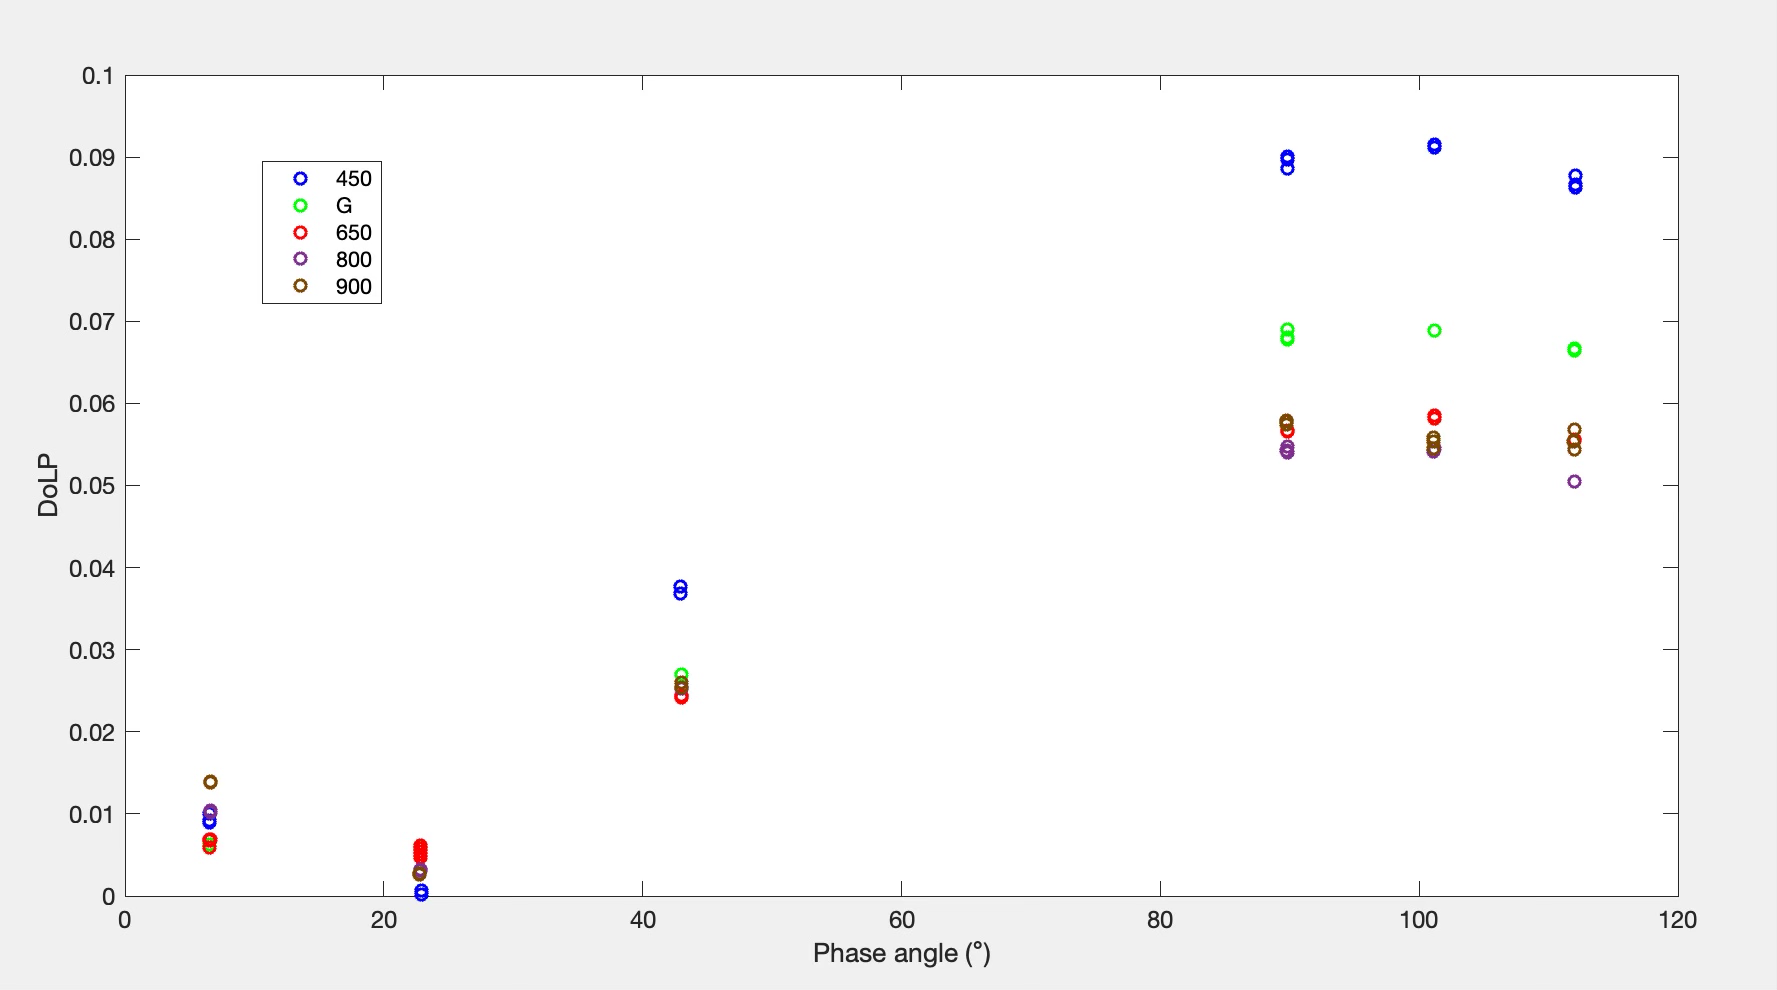
Below is a Preliminary DoLP plot! I used the seven days of observed data to create it. It is a DoLP plot as a function of phase angle. As you can see, DoLP changes as a function of phase angle and creates an S shaped curve. We predicted that as wavelength increases, the DoLP should decrease. As of now, the 450 nm, G (~520nm), and 650 nm filters follow that trend. For the 800 nm and 900 nm filters, there is a lot more noise on the plot, so we might need to observe more and increase the exposure time we are using! Otherwise, I plan to continue adding my processed data to the DoLP plot as well as observing more.

My midterm presentation can be found below!