 |
Documentation > SXT Observation Notes > this page |
Image name: Artifact_timeline.png (click image to enlarge)
Image size: 7.68900 KB (512x768)
Date submitted: 17-dec-1996

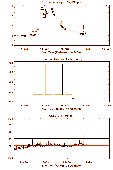
Time variation of the strength of the artifact (upper),  the
approximate exposure time (middle), and the GOES flux (lower).
Sorry, we didn't get the time base exactly right for GOES.
The large exposure times reflect three uses of the JOP057 special
table, with many long Dagwood exposures in the PFI's. For the
ARS2 and ARS1 tables (at the end) the exposure level is hard to
estimate for several reasons, among which is the fact that we
don't get telemetry at all during the BDR overwrite intervals.
However the GOES plot at the bottom shows that there was not much
happening differently at those times.

What to make of this? The long exposures DO NOT coincide with the
build-up times of the artifact! In fact, the initial rise on 12 DEc
seemed to precede any of the deep-exposure tables. It did follow
a sequence of many microflares, however, which could be expected
to have higher temperatures. Is the buildup related to mean photon
energy?

HSH, MW 17-dec-96