 |
Documentation > SXT Observation Notes > this page |
Image name: Be_full_sun_test.png (click image to enlarge)
Image size: 12.1060 KB (1092x512)
Date submitted: 08-Jun-1996

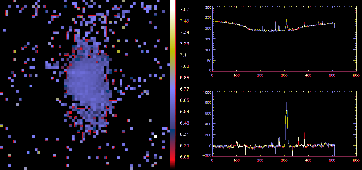
Test full-Sun images in Be for possible application to determining
the pointing flexure in the BCS SXV channel. The plots at the right
show cuts through a weak active region in a Be 30-sec exposure. This
is about the longest we can do! But look how well the software works
to remove this huge stray light contribution (bottom plot)! Amazing!

On the left there's a blown-up T map from a comparison between one
Be image and a Dag image:

 7-JUN-96  17:03:15  QT/H  Open /AlMg  Half Norm C  15   168.0 512x512
 7-JUN-96  17:09:19  QT/H  Open /Be119 Half Norm C  30 30208.0 512x512

The longer Dag exposures were saturated and could not be used. The
T map shows the expected high AR temperatures. The alignment may not
be perfect.

HH 8-Jun-96