 |
Documentation > SXT Observation Notes > this page |
Image name: CCD_CHANGES_II.png (click image to enlarge)
Image size: 417.719 KB (1024x982)
Date submitted: 13-Oct-1996

							LWA, 13-Oct-96

              CHANGES CAUSED BY TIME AND BY CCD BAKEOUT - II


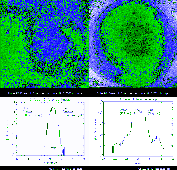
These images are intended to reveal changes in visible light response due
to decontamination of the CCD.  The LH column are made from the following
pre- and post- bakeout exposures.

    3-NOV-93  08:40:52  QT/H  Diffu/Open  Half Norm L   4     2.9  512x512
    3-NOV-93  08:43:00  QT/H  Diffu/Open  Half Norm C   4     2.9  512x512
   10-NOV-93  07:32:35  QT/H  Diffu/Open  Half Norm L   4     2.9  512x512
   10-NOV-93  07:34:43  QT/H  Diffu/Open  Half Norm C   4     2.9  512x512

Note that in this case the histogram of the difference image is very nearly
gaussian with a 0.5% shift towards a higher sensitivity.  The difference
image in the upper left has the color table offset by this 0.5% shift and
shows the changes above (more contamination removed) and below (less
contamination removed) average.  The heavy contour, prepared from a boxcar
smoothed image, traces the contour of average removal.

The Oct-96 bakeout,

    3-OCT-96  05:14:29  QT/H  Diffu/Open  Half Norm C   2     1.0  512x512
    3-OCT-96  05:15:41  QT/H  Diffu/Open  Half Norm L   2     1.0  512x512
   11-OCT-96  23:56:01  QT/H  Diffu/Open  Half Norm C   2     1.0  512x512
   11-OCT-96  23:57:21  QT/H  Diffu/Open  Half Norm L   2     1.0  512x512

shows very little average change.  In the upper right figure the heavy
contour is the locus of zero signal level change.  However, the general
pattern here is for relatively strong signal enhancement in the corners and
a signal _decrease_ in the center of the ccd.  The effect in the corners is
expected but the change in the center of the CCD is puzzling.

In any case, it is clear that the bakeouts still have an effect and should
be continued.