 |
Documentation > SXT Observation Notes > this page |
Image name: Scatter_into_high_corona.png (click image to enlarge)
Image size: 271.881 KB (1024x768)
Date submitted: 29-Dec-1995

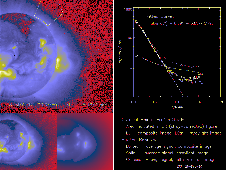
             STUDY OF X-RAY SCATTERING INTO THE HIGH CORONA

In re-analyzing the offpoint data of 8-May-92 I was surprised to recognize a
definite scattering pattern in the west offpoint images in the 15 sec
exposure.  It is centered on the not-so-bright source on the limb.  I
prepared a composite image (lower left) and used it to derive a scatter image
using SXT_SCATTER (lower center).  From these 2 I prepared a difference image
which I vignette corrected with SXT_OFF_AXIS (upper left)

AZIMUTH_AVG was then used to derive the height profiles given in the plot
from the three images.  The scatter correction is certainly non-trivial!

The vignette enhancement runs from about 14% near the limb to 25% at 1.5
R/Rsun.  I only plotted the fully-corrected signal, as +'s, for clarity.

Finally, there is a flat residual signal in the fully-corrected image far
from the sun of about 4 DN/HRpix which appears to be due to a scatter
under-correction.  I believe that this is the source of this residual signal
because the scatter vignette "circle" is an evident feature in this
"background" signal -- in the lower right and upper right corners.  Just for
fun I prepared a scatter image from a vignette-corrected input image to see
if it would remove this residual signal.  This made little difference.  This
test scatter signal is 4 DN higher at the limb, dropping to 1.1 DN at 1.5
R/Rsun.

					L. Acton  12/29/95