 |
Documentation > SXT Observation Notes > this page |
Image name: Third_ent_filt_failure.png (click image to enlarge)
Image size: 4.57300 KB (512x512)
Date submitted: 28-Aug-1996

                                                        28-Aug-96
                                                        L. Acton

            The Third Step-Increase in SXT Visible Straylight

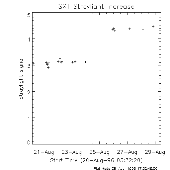
This plot illustrates the approximate 50% increase in SXT straylight
that occurred around 25 August 1996.  It was made from the QR SLD exposures
taken in the standard FFI table.  The data have been processed as follows:

1.  Read the QR  ND/Open, DPE=2 data from the /yd3/temporary directory.

2.  Run dark-sub on these data (note: The MSU SDC data base only goes
    to 96_12 so the dark frames are a bit obsolete).

3.  Throw out 5 images taken after sunset.  (Hmm, these would have been
    good dark frames.)  There are 37 images remaining.

4.  Sum the signal in [*,64:207], the portion of the frames which all
    had data.

5.  Multiply the signals of the 19 "low state" sld's by 2.

6.  Plot the data.

We have clearly lost some more entrance filter.  This calls for the following
actions:

a.  Strong effort should be made to collect baseline terminators for this new
    straylight condition.

b.  Determine the actual time of the failure as accurately as possible.

c.  The "leak sub" software must be updated to select the correct straylight
    correction images -- based upon the time of the failure.