Spectral Analysis for an M2.3 flare on 2014-11-09 observed by IRIS
Moment analysis on the Si IV line
**************************************************************
with stack plots of SJI 1330 and AIA 1600 around the slit position, see here
**************************************************************
from top to bottom, left to right:
SJI 1330 (Y vs X) | Si IV spectra (Y vs lambda) | width (Y vs time; angstrom) | intensity (Y vs time; alog10(DNs)) | line shift (Y vs time; km/s)
2 blue dash-dotted lines: 'peculiar' bands (with relatively large widths)
1 cyan line: evolution of ribbon pixel
4 vertical dotted lines: initial stage (15:22-28 UT), main stage (15:28-32 UT), last stage (15:32-38 UT)
* GOES soft X-ray peak time of the flare: 15:32 UT
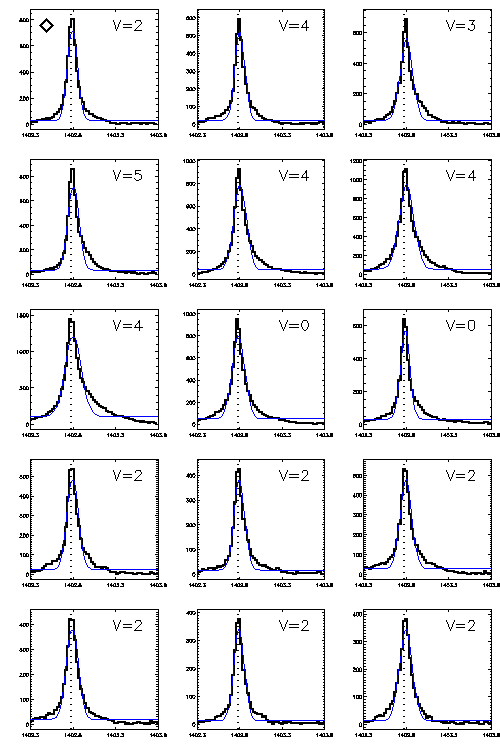
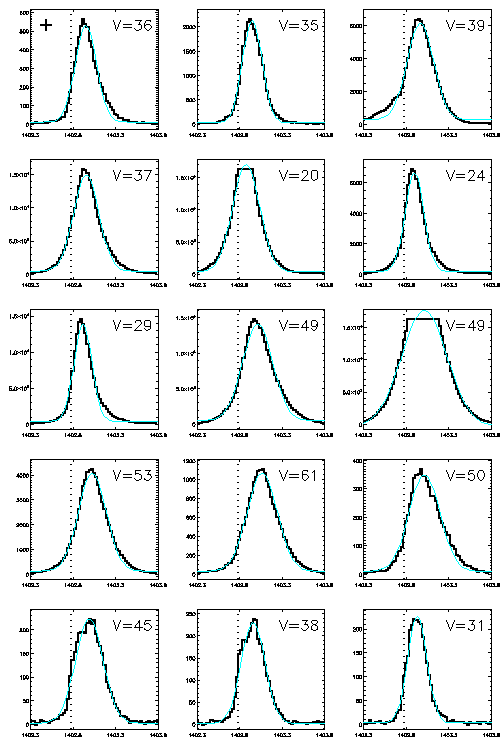
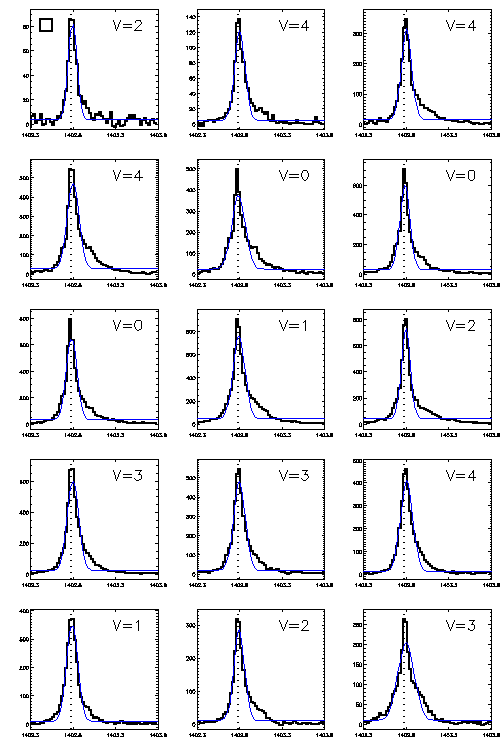
4 symbols: sample line profiles shown below (plus sign: ribbon pixel)
* IRIS slit has some drifts (E-W direction, max: ~2"), see the co-alignment using SJI 2832: click here
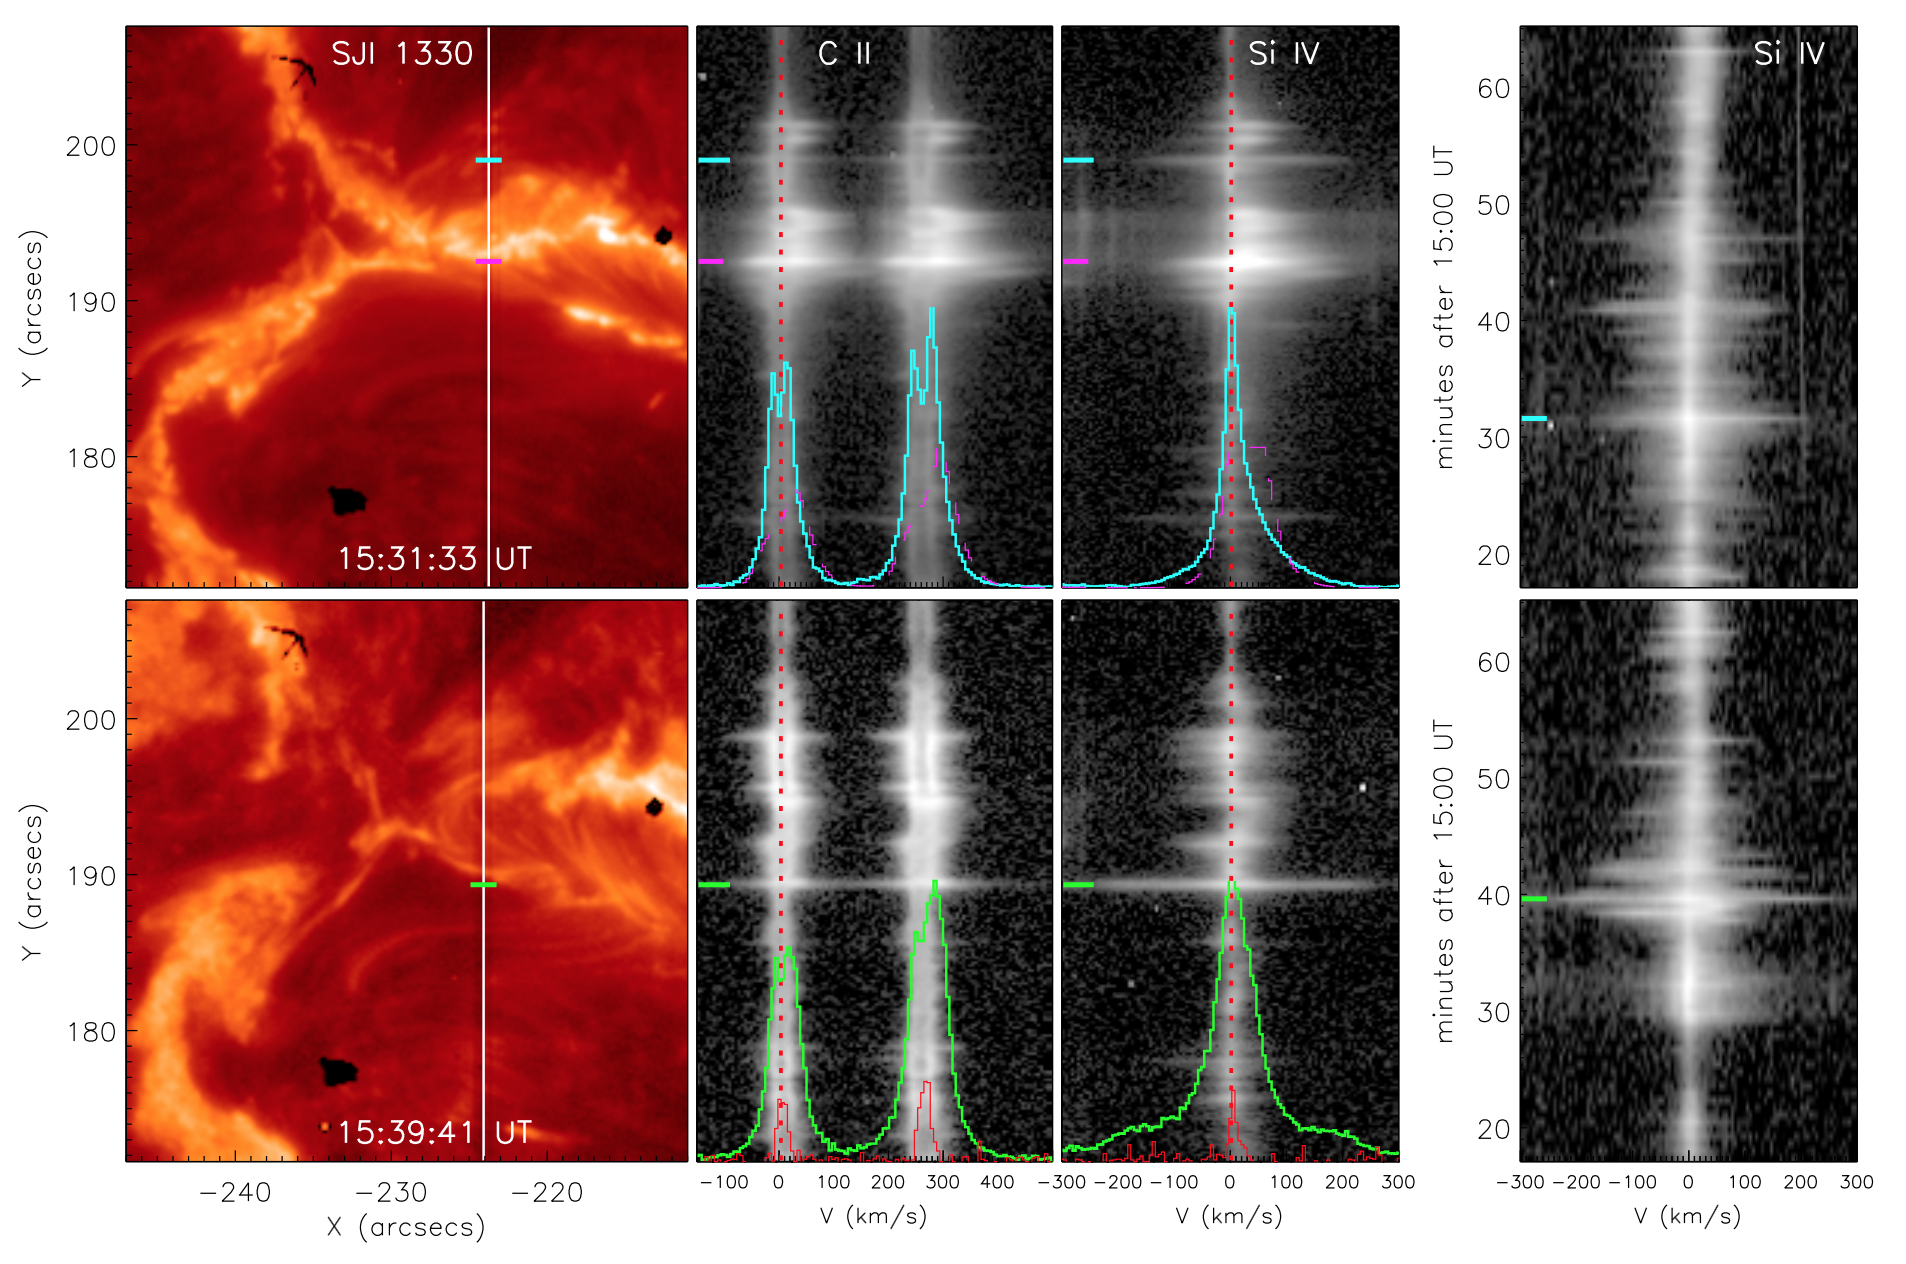
white box: time-space diagram for flare ribbon
|
|
sample line profiles --- w: width (angstrom) | I: intensity (DN) | v: line shift (km/s)

evolution of the Si IV line profiles at diamond/plus/square locations in a time range (main phase: 15:27-36 UT) marked by colored dash-dotted lines in the above movie
colored lines: try single Gaussian fitting --> 1) non-Gaussian or Gaussina shape? 2) just check v (km/s)
* all plots having the same wavelength range


cyan: corresponding to diamond; green: corresponding to square.

