|

|
RHESSI's first big flare - the new and the newer
This will be our third science nugget on the X-class solar flare of 21 April 2002, described in a "A wonderful X-class flare for RHESSI" and "Supra-arcade downflows in the April 21 flare". There is no danger of overkill here, even though this particular flare could not be called unusual - spectacular, yes, but with properties seen in other cases. Here, thanks to SUMER, and others, we are just seeing them much better than before, when Yohkoh was the only player. In addition - guess what! - there is something quite new, of course not predicted theoretically, which we cannot presently explain.
This nugget derives its graphics from a description of the event prepared by P. Gallagher and B. Dennis of NASA's Goddard Space Flight Center, and their co-authored paper now making the rounds as a preprint after submission to Solar Physics. Other research papers are in preparation now, so we may return to this at some future date.
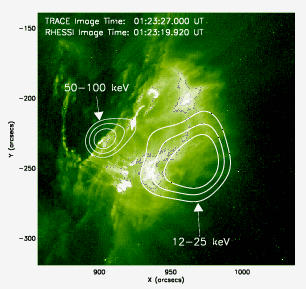
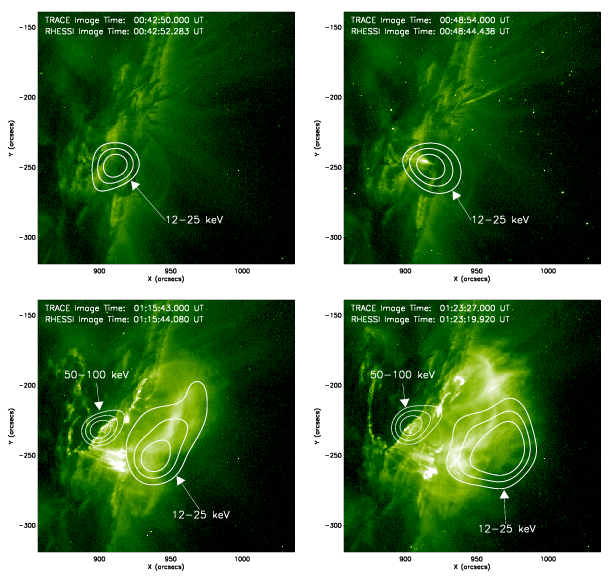
We show some of RHESSI's first interesting images below, following up on the official NASA "first light" press release. On the left below we emphasize the lower right panel of the image on the right, which contains a fuller history and which can be expanded by clicking.

|

|
The two sets of contours show different energies. On the left they are truly hard X-rays, above 50 keV and certainly due to non-thermal bremsstrahlung of weakly relativistic electrons (beta = v/c on the order of 1/2). On the right they are soft X-rays, above 12 keV, and certainly contain emission from very hot gas (at a guess, 25 MK). Note that the hot gas can be seen in the TRACE FeXXIV signature (iron nuclei stripped of all but three electrons), as described (but for FeXXII, with two additional electrons) in the previous nugget.
With this observation we most firmly establish the association of high temperatures with this particular TRACE signature, and indeed with the spiny arcades (check out the nugget search feature) as originally asserted by Z. Svestka et al. in the context of an early Yohkoh observation. In those days (1992) we did not have RHESSI resolution and could not be completely sure about the high temperatures in the fan.
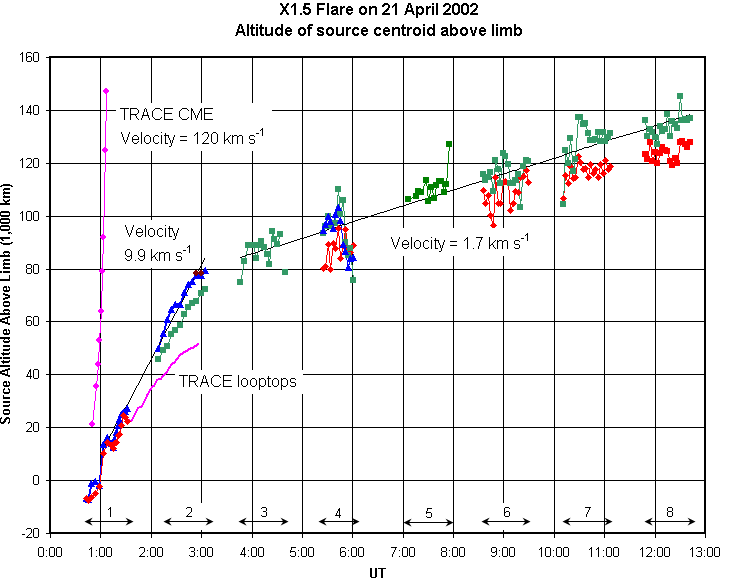
The RHESSI observations also suggest something quite new about the arcade that forms slowly, slowly above the site of the flare. It grows gradually upward, something that we have known about since even before the Skylab X-ray observations; however there is the strong suggstion below of a new kind of growth profile:

This height-vs-time plot covers more than a half day of arcade development. The different colors reflect photon energies - red, 3-6 keV and green, 6-12 keV; their relative positions already reveal the growth of temperature with height as the structure itself appears to grow. This kind of behavior suggests late energy release, here seen long after the flare's impulsive energy release. What is novel here is the appearance of a piecewise linear height-vs-time profile, something most likely not predicted theoretically.
With RHESSI's sytematic observations we will be able to make the older results (hot coronal sources) more quantitative, and to extend the newer results (complicated growth patterns for coronal post-flare structures). We'll find out if this piecewise-linear motion is in fact characteristic, and what the break location means physically. The latter would surely teach us something new about the launching of CMEs (coronal mass ejections), but the reference on the figure above to a "TRACE CME" might want to be taken with a grain of salt - TRACE, wonderful though it is, is not a coronagraph!
August 16, 2002
Hugh Hudson (hhudson@ssl.berkeley.edu), with thanks to Peter Gallagher and Brian Dennis.