 |
Documentation > SXT Observation Notes > this page |
Image name: Periodic_Flare_15May95.png (click image to enlarge)
Image size: 10.9760 KB (1100x400)
Date submitted: 20-May-1995

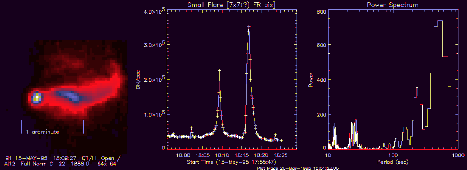
              PERIODIC FLARE (?)

This little flare was observed during the SERTS rocket
flight in the SERTS target region.  SERTS launch was
at 15-May_95 at 18:00 UT.

The light curve is from AlMg.  It is from a 7x10 area
to collect all the signal from saturation on the
brightest peak.  I see 5 distinct peaks in the light
curve and they look to be separated by about 5, 7, 8
and 7 minutes.

The power spectrum of these data gives the strongest peak
at 500 seconds.

Pretty interesting!

                           L. Acton
                           20-May-95