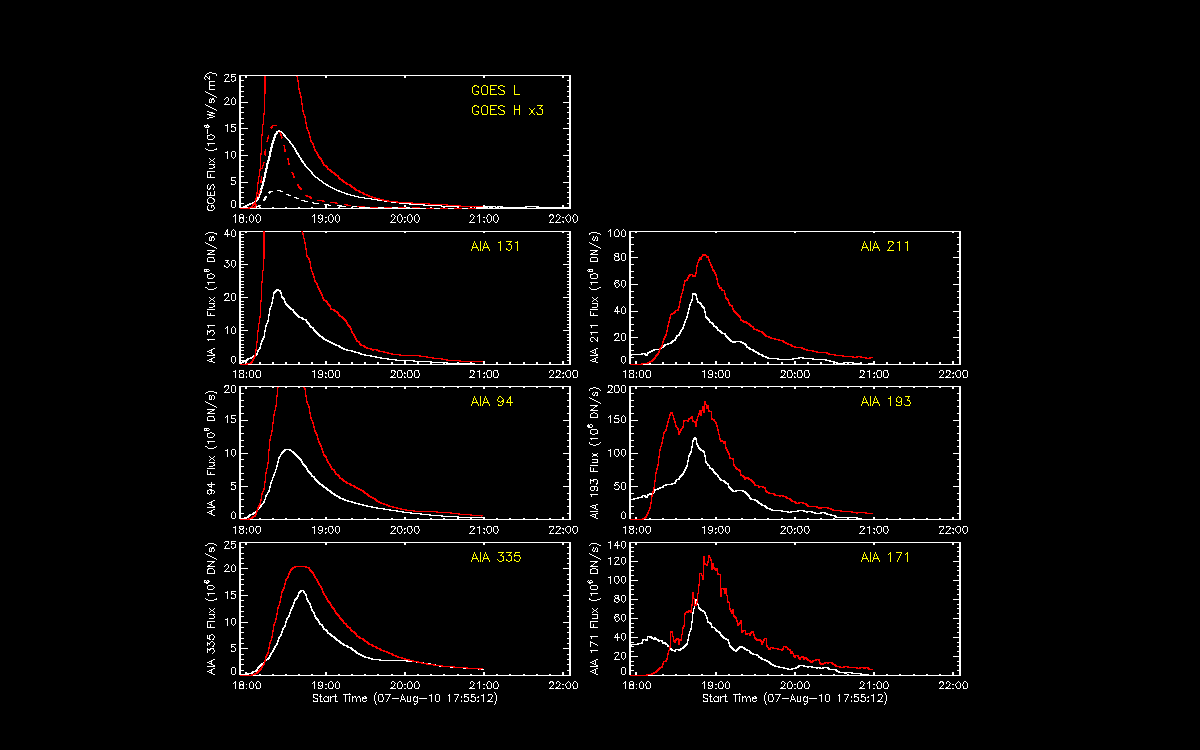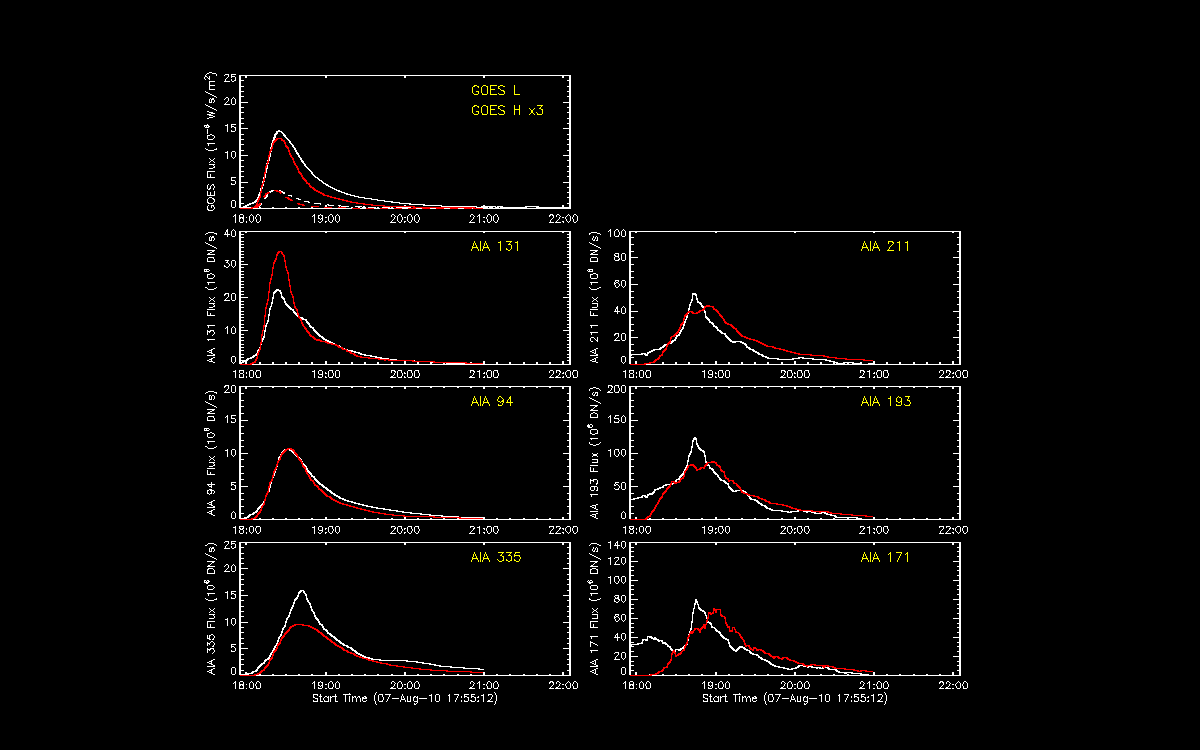

During these two weeks, I focused on one particular flare event Chunming assigned and went through the process of flare energy calculation using that event as an example. Some of the physics were very hard to understand, so I had to bring a lot of questions for the meeting. My main work was just like the first two weeks, running the codes in order while putting comments on them and trying the understand what's going on with my very little experience with IDL. Since there are steps 0, 1, 2a, 2b, 3, 4, 5, and 6, it took a very long time to go through all of them.
Plots below are what I had generated in step 5. They show how similar or not similar synthetic emission curves can be to the original lightcurves depending on the choices of the test values for the three parameters, glambda, scl0, and scl1.
We had our second progress report presentation, and the slides I used in the presentation can be found here.

