(20 May, 2017 by Aki Takeda)
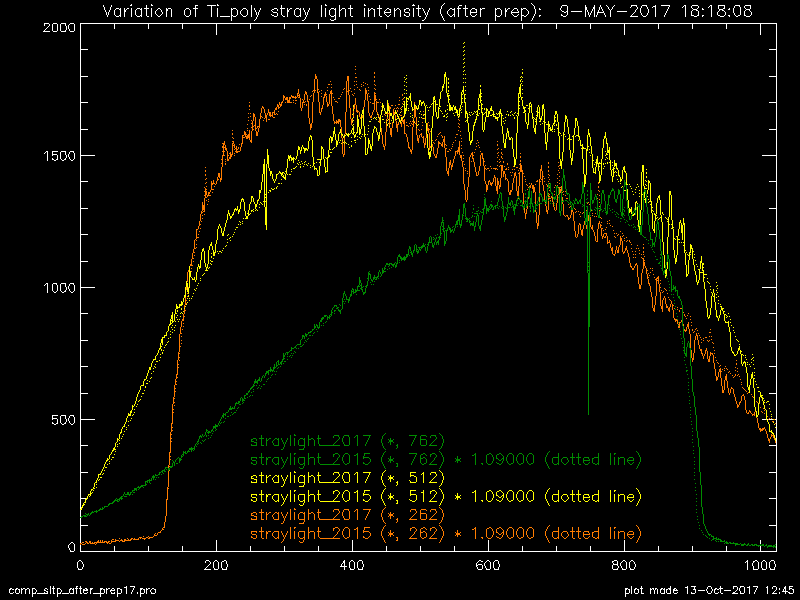
(13 Oct, 2017: After PREP plots corrected using MSU_XRT_PREP.)
(10 Oct, 2020: After PREP plots reprocessed.)
| ID No. | date & time (UT) | XOB | purposes (link: obtained plots & images) | memo |
| 1 | 09-May-2017, 18:11:30 | 1B83 | light curve, Ti-poly (1s) and Al-mesh (2.83s) at DC. | prev. bakeout + 14 days. |
| 2 | 10-May-2017, 18:47:00 | 1B84 | light curve, Al-poly (4s), Thin-Be (11.3s) at DC | prev. bakeout + 15 days. |
| 3 | 11-May-2017, 17:41:30 | 1B85 | light curve, med-Al (32s) at DC | prev. bakeout + 16 days. |
| 4 | 12-May-2017, 18:17:00 | 1B86 | light curve, med-Be (22s) at DC | prev. bakeout + 17 days. |
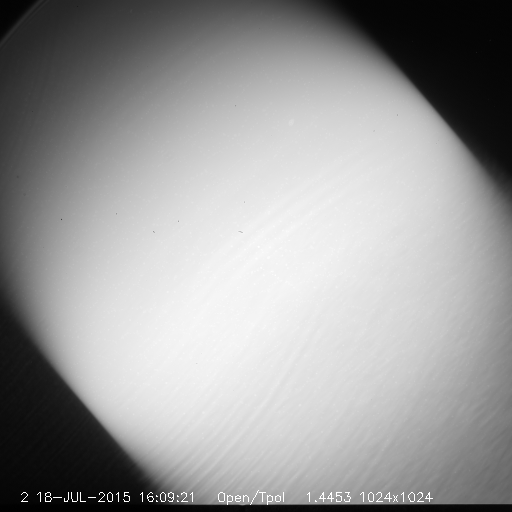
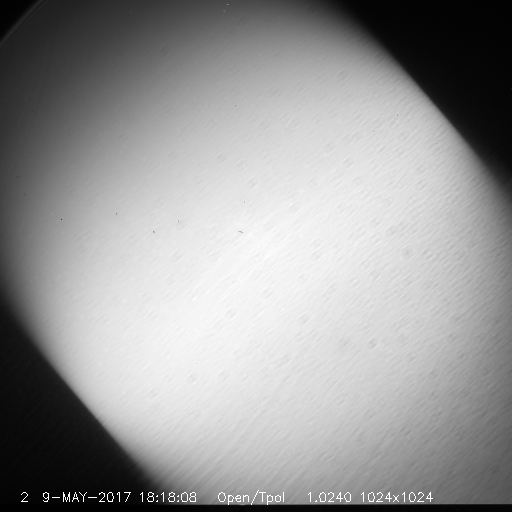
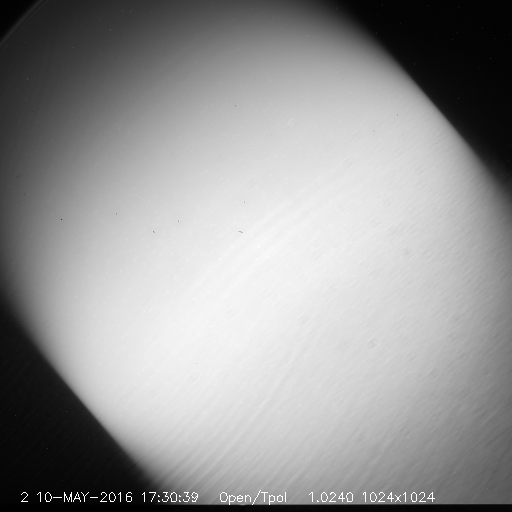
| Ti-poly, 20150718(1.4s) | Ti-poly, 20170509(1.0s) | After PREP comparison | Ti-poly, 20160510(1.0s) |

|

|

|

|
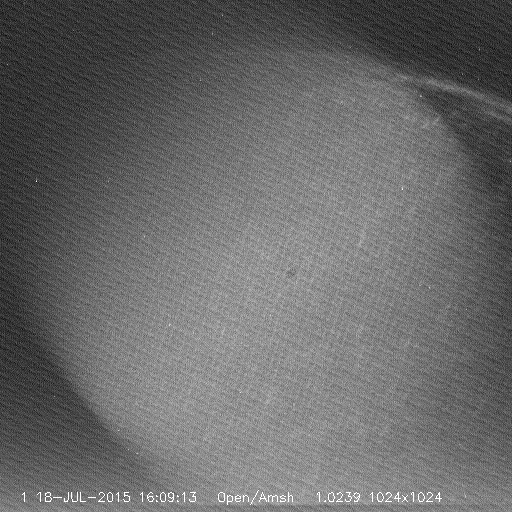
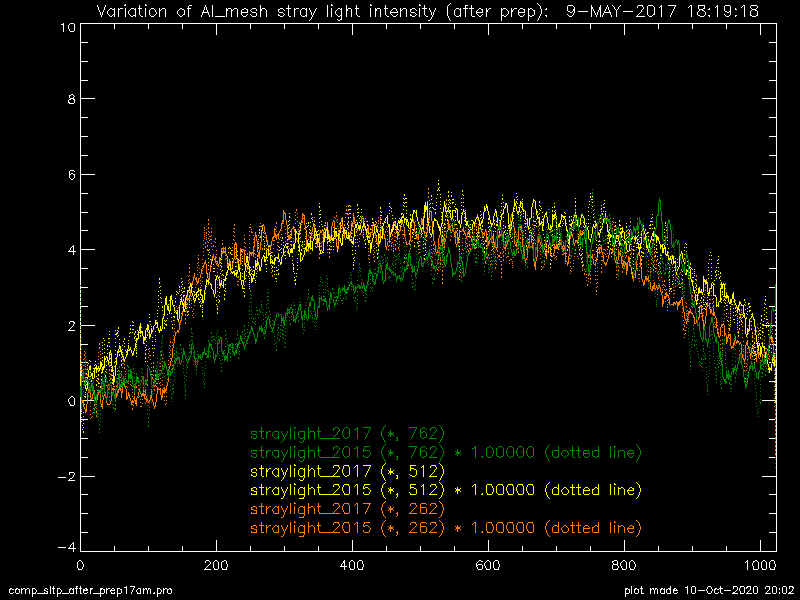
The Al-mesh "After PREP comparison" plot shows that the stray light intensity on 2017/05/09 is 10% smaller than that of 2015/07/18, in spite of the time difference since the previous CCD bakeout (+14 and +2 days, respectively). This suggests that the Al_mesh stray light intensities are affected by other factors than CCD contamination thickness. [old plot]
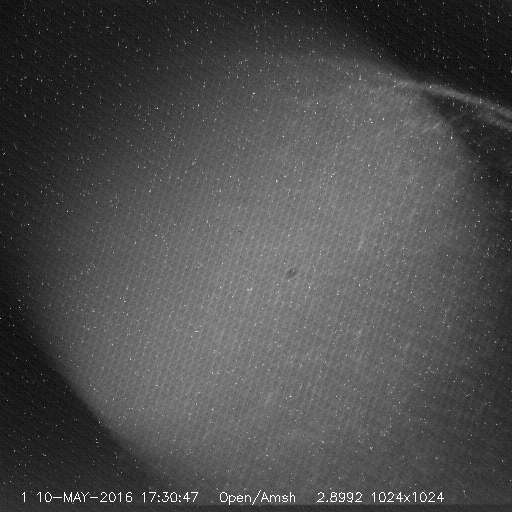
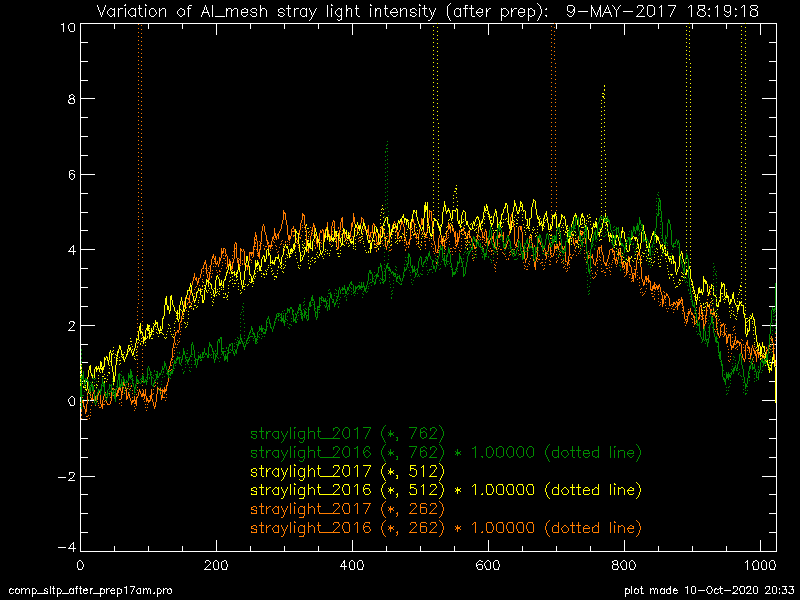
The Al-mesh "After PREP comparison" plot was reprocessed in 2020. The new plot shows that the stray light intensity on 2017/05/09 is the same level as that of 2015/07/18, which is different result from that obtained in 2017. The possible reason is that the data base for calibration (dark, contamination, etc.) was not ready at the time of previous study. It is also confirmed that the 2017 stray light is the same level as that of 2016.
| Al-mesh, 20150718(1.0s) [bd+2d] |
Al-mesh, 20170509(2.8s) [bd+14d] |
After PREP comparison 2017 vs 2015 |
Al-mesh, 20160510(2.8s) [bd+8d] |
After PREP comparison 2017 vs 2016 | |
|

|
|
|
|
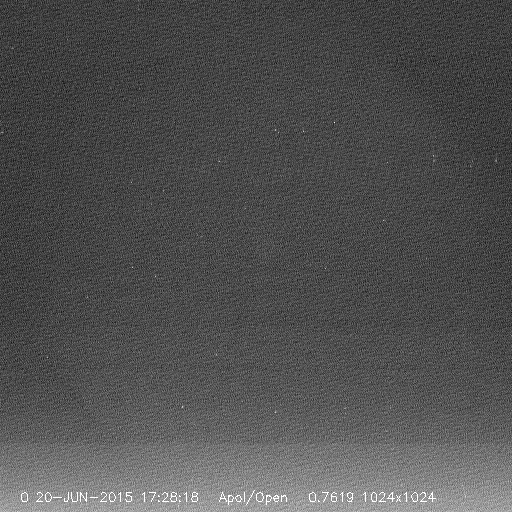
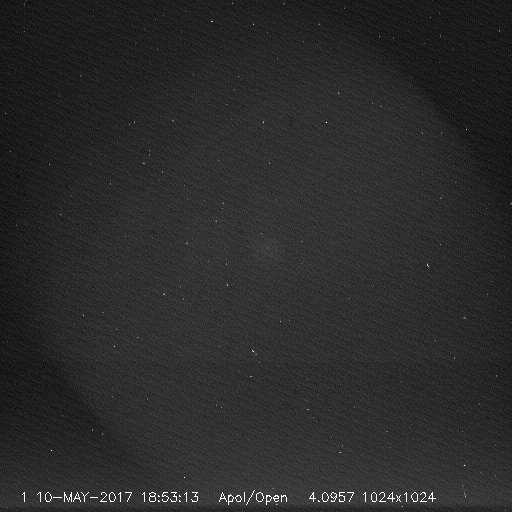
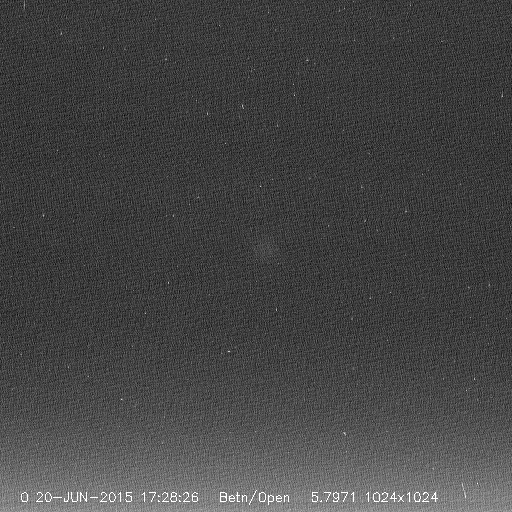
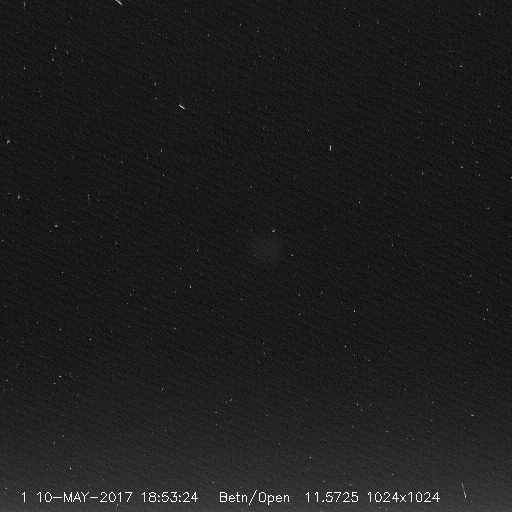
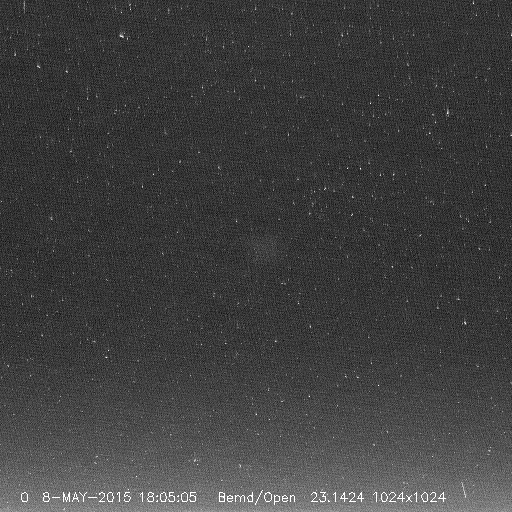
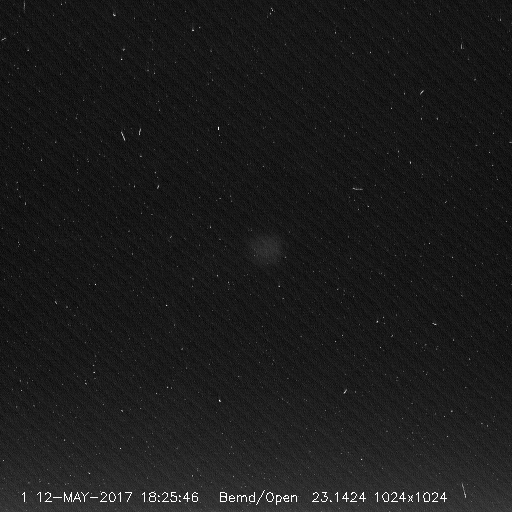
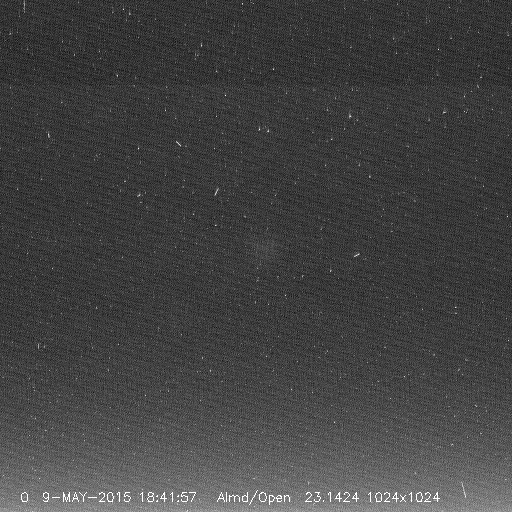
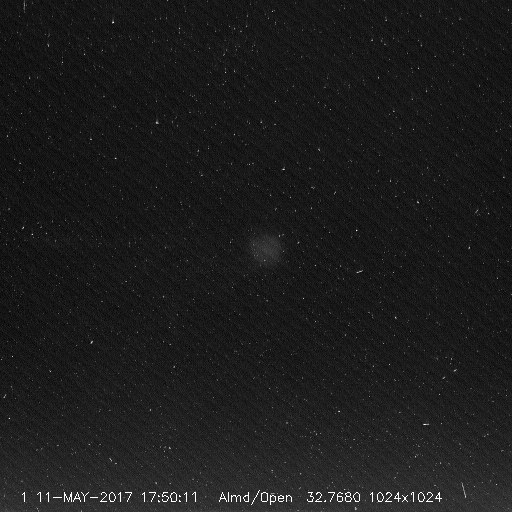
In plots below exposure difference is not corrected yet.
| Al-poly,20150620(0.8s) | Al-poly,20175010(4.1s) |
|
|
| thin-Be,20150620(5.8s) | thin-Be,20170510(11s) |
|
|
| med-Be,20150508(32s) | med-Be,20160513(23s) |
|
|
| med-Al,20150509(23s) | med-Al,20170511(32s) |
|
|