Margot Robinson
Home
Log
Flare List
Presentation
Additional Information
friday, july 23, 2010: Up through the first 20 flares, I now have centroid plots for all of the ones that I could get good images of.
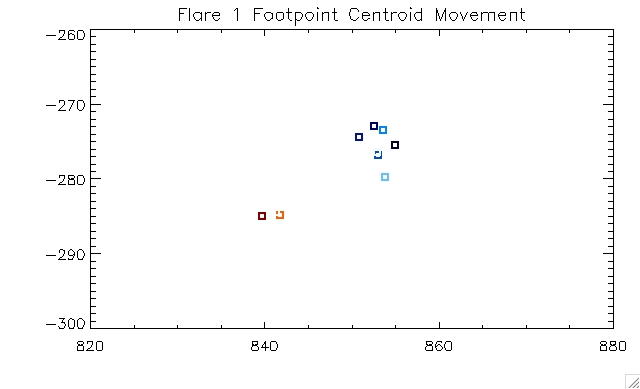
FLARE 1: Not SHH - Max Movement of Left FP: ~2 arcsec (stationary) - Max Movement of Right FP: ~7 arcsec
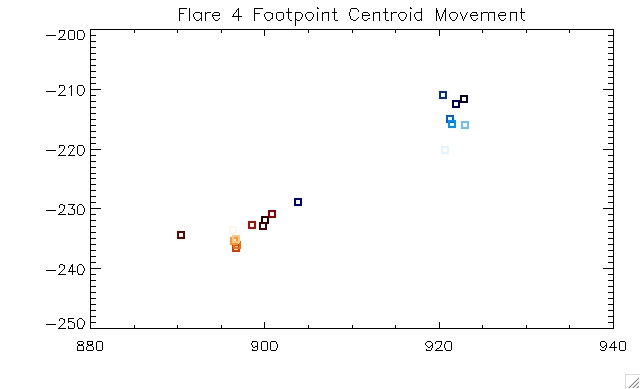
FLARE 4: SHH - Max Movement of Left FP: ~15 arcsec - Max Movement of Right FP: ~10 arcsec
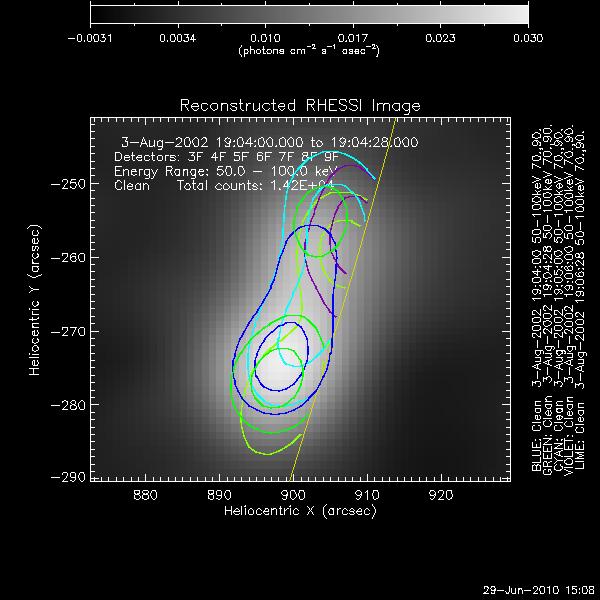
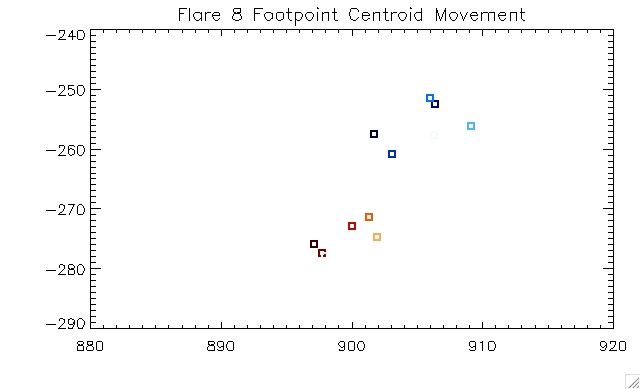
FLARE 8: Not SHH - Max Movement of Left FP: ~7 arcsec - Max Movement of Right FP: ~10 arcsec
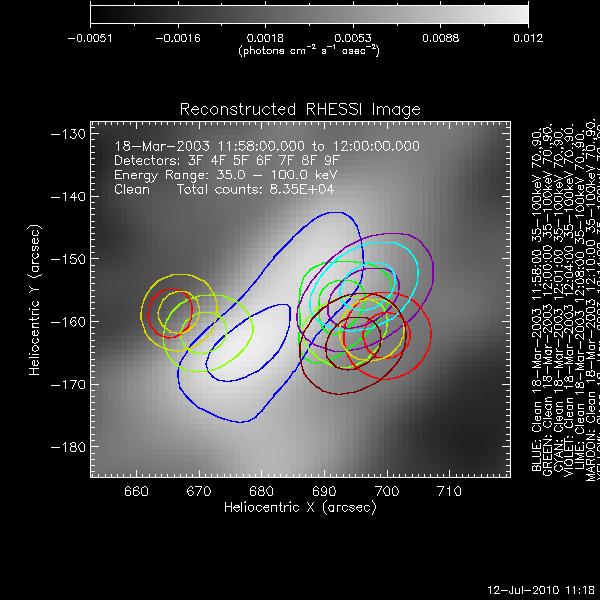
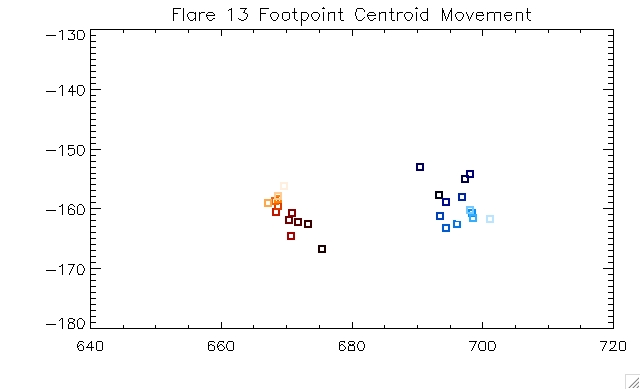
FLARE 13: SHH - Max Movement of Left FP: ~10 arcsec - Max Movement of Right FP: ~12 arcsec
FLARE 19: SHH - Max Movement of Left FP: ~18 arcsec - Max Movement of Right FP: ~30 arcsec
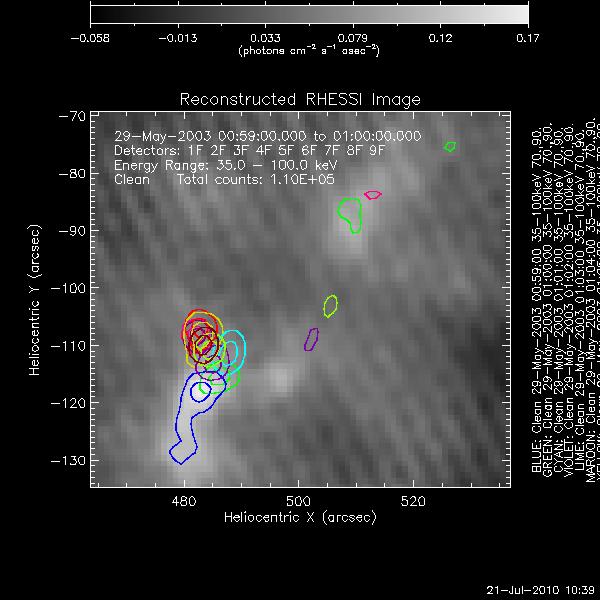

FLARE 20: Not SHH - Max Movement of Left FP: ~2-3 arcsec (stationary) - Max Movement of Left FP: ~4 arcsec (stationary)

Note, my "measurements" of footpoint centroid movements are by-eye estimates, and I'll be redoing these to get exact numbers.
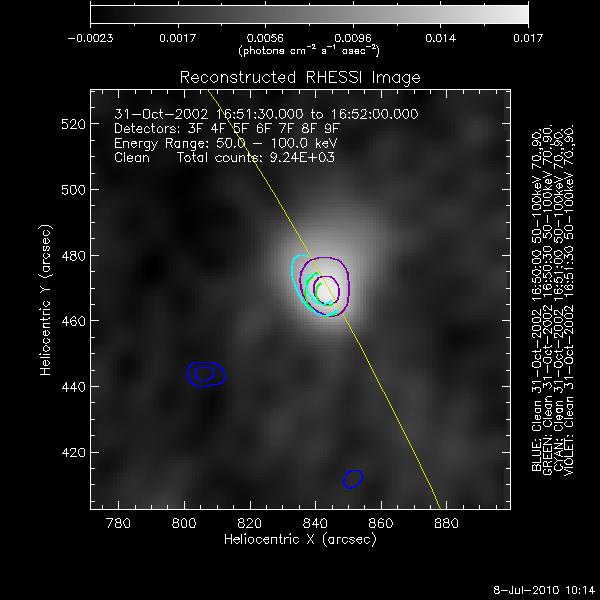
thursday, july 8, 2010: Today I've been trying to make a good image of Flare 11, but I haven't been able to see any footpoints. I think that the problem is that the flare is right on the limb. Here is the best image I got in the 50-100 keV range.
 s
s
wednesday, july 7, 2010:
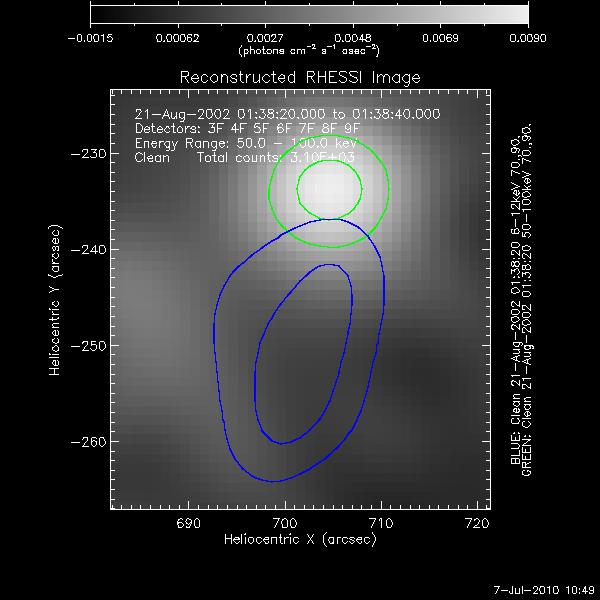
This image is of my first time interval of flare 9 - the contours show a 50-100 keV plot and a 6-12 keV plot. This image confirms that the green at the top of the image is its own footpoint, not simply thermal contamination. I was worried that this was the case because this bright spot appeared only in the first interval, and then mysteriously disappeared.
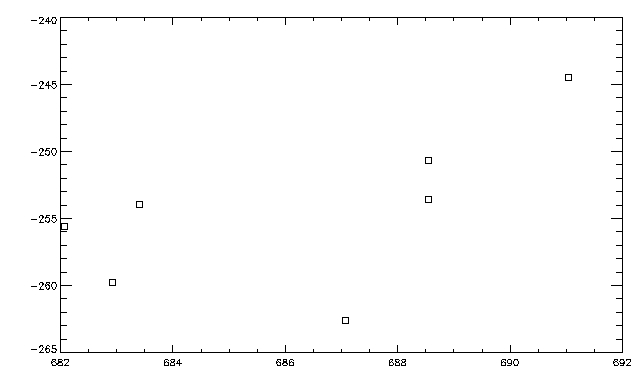
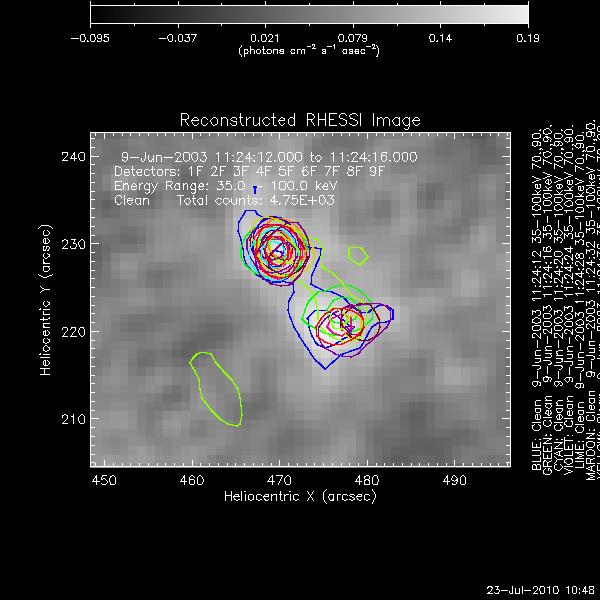
This plot traces the movement of one of flare 9's footpoints. This is ultimately what I want to make for each of the footpoints of each of the flares. As the plot illustrates, the centroid of this footpoint migrates over a range of over 15 arc seconds over the entire interval that I imaged over.
tuesday, july 6, 2010: I have now dropped flare 5,6,7, and 10 from my list. At the end of last week, I got an image of flare 8 and began working on flare 9.

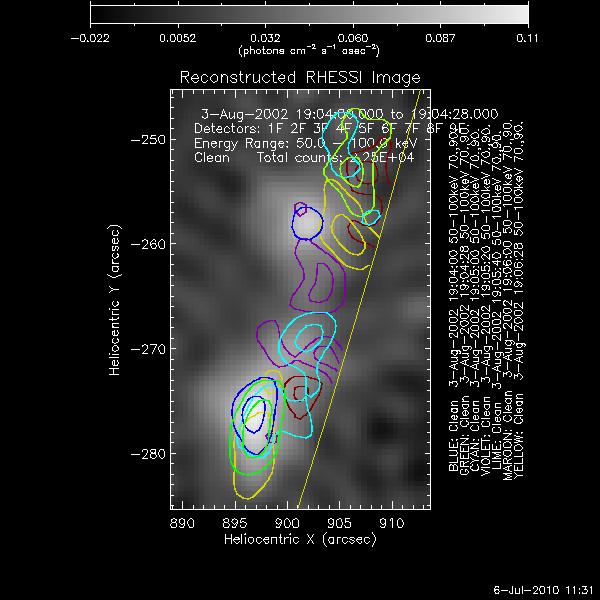
From this image of flare 8, it is clear that the flare has footpoints, but it would be very difficult to determine just how much they move. So, I tried imaging adding detectors 1 and 2 in, and it produced this image. Although there seem to be enough counts, some of the intervals are still not the cleanest looking.
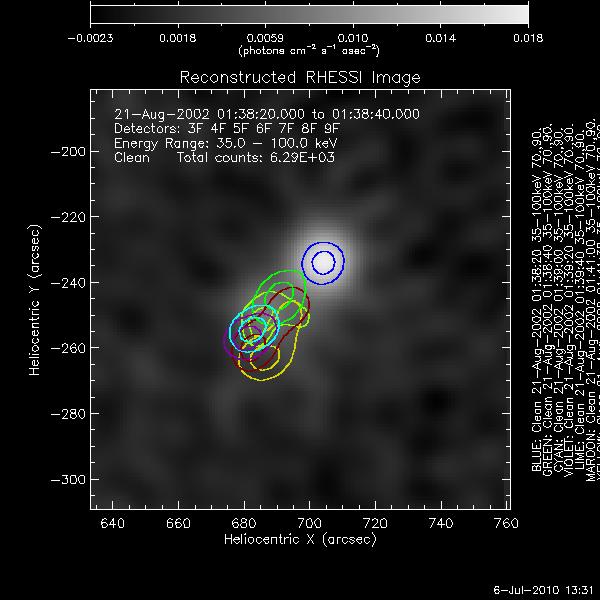
Now, I've made a first image of flare 9, in 35-100 keV (shown below). What I need to do now is break up those final two intervals, which I had made longer because I was afraid that ther didn't have enough counts.
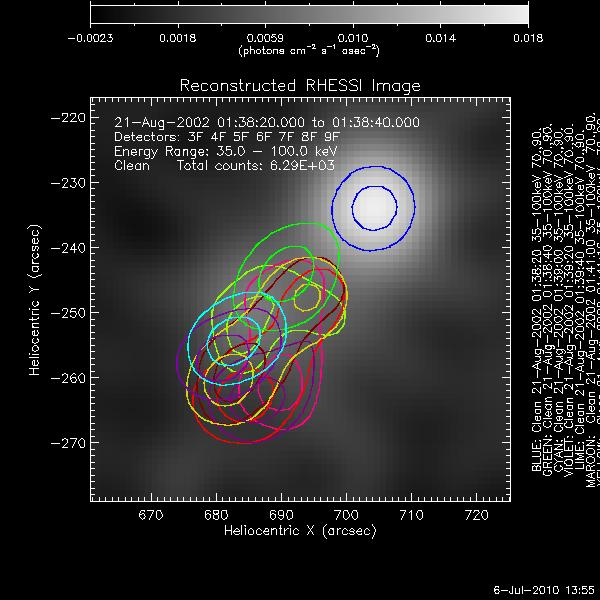
Huh. This may have just made the image more confusing. I divided the final two intervals into 16 second intervals, but it looks like they are still big footpoints. I am fairly certain that I don't have enough counts to image over an even smaller interval. So, either the footpoint is moving really fast at the end there, or it just attains a larger area.
tuesday, june 25, 2010: Since last week, I have concentrated on making lightcurves for the next couple of flares, to avoid having to go back and forth a lot and speed up the process of getting through my list. I struggled a little bit with discerning footpoints in flare 5, and eventually Angela and I decided to scrap that flare from the list of ones we are studying - it must simply be too small to see the footpoints. Here is an image of flare 6, which makes me worried that we may have a similar problem (I've imaged in the highest energy available, 50-100keV).

 This
is an image from the beginning of flare 8 that I've been looking at. I
imaged over a much longer interval but kept on getting garbage out of
the later times. I might now want to go back and try a 35-100 keV image
so that I can have enough counts to break the image up into smaller
time intervals and maybe see clearer footpoint movement.
friday, june 24, 2010:
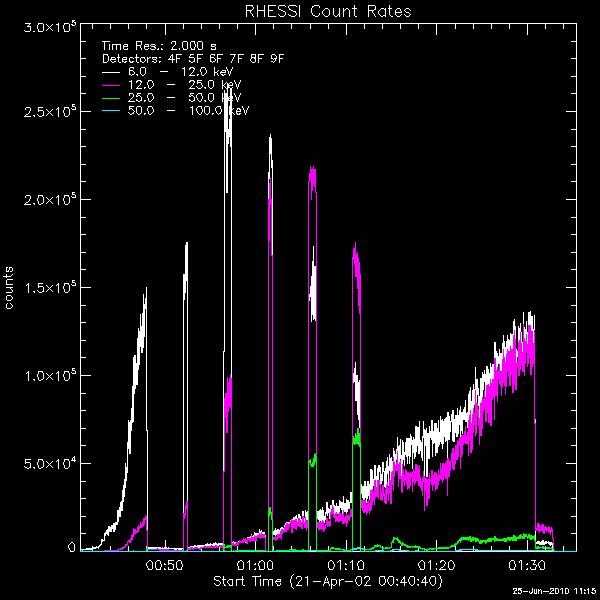 The
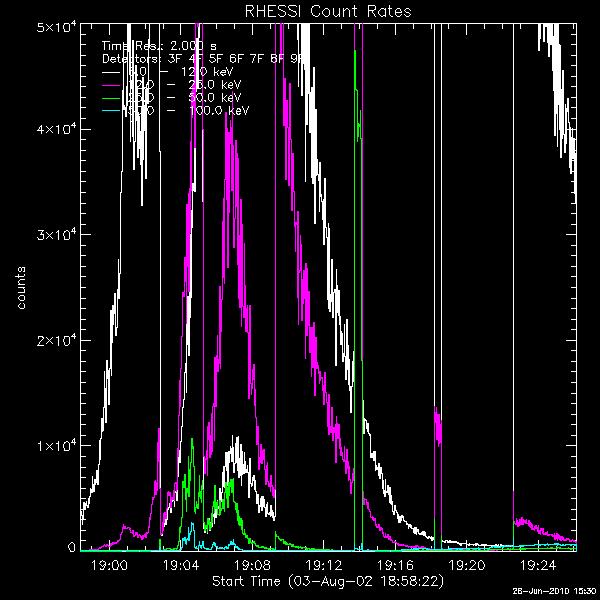
lightcurve for flare #4.
wednesday, june 23, 2010:
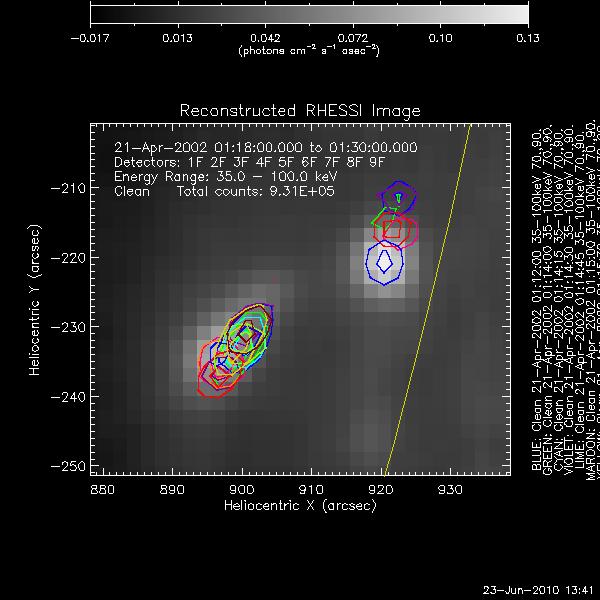 This
is the next image of flare 4 - the footpoints are really clean and easy
to discern here, as I imaged in the 35-100 keV range. I'm just going to
make one more image now of this with a 6-12 keV interval contoured on
top so that we can have a really clear idea of where the thermal part
of the flare is located relative to the nonthermal.
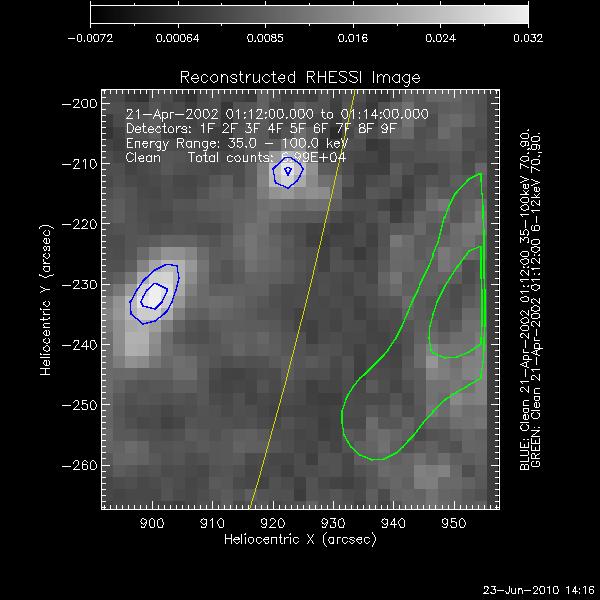
Ok, here I've contoured a 6-12 keV image over a 35-100 keV one. Both are from the same interval -- 01:12:00 to 01:14:00 -- near the beginning of the flare (right after the last attenuator interruption). This should be giving us a pretty clear depiction of the structure of the flare - in terms of general footpoint and top location.
 This is just a redone version of the image
at the top of today. There were too many contours to include all of the
later intervals, but I wanted to redo the earlier, shorter ones and
change them from 15 seconds to 12 seconds, as we get more reliable
images if we use intervals that are divisible by 4 seconds.
tuesday, june 22, 2010:
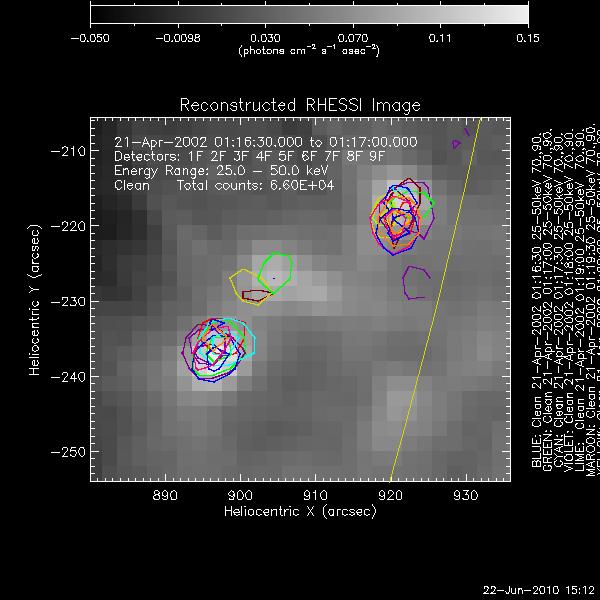
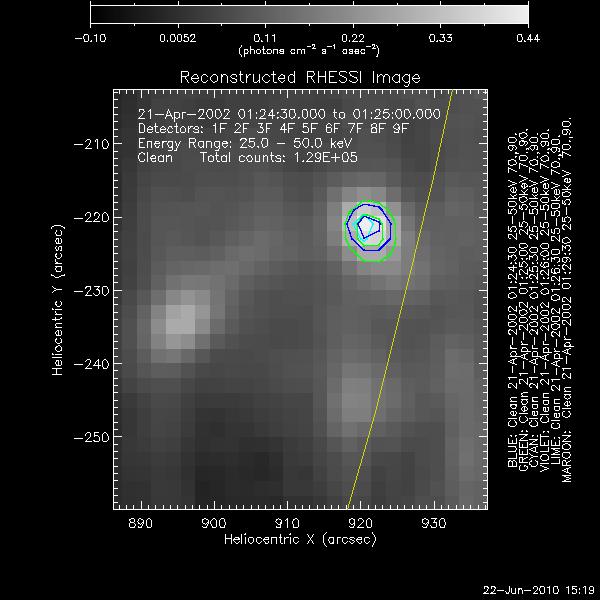
 Latest images
on flare #4. I couldn't contour everything on top of one another
because there were just too many time intervals. So, the three images
to the right are in chronological order. Interestingly, it seems like
the footpoint movement gradually quiets down as the flare progresses.
Angela and I discussed this morning how this stabilization in the
footpoints' locations may corrolate to when the SHH flares begin their
final hardening. I can't confirm this - but it is similar to the guess
I made about the previous flare, which also exhibits SHH behavior.
monday, june 21, 2010:
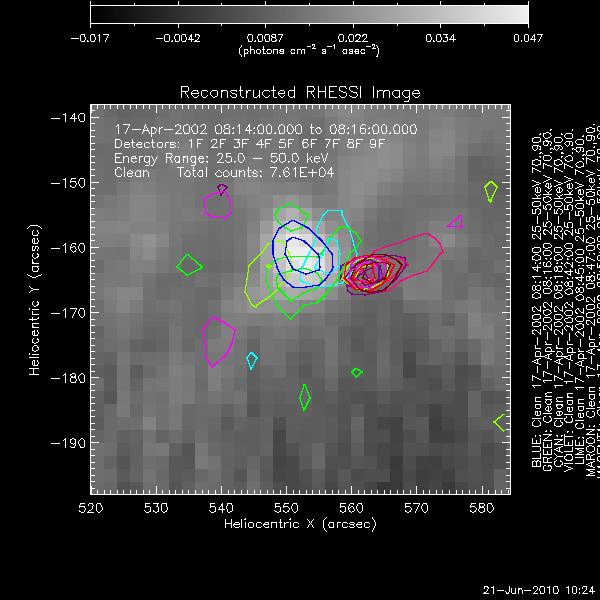 To the right is an
image of Flare #3 (April 17, 2002) with contours. All of the time
intervals shown are in the 25-50 keV range. This flare is interesting
because one footpoint, evident in the later time intervals , is
relatively stationary, while the other (shown in blue, green, and cyan)
migrates around within a range of about 10 arcsec. The yellow interval
seems to be the only time when both footpoints are visible, and this
made me interested in imaging a 6-12 keV together with it. Using these
two together, I may be able to get a clearer picture of where the
thermal part of the flare is located with respect to the nonthermal
footpoints.
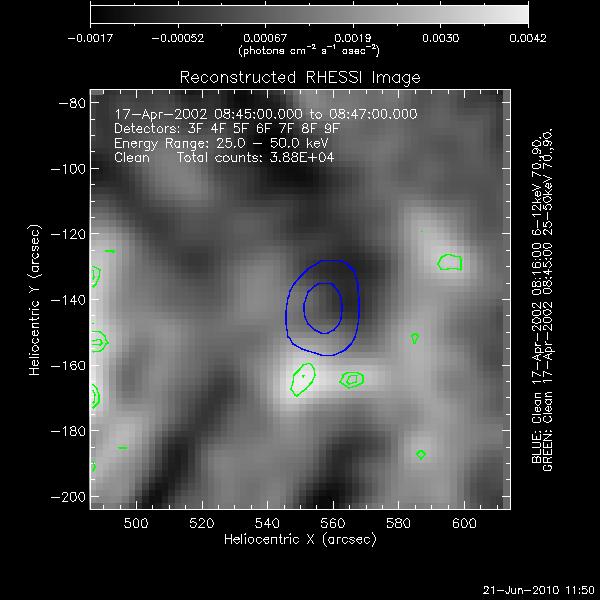 This image is not ideal. I tried adjusting
the detectors (cutting out the first 2 of 9) but still the green
contours (25-50 keV) below the 6-12 keV contours are not the only ones
present in that time range. Still, we can get some idea of the
structure of the flare from this comparison of the thermal and
nonthermal components.
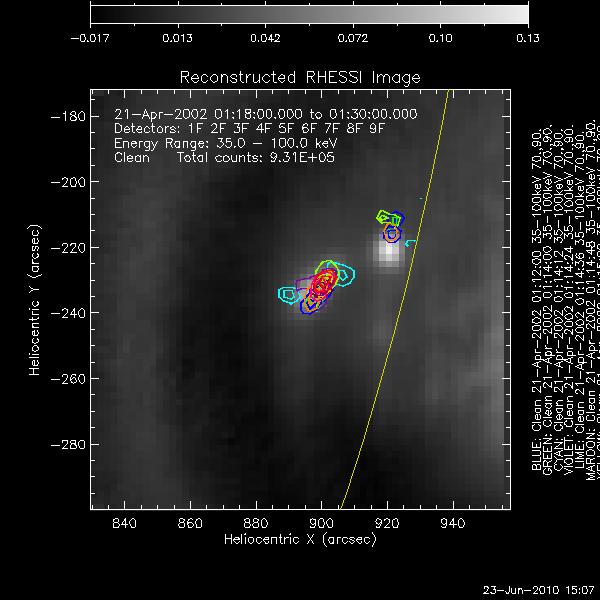
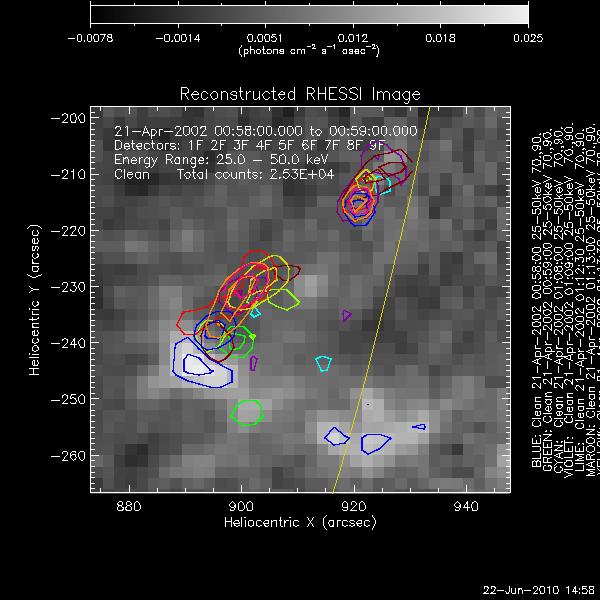
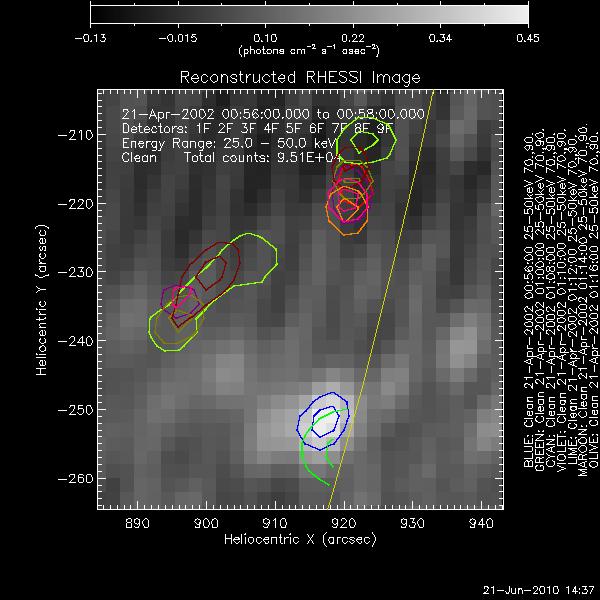 To the right is my first image of the
fourth flare (April 21, 2010). For the later times, it seems like the
footpoints migrate only within a roughly 10 arcsec interval. However,
the earliest 2 time intervals are in a very different place. This makes
me wonder about the location of the lower energy components. So, I'm
going to go back and make a plot of a 6-12 keV interval with some of
these higher energy ones contoured on top.
wednesday, june 16, 2010:
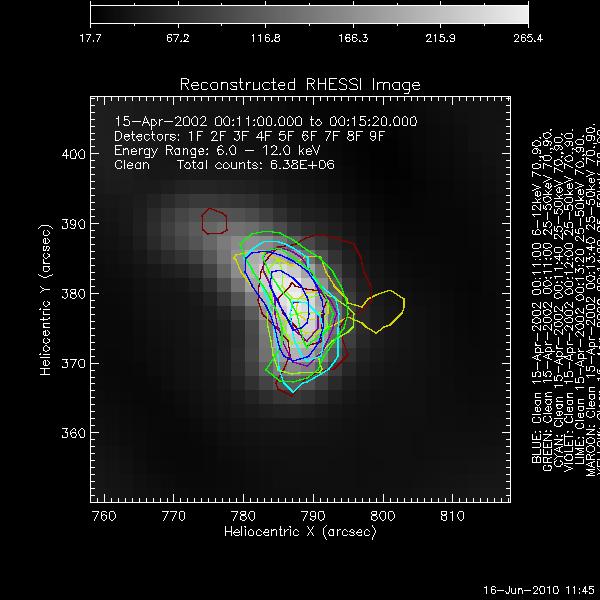 Today, I realized that the contour plot
that I made yesterday was in fact a 12-25keV plot, so I re-plotted the
correct version on the left. It made sense that the previous plot
looked very similar to the 6-12 keV plot, as we can see they are very
similar from the light curve for flare 2.
tuesday, june 15, 2010:
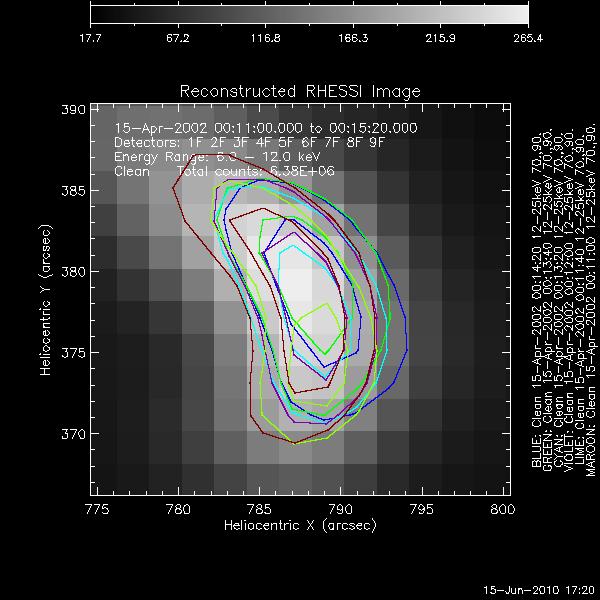 I produced this
image of the second flare that I am studying. The colors, again, encode
the progression in time for the 25-50 keV emission. Their order is:
1)Blue
2) Green
3) Violet
4) Cyan
5) Lime
6) Maroon
These are contoured on top of the 6-12 keV plot for this flare. It seems like the lima-bean shaped contours are expanding with each successive time interval. This would mean that the footpoints are in fact moving away from one another.
monday, june 14, 2010:
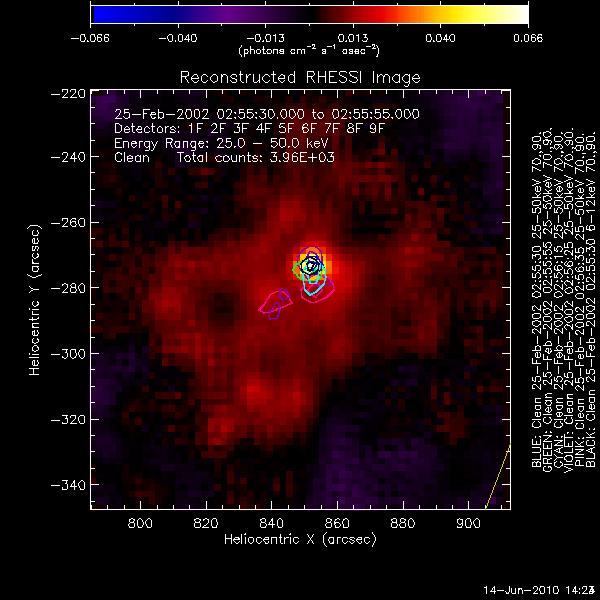
 Today I created this image of the first
solar flare in my list - on February 25, 2002. The colored contours
indicate increasing time intervals. They progess in the following order:
1) Blue - this is simply the contour of the plot that this shown here
2) Green
3) Cyan
4) Violet
5) Pink
Since the last two time intervals (pink and violet) show the flare spreading out to the left, we catagorized this flare as one in which the footpoints are moving. However, this flare does not exhibit SHH behavior, so this conclusion does not bring us closer to investigating the link between SHH behavior and footpoint migration.
friday, july 23, 2010: Up through the first 20 flares, I now have centroid plots for all of the ones that I could get good images of.
FLARE 1: Not SHH - Max Movement of Left FP: ~2 arcsec (stationary) - Max Movement of Right FP: ~7 arcsec


FLARE 4: SHH - Max Movement of Left FP: ~15 arcsec - Max Movement of Right FP: ~10 arcsec


FLARE 8: Not SHH - Max Movement of Left FP: ~7 arcsec - Max Movement of Right FP: ~10 arcsec


FLARE 13: SHH - Max Movement of Left FP: ~10 arcsec - Max Movement of Right FP: ~12 arcsec


FLARE 19: SHH - Max Movement of Left FP: ~18 arcsec - Max Movement of Right FP: ~30 arcsec


FLARE 20: Not SHH - Max Movement of Left FP: ~2-3 arcsec (stationary) - Max Movement of Left FP: ~4 arcsec (stationary)


| Flare |
SHH |
Left FP (arcsec) |
Right FP (arcsec) |
| 1 |
No |
2 |
7 |
| 4 |
Yes |
15 |
10 |
| 8 |
No |
7 |
10 |
| 13 |
Yes |
10 |
12 |
| 19 |
Yes |
18 |
30 |
| 20 |
No |
2-3 |
4 |
Note, my "measurements" of footpoint centroid movements are by-eye estimates, and I'll be redoing these to get exact numbers.
thursday, july 8, 2010: Today I've been trying to make a good image of Flare 11, but I haven't been able to see any footpoints. I think that the problem is that the flare is right on the limb. Here is the best image I got in the 50-100 keV range.
 s
swednesday, july 7, 2010:

This image is of my first time interval of flare 9 - the contours show a 50-100 keV plot and a 6-12 keV plot. This image confirms that the green at the top of the image is its own footpoint, not simply thermal contamination. I was worried that this was the case because this bright spot appeared only in the first interval, and then mysteriously disappeared.

This plot traces the movement of one of flare 9's footpoints. This is ultimately what I want to make for each of the footpoints of each of the flares. As the plot illustrates, the centroid of this footpoint migrates over a range of over 15 arc seconds over the entire interval that I imaged over.
tuesday, july 6, 2010: I have now dropped flare 5,6,7, and 10 from my list. At the end of last week, I got an image of flare 8 and began working on flare 9.


From this image of flare 8, it is clear that the flare has footpoints, but it would be very difficult to determine just how much they move. So, I tried imaging adding detectors 1 and 2 in, and it produced this image. Although there seem to be enough counts, some of the intervals are still not the cleanest looking.

Now, I've made a first image of flare 9, in 35-100 keV (shown below). What I need to do now is break up those final two intervals, which I had made longer because I was afraid that ther didn't have enough counts.


Huh. This may have just made the image more confusing. I divided the final two intervals into 16 second intervals, but it looks like they are still big footpoints. I am fairly certain that I don't have enough counts to image over an even smaller interval. So, either the footpoint is moving really fast at the end there, or it just attains a larger area.
tuesday, june 25, 2010: Since last week, I have concentrated on making lightcurves for the next couple of flares, to avoid having to go back and forth a lot and speed up the process of getting through my list. I struggled a little bit with discerning footpoints in flare 5, and eventually Angela and I decided to scrap that flare from the list of ones we are studying - it must simply be too small to see the footpoints. Here is an image of flare 6, which makes me worried that we may have a similar problem (I've imaged in the highest energy available, 50-100keV).

 This
is an image from the beginning of flare 8 that I've been looking at. I
imaged over a much longer interval but kept on getting garbage out of
the later times. I might now want to go back and try a 35-100 keV image
so that I can have enough counts to break the image up into smaller
time intervals and maybe see clearer footpoint movement.
This
is an image from the beginning of flare 8 that I've been looking at. I
imaged over a much longer interval but kept on getting garbage out of
the later times. I might now want to go back and try a 35-100 keV image
so that I can have enough counts to break the image up into smaller
time intervals and maybe see clearer footpoint movement.friday, june 24, 2010:
 The
lightcurve for flare #4.
The
lightcurve for flare #4.wednesday, june 23, 2010:
 This
is the next image of flare 4 - the footpoints are really clean and easy
to discern here, as I imaged in the 35-100 keV range. I'm just going to
make one more image now of this with a 6-12 keV interval contoured on
top so that we can have a really clear idea of where the thermal part
of the flare is located relative to the nonthermal.
Ok, here I've contoured a 6-12 keV image over a 35-100 keV one. Both are from the same interval -- 01:12:00 to 01:14:00 -- near the beginning of the flare (right after the last attenuator interruption). This should be giving us a pretty clear depiction of the structure of the flare - in terms of general footpoint and top location.
 This is just a redone version of the image
at the top of today. There were too many contours to include all of the
later intervals, but I wanted to redo the earlier, shorter ones and
change them from 15 seconds to 12 seconds, as we get more reliable
images if we use intervals that are divisible by 4 seconds.
This is just a redone version of the image
at the top of today. There were too many contours to include all of the
later intervals, but I wanted to redo the earlier, shorter ones and
change them from 15 seconds to 12 seconds, as we get more reliable
images if we use intervals that are divisible by 4 seconds.tuesday, june 22, 2010:
 Latest images
on flare #4. I couldn't contour everything on top of one another
because there were just too many time intervals. So, the three images
to the right are in chronological order. Interestingly, it seems like
the footpoint movement gradually quiets down as the flare progresses.
Angela and I discussed this morning how this stabilization in the
footpoints' locations may corrolate to when the SHH flares begin their
final hardening. I can't confirm this - but it is similar to the guess
I made about the previous flare, which also exhibits SHH behavior.

monday, june 21, 2010:
 To the right is an
image of Flare #3 (April 17, 2002) with contours. All of the time
intervals shown are in the 25-50 keV range. This flare is interesting
because one footpoint, evident in the later time intervals , is
relatively stationary, while the other (shown in blue, green, and cyan)
migrates around within a range of about 10 arcsec. The yellow interval
seems to be the only time when both footpoints are visible, and this
made me interested in imaging a 6-12 keV together with it. Using these
two together, I may be able to get a clearer picture of where the
thermal part of the flare is located with respect to the nonthermal
footpoints.
 This image is not ideal. I tried adjusting
the detectors (cutting out the first 2 of 9) but still the green
contours (25-50 keV) below the 6-12 keV contours are not the only ones
present in that time range. Still, we can get some idea of the
structure of the flare from this comparison of the thermal and
nonthermal components.
 To the right is my first image of the
fourth flare (April 21, 2010). For the later times, it seems like the
footpoints migrate only within a roughly 10 arcsec interval. However,
the earliest 2 time intervals are in a very different place. This makes
me wonder about the location of the lower energy components. So, I'm
going to go back and make a plot of a 6-12 keV interval with some of
these higher energy ones contoured on top.
 thursday, june 17, 2010:
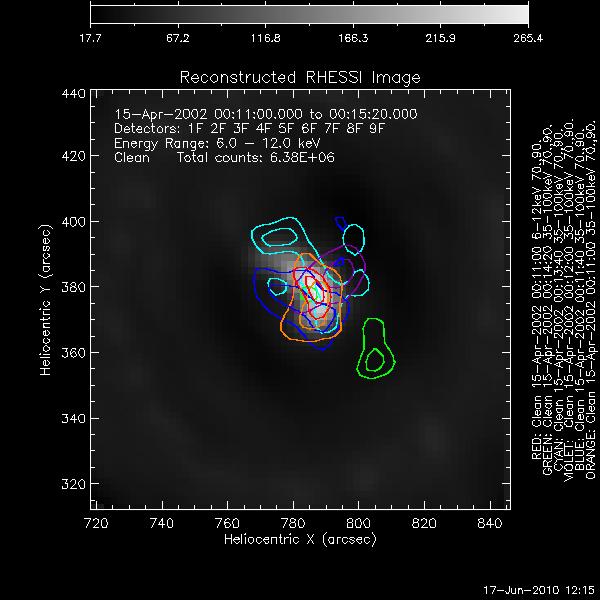 For the
same flare (#2) that I was working on yesterday, I wanted to try to
isolate the non-thermal component so that I could actaully see where
the footpoints are. So, I looked at images with the same time interval
in the 35-100 keV range. These are shown on the left contoured on top
of the original 6-12 keV plot (red contours). From this plot, the
location of the footpoints is much clearer, so we must have eliminated
any thermal contamination from previous plots. Although we really need
a centroid plot to determine where exactly the footpoints are, it seems
like they are the more isolated globs above (cyan) and below (green).
Now, I am goign to work on the centroid plotting program so that I can
see the evolution of the footpoints more clearly.
For the
same flare (#2) that I was working on yesterday, I wanted to try to
isolate the non-thermal component so that I could actaully see where
the footpoints are. So, I looked at images with the same time interval
in the 35-100 keV range. These are shown on the left contoured on top
of the original 6-12 keV plot (red contours). From this plot, the
location of the footpoints is much clearer, so we must have eliminated
any thermal contamination from previous plots. Although we really need
a centroid plot to determine where exactly the footpoints are, it seems
like they are the more isolated globs above (cyan) and below (green).
Now, I am goign to work on the centroid plotting program so that I can
see the evolution of the footpoints more clearly.wednesday, june 16, 2010:
 Today, I realized that the contour plot
that I made yesterday was in fact a 12-25keV plot, so I re-plotted the
correct version on the left. It made sense that the previous plot
looked very similar to the 6-12 keV plot, as we can see they are very
similar from the light curve for flare 2.
Today, I realized that the contour plot
that I made yesterday was in fact a 12-25keV plot, so I re-plotted the
correct version on the left. It made sense that the previous plot
looked very similar to the 6-12 keV plot, as we can see they are very
similar from the light curve for flare 2.tuesday, june 15, 2010:
 I produced this
image of the second flare that I am studying. The colors, again, encode
the progression in time for the 25-50 keV emission. Their order is:
I produced this
image of the second flare that I am studying. The colors, again, encode
the progression in time for the 25-50 keV emission. Their order is:1)Blue
2) Green
3) Violet
4) Cyan
5) Lime
6) Maroon
These are contoured on top of the 6-12 keV plot for this flare. It seems like the lima-bean shaped contours are expanding with each successive time interval. This would mean that the footpoints are in fact moving away from one another.
monday, june 14, 2010:
 Today I created this image of the first
solar flare in my list - on February 25, 2002. The colored contours
indicate increasing time intervals. They progess in the following order:
Today I created this image of the first
solar flare in my list - on February 25, 2002. The colored contours
indicate increasing time intervals. They progess in the following order:1) Blue - this is simply the contour of the plot that this shown here
2) Green
3) Cyan
4) Violet
5) Pink
Since the last two time intervals (pink and violet) show the flare spreading out to the left, we catagorized this flare as one in which the footpoints are moving. However, this flare does not exhibit SHH behavior, so this conclusion does not bring us closer to investigating the link between SHH behavior and footpoint migration.
thursday, june 10, 2010:
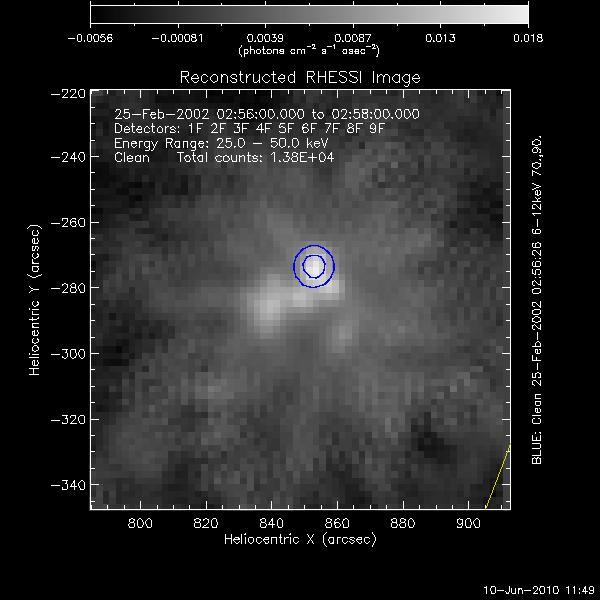 I
began
my imaging of the flare data. The image on the right is of the February
25, 2002 flare, looking specifically at the 25-50 keV range. I have
overlayed the contour of the 6-12 keV image in blue. The ultimate goal
of my project is a.) To identify footpoints if possible in the 37
flares we are working with and b.) To see if these footpoints migrate
over the course of the flare. The footpoints should be visible in the
HXR range - so overlaying lower energy plots may help me to identify
them. In the image to the left, for example, the footpoints could be
any of the brighter points below the blue contours. However, we need
more information before we can specify their location for sure.
 wednesday, june 9, 2010: Today was very productive. I spent the morning reading the paper on Spectral Hardening which I understood a surprising amount of. I feel more confident now about what the question I am working on is and why we are interested in it. I then met with Angela, went through the reading, and figured out how to download the raw RHESSI data onto /disk/data/rhessi so that I can start imaging. I downloaded data for three flares this afternoon, which we will start to image tomorrow. I also went to a tutorial on Spectroscopy with Dana, Cameron, and Angela.
tuesday, june 8, 2010: Today I spent the morning reading the Cambridge Encyclopedia of the Sun in preparation for our lecture this afternoon, and I also took a look at a few of the other papers that Angela gave me. At one, I met with Angela to go over the work that I had done - going over GOES and RHESSI flare data from the paper "Spectral Hardening in Solar Flares" that my project is based off of. We went through the schematic of RHESSI from one of the articles that I had read, which clarified how it detects and locates the origin of incoming photons. Next, Dana gave us a lecture on "The Sun as a Star," which was basically an introduction to the structure of the Sun - how it supports itself against gravity, generates energy at its center through nuclear reactions, and then transports this energy up to the surface. Between now and my meeting tomorrow morning with Angela, I plan to read through the "Spectral Hardening" paper mentioned above and begin to download the data I need for my imaging project. As soon as the site comes back up, I will also go back to the flares that I marked originally for various problems and see if I can sort that out after having spoken to Angela today.