Project Peristaltic Pumping in Post-CME Supra-Arcades
The dynamic nature of the plasma and magnetic fields connected to solar flares is a growing field of both observational and theoretical physics. The phenomena of an invasive decending magnetic feature within a supra-arcade current sheet is particularly interesting when considering uncertainties of the coronal heating problem.
Motivation: We want to explore properties related to the current sheet, allowing us to pose plausable explainations for why voids and low emission columns in the supra-arcade downflow exist. In order to understand large complex problems such as the coronal heating problem, we must first be able to explain phenomena such as voids and shocks. To accompish these goals we create models in an effort to reproduce observed phenomena and data ultimately affirming or discrediting hypotheses.
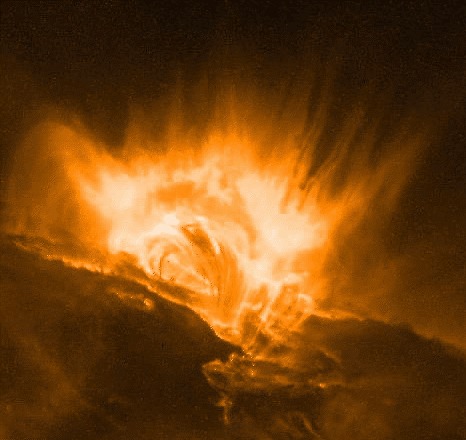
The dynamic nature of the plasma and magnetic fields connected to solar flares is a growing field of both observational and theoretical physics. The phenomena of an invasive decending magnetic feature within a supra-arcade current sheet is particularly interesting when considering uncertainties of the coronal heating problem.

|
IDL tutorials and general solar physics lectures took the majority of the week. Several minor projects involving IDL programming introduced us to the general syntax of the language. The work on my individual project began with revisiting some basic physics principles concentrating heavily on fluid dynamics. interesting(maybe)_pdf What we are generally interested in investigating are intrusions illustrated by the figure below (courtesy of Roger Scott). 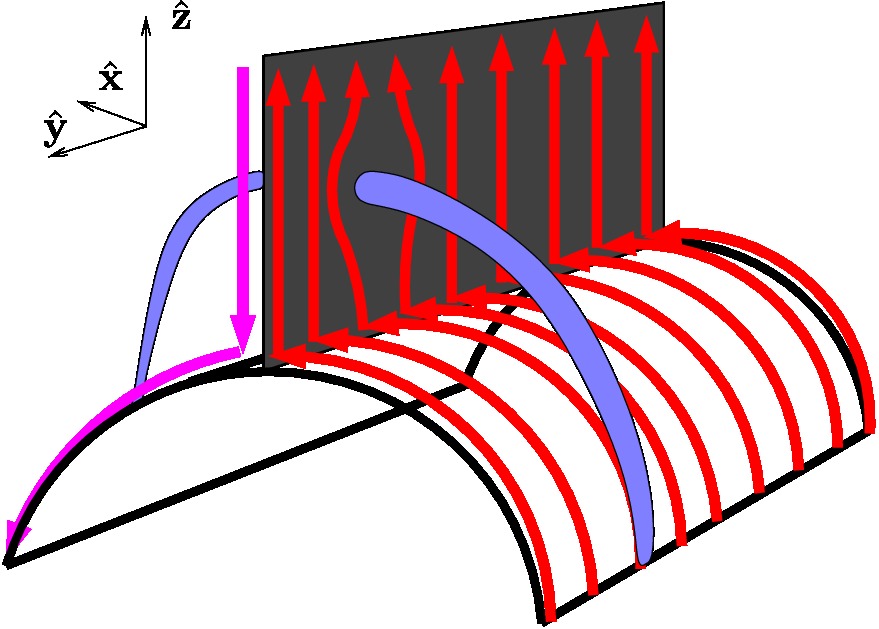 The low emission voids have been interpreted as retracting coronal loops; this figure illustrates how the retracting coronal loop pierces the supra-arcade as it descends toward the photosphere. What we are most interested in is the behavior of plasma contained between the upper and lower transonic flow regions (figure below courtesy of Roger B.Scott). 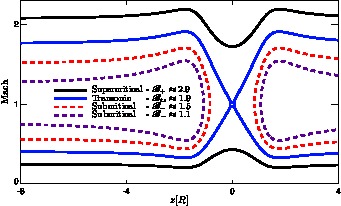 Models of peristaltic pumping use the cross sectional area along an individual field line, which varies inversely with the field strength, to develop solutions to de Laval's nozzle equation. Solutions that fall between the upper and lower transonic flow lines correspond to inflow Mach values that cannot satisfy the conditions of plasma flow unless shocks are introduced. The first project invovled creating an IDL program that ran Bernoulli's principle. 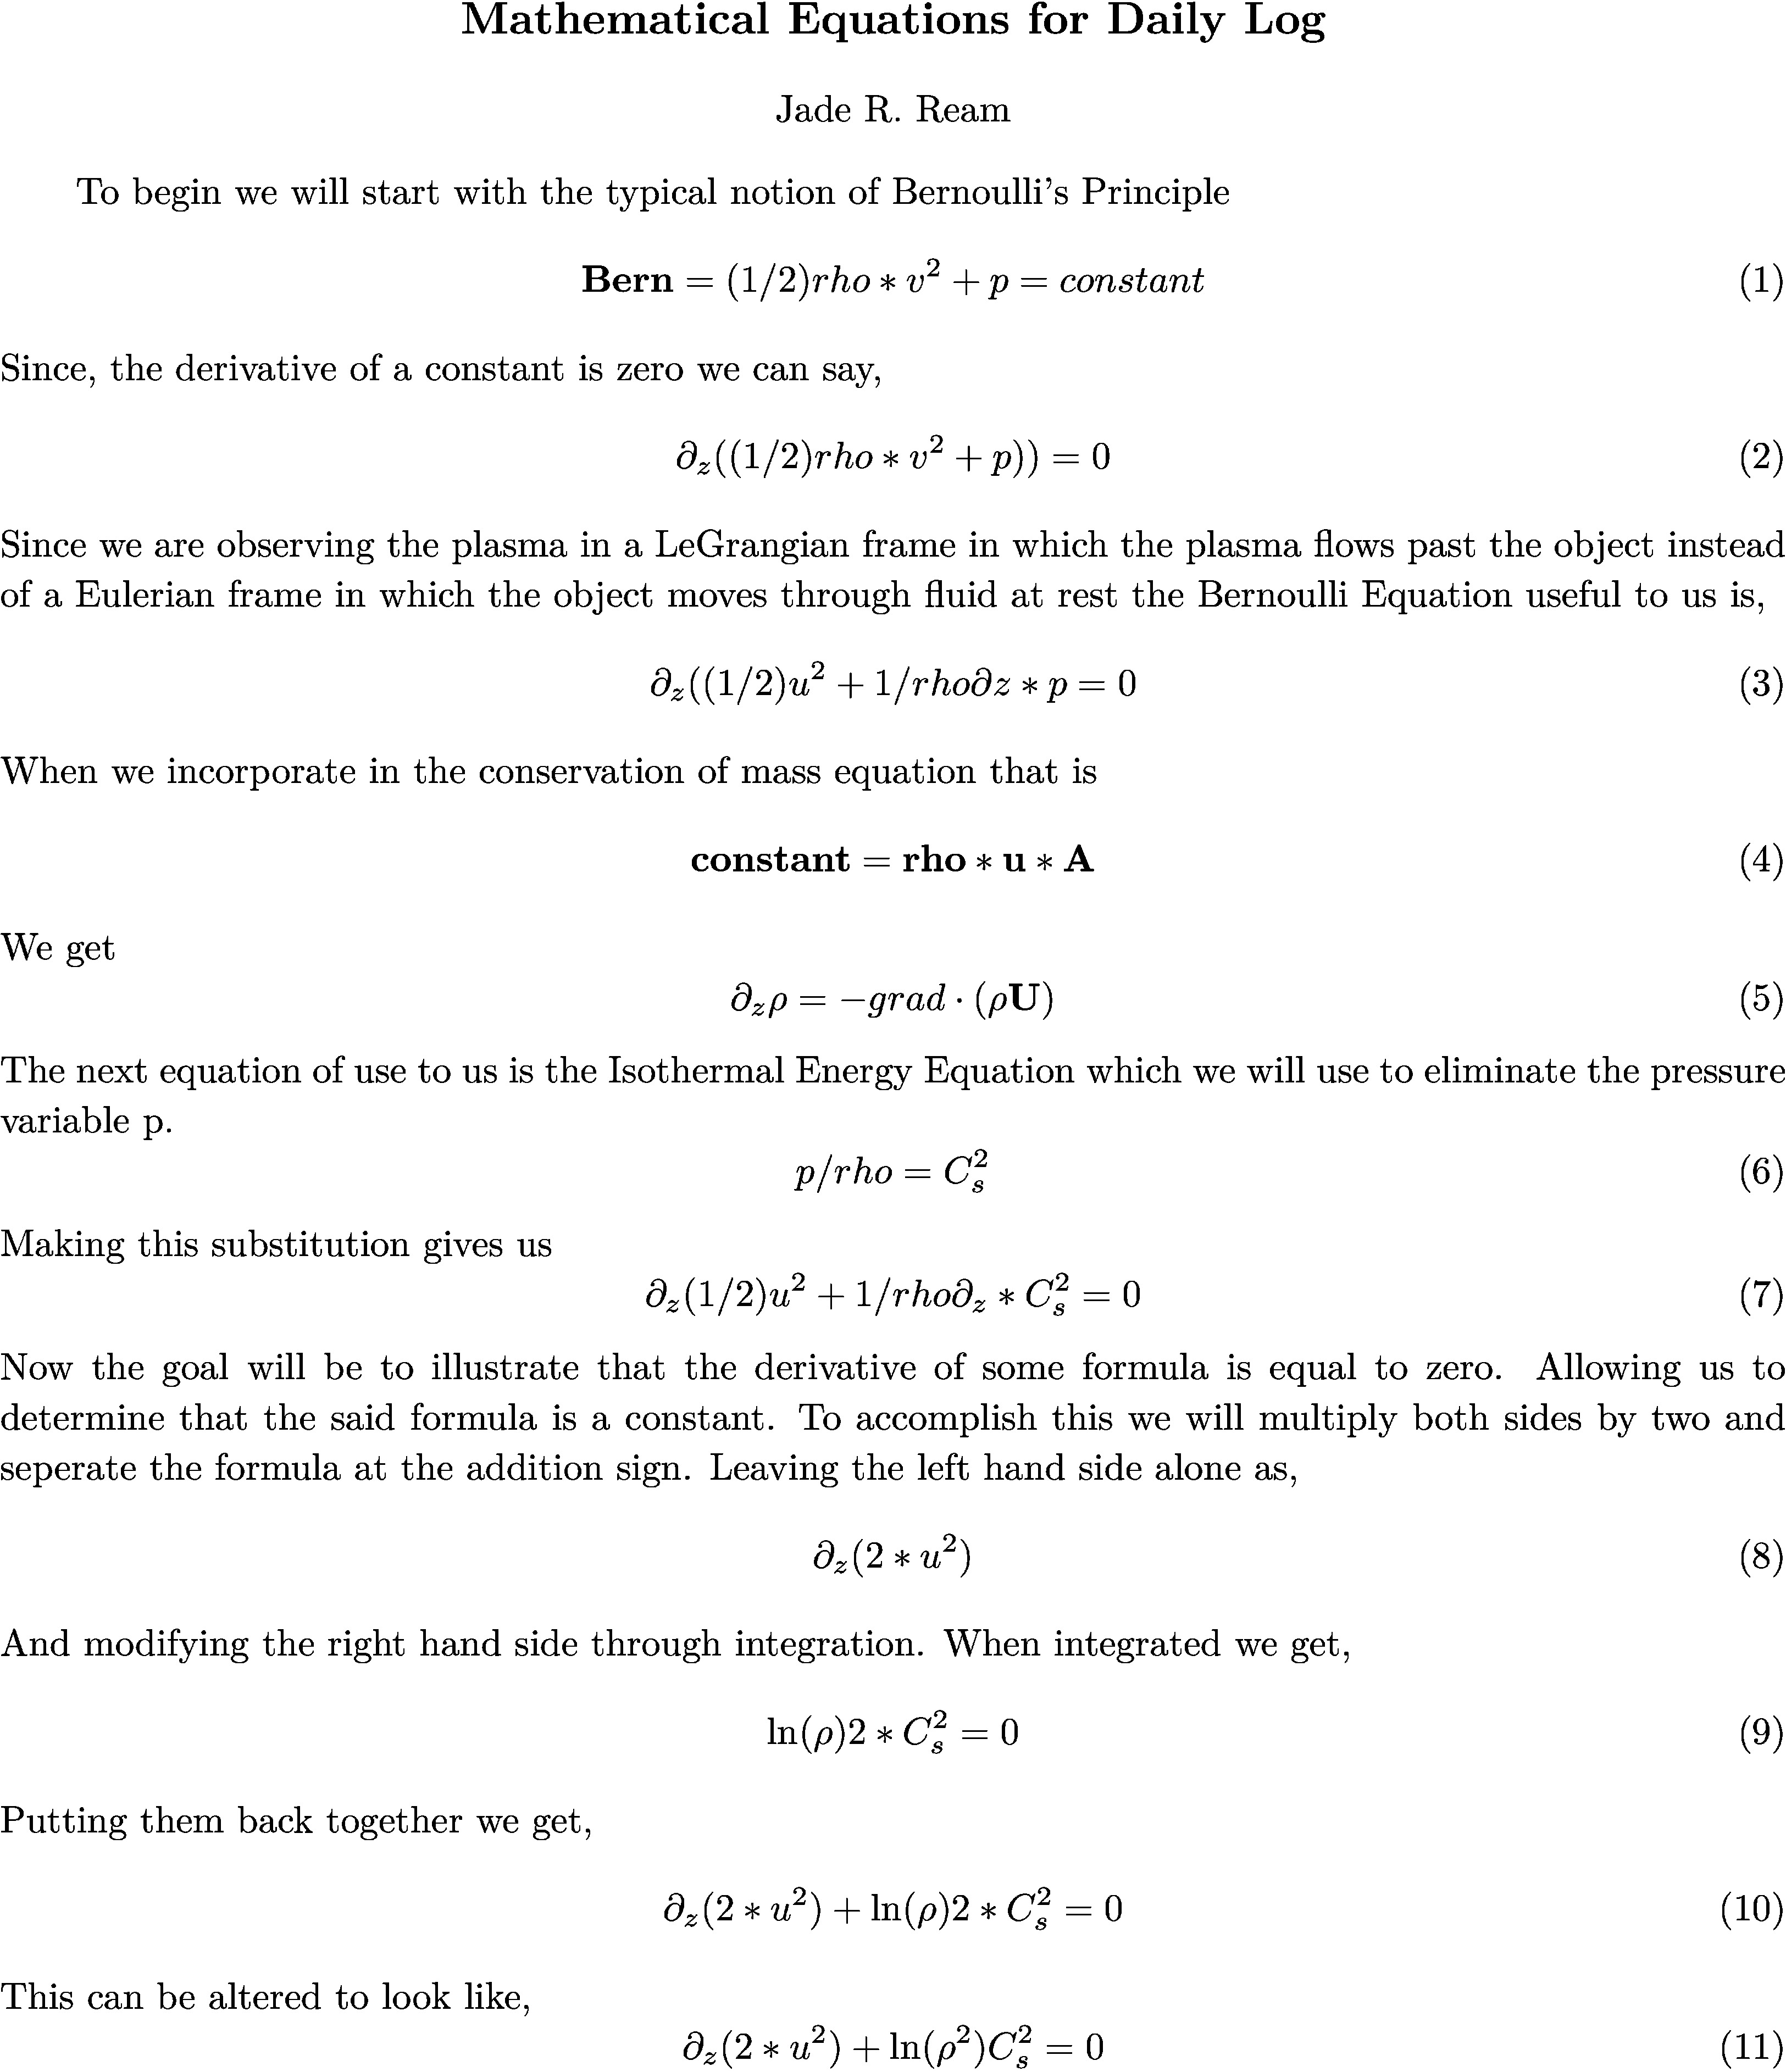 I designed a very simple program that ran Bernoulli's Equation outputing the solution and a plot given a subsonic (less than one) or supersonic (greater than one) value. The picture below represents a subsonic flow simulation. 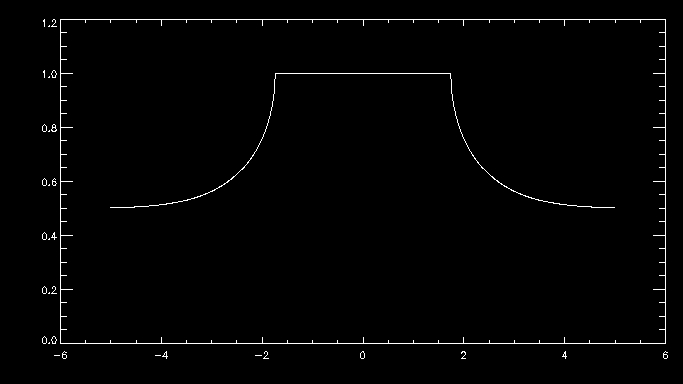 With the Bernoulli modeling program complete, I moved onto the next phase of the REU. Roger Scott developed a simulation of a circluar magnetic preturbation in the central supra-arcade current sheet. Systematically, the next step in research is to develop a model of an elliptical preturbation in the current sheet. 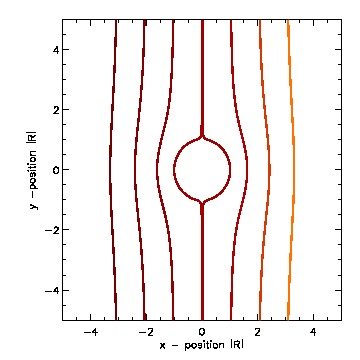 This figure displays a cross-section of the supra-arcade structure, demonstrating that the intruding element of reconnecting flux deforms the surrounding field. To begin thinking about modeling a disruption in the current sheet required an in depth review of complex analysis. After reviewing some complex analysis that I was familiar with, I was introduced to the concept of conformal mapping. The conformal mapping that we were particularly interested in involved the manipulation of Joukowski Transformations. Joukowski Transformation: Getting the general concept of how Joukowski Transformations work took several days, but after grasping that knowledge it was time to incorporate them into the programming. I began writing a program that turned an ellipse into a circle, to ultimately illustrate the fluid dynamics of plasma around an elliptical preturbation. This may seem counter-intuitive, intuition being that we would transform a circle into an ellipse... This week will consist mostly of modifying and tweaking the program for the Joukowski Transformations. Another task that will consume a lot of my time will be learning latex, which I have never been exposed to. The images that have been created in idl will be useful to use in my poster (which will be designed using latex) and within the final paper. My Joukowski Transformation program makes conformal maps of the fluid dynamics around various ellipses. The size and shape of the ellispes can be modified by the varables contained in the program. This is useful to anticipate the plasma behavoir surrounding the voids. After I finally worked the bugs out of transformation program, I get some conformal mapping images. 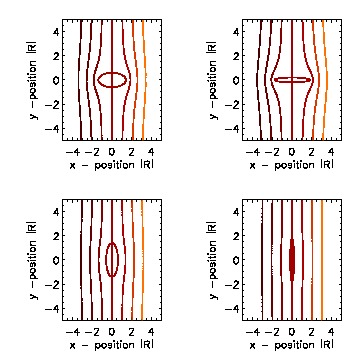 We also developed the grids to illustrate the conformation process.  With a little help from Roger Scott the final combined image for the poster illustrated the mathematical conformations and both grid sets. 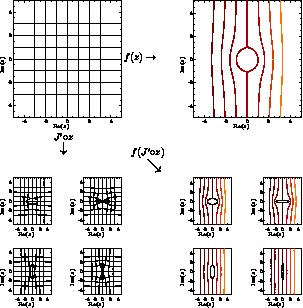 Posters are due at the beginning of next week, so many hours will be spent developing and touching up my poster. The program does everything that I need it to do thus far, so what remains to be done is construct images and convert them into various file types. This week revovles around the SPD conference, and since we are allowed to attend all the presentations that we desire to, my week will be filled mostly with learning about the research of others. I finished up with the implication section of the presentation over the weekend and it is as follows:The phenomenon of peristaltic pumping offers one explanation for how energy can be deposited into the unreconnected field by nearby reconnection events. Previous work on peristaltic pumping predicts an upper limit on the speed at which downflows can produce shocks ($M_{crit}\approx 2$), which may have ramifications for the rate at which the energy deposition can occur. Through this work we intend to investigate how the critical velocity changes when the shape of the intrusion is modified. The formation of shocks along an individual field line is directly related to the shape of the transonic solution. The critical speed at which shocks form is reliant on the minimum cross-section of the most severely constricted field line. Through conformal mapping we are able to determine how this cross-section is related to the eccentricity of the intrusion. Future research will concentrate on isolating how the eccentricity affects both the critical Mach number for shock formation and the characteristic width of the shocked column. This is the final poster I presented, finalposter_pdf Friday of last week, I began delving into more derivations. We began analytical work on the 2D Coordinate transform for fluid equations. The beginning of this week will consist of producing a latex document containing a methodical progression of the math we have done thus far. derivation_pdf The beginning of the week was spent revising the derivations document from last week. Once all the math was complete we could start putting the equations we dervived to good use in a computer program. The first program developed answered the question: How does the critical Mach-value (M_crit) depend the user input aspect ratio of the ellipse (B)? 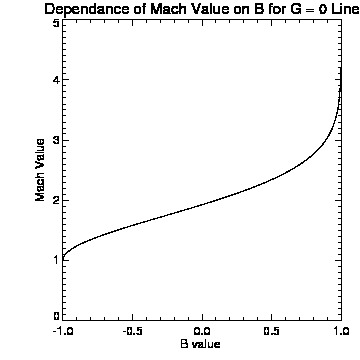 As the skew of the ellispe is stretched horizontally the constriction of flow decreases towards zero, which represents no flow. As the ellispe is stretched vertically the opposite is true, resulting in almost no restriction of flow. The flow restriction is directly proportional to the Mach-value creating the function displayed above. 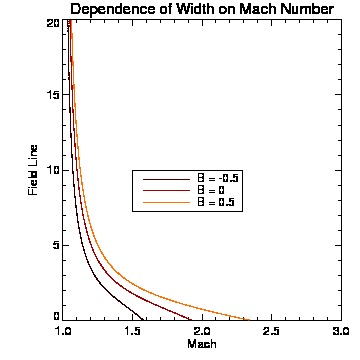 The figure below illustrates how cross-sectional area (A), is related to ellitical skew (B). 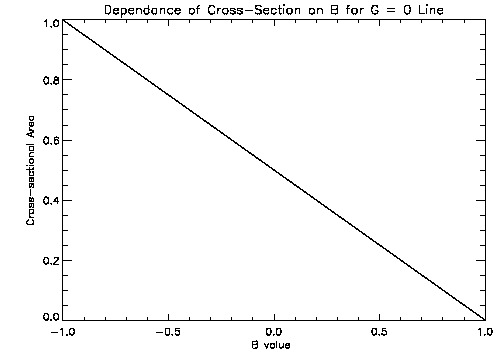 The interesting thing about this graph was that we did not expect it to be linear, due to the complex nature of the flux function. The the math confirmed that it was indeed linear, which implies the B value is directly proprtional to the cross-sectional area. 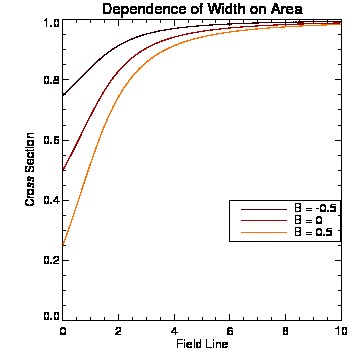 July29th-August2nd. This week was spent making graph corrections such as quality improvement and addition of color and legends. Ultimately, I am moving towards completion of my presentation, which is set for next Wednesday. The final presentation will be given Wednesday (7th), this is my beamer thus far. final_pdf |