
Fig.D1 List of input files
HELP: This will bring up a file which explains what each button does.
QUIT: No prizes for guessing what this does!
DATA: This lists all available magnetograms in the local directory, Fig.D1. When one is selected an intensity line of sight image of the magnetogram is displayed, Fig.D2. This displays a number of features including contours and vector fields. The contours are calculated from the longitudinal magnetic field (B_LONG) which is Image 1 in the magnetogram FITS file.

Fig.D1 List of input files
The red contours represent positive magnetic region and
the blue negative. The contours are labeled in Gauss. The legend displays
this color coordination, contour sizes and pixel size of the magnetogram.
Each individual pixel also has its amplitude defined by the transverse
component of the magnetic field B (B_TRANS) and the azimuth of the transverse
component of B (B_AZIM), which appears as small black and white lines.
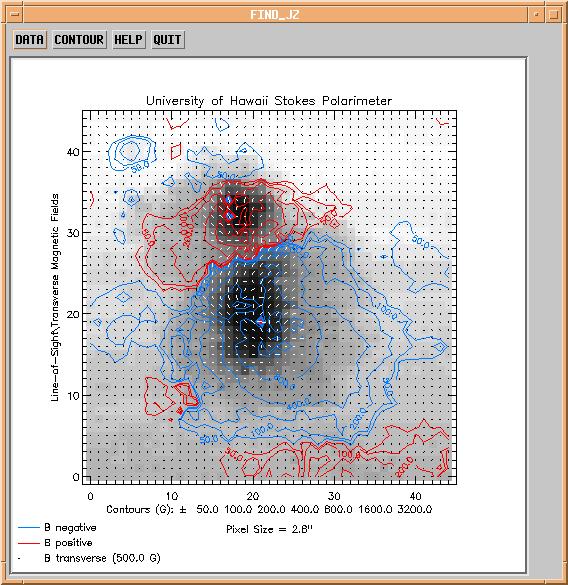
Fig.D2 FIND_JZ window
CONTOUR: This button will only work if a magnetogram has first been selected using the DATA button. The contour button will bring up a white light image of the magnetogram and also a Region of Interest control box, Fig. C2. This control box is self explanatory and is used to manually draw around the penumbra of the active region, see Fig. C1. When a region has been selected click on the Done button in the Region of Interest control box.
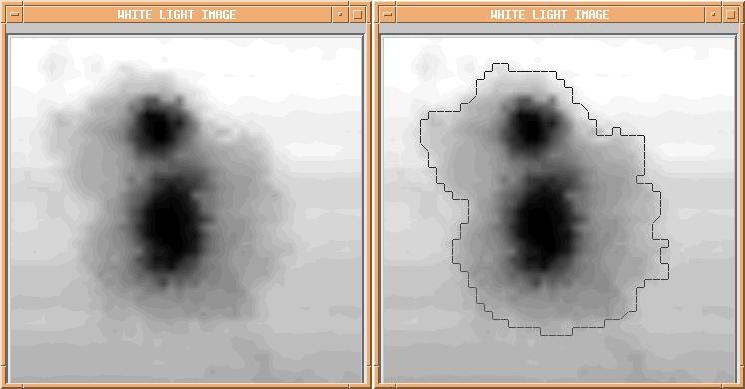
Fig. C1 White light image of active region (AR) [left], white
light image of active region with manual contour drawn around penumbra
of AR [right]
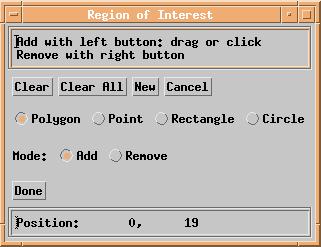
Fig. C2 Region of Interest control box. The 'Position' shows
the pixel coordinates of the image.
There are three option in the window:
ACCEPT:
agree that the best fit Gaussian curve is a fair representation of the
data and proceeded with calculations accepting the displayed noise levels.
REJECT: the best fit Gaussian does not represent the data fairly so continue with calculations taking the sigma values of the Gaussian best fit curves to be zero, i.e. proceed with zero noise, (sigma = 0)
REDRAW REGION: manually redraw the region(s) of interest ot see if a better Gaussian fit can be obtained, i.e. return to figures Fig. C1 and Fig. C2.
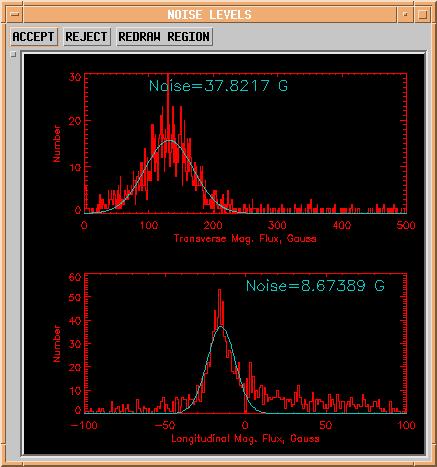
Fig. H1 Noise calculated based on manually selected region of
interest. Calculated noise value in Gauss and best fit Gaussian curve are
also shown.

Fig. LP1 Active region JZ-7220 which has a positive (red) leading
polarity.
A white line joins the center of masses, (which appear as yellow diamonds), of each region. It is the magnetic longitudinal field, B_LONG which is used as the weight (mass) in this center of mass calculation. It is this line which joins the center of mass of the positive and negative region that is defined as the distance between the two regions. This distance calculated in arc seconds is displayed beside the line in white. The user must either accept or reject this length. Accept the length if it looks consistent with its surroundings, bearing in mind that it is not the center of mass of the intensity white light image but that of B_LONG. Saturated or spoiled data may cause problems in the calculation of the center of masses. Data can become spoiled if a cloud passes in front of the telescope during a scan. This is why the program uses a visual representation so the user can accept or reject the calculation. If the length calculation is rejected the length is given the value zero.
If the data is spoiled in some way what more frequently happens is that the program will 'crash' before this distance line is drawn. This is because the maximum or minimum value in the image will not be in the region of interest, but contained with in the spoiled data. This causes problems in the function which draws the threshold contours. If the program does crash or halt before its end, the user must exit their IDL session and restart it. This is to prevent plotting problems, see Troubleshooting.
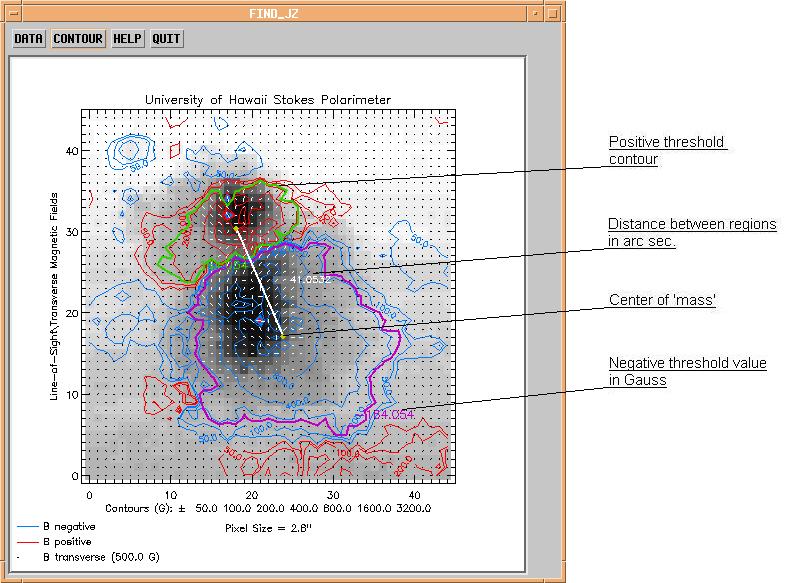
Fig. L1 Length of active region defined between the two threshold
contours of 164 Gauss in this case
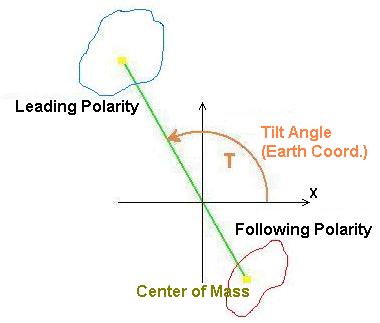
Fig. A1 The tilt angle is measured anti clockwise from the x-axis
The solar angle is slightly more complicated. The solar angle is the angle of this distance line in solar coordinates. As the orientation of the Earth's and sun's poles are constantly changing due to the rotation of the Earth there is a correction angle known as the 'position angle', PA, which must be accounted for, (-23.5 > PA < 23.5 degrees). The position angle is dependent on the date and time at which the magnetogram was taken, i.e. the angle between the Earth's and the sun's poles at that moment in history. Once this angle has been determined the solar angle can be calculated from :
Magnetogram No.
Active Region No. Leading Polarity
Eruptivity
Net JZ0 Total
JZ0 Net BZ0 Total BZ0
No. Pixels0 Net JZ300 Total JZ300
Net BZ300 Total BZ300 No. Pixels300
Net JZ150_75 Total JZ150_75 Net BZ150
_75 Total BZ150_75 No. Pixels150_75
Net JZ2sigma Total JZ2sigma Net BZ2sigma
Total BZ2sigma No. Pixels2sigma SigmaT
SigmaL Pixel Size L
AngE AngS
where:
Net JZ0
- net current within manually defined region of interest
using all pixels with this region in the calculation. [miliamps per meter
squared]
Total JZ0 - total current within manually defined region of interest using all pixels with this region in the calculation. [miliamps per meter squared]
Net BZ0 - net magnetic field within manually defined region of interest using all pixels with this region in the calculation. [Gauss]
Total BZ0 - total magnetic field within manually defined region of interest using all pixels with this region in the calculation. [Gauss]
No. Pixels - number of pixels within manually defined region of interest. [scalar]
Net JZ300 - net current within manually defined region of interest discarding those with transverse magnetic field above 300 Gauss [miliamps per meter squared]
....
Net JZ150_75 - net current within manually defined region of interest using only those pixels who have a magnetic transverse field above 150 G and a longitudinal field above 75 G. [miliamps per meter squared]
....
Net JZ2sigma - net current within manually defined region of interest using only pixels greater than 2 SigmaT in the transverse magnetic field and greater than 2 SigmaL in the longitudinal magnetic field. [milliamps per meter squared]
....
SigmaT - sigma parameter from transverse magnetic flux Gaussian noise fit. [scalar]
SigmaL - sigma parameter from longitudinal magnetic flux Gaussian noise fit. [scalar]
L - distance between center of positive and negative fields in active region of interest. [arc seconds]
AngE - Earth angle i.e. the angle the line L makes to the x-axis in Earth coordinates. [degrees]
AngS
- solar angle, i.e. the angle the line L makes in solar
coordinates. [degrees]
The DATA button in the original FIND_JZ window displays a list of magnetograms as listed in the file jz_names. To illustrate the procedure of adding new magnetograms it is best to follow an example.
Say the user wants to add all magnetograms that are available on the magnetogram CD for the active region 7220. There are 9 in all. First the file names must be added to the jz_names list. These should be written in the format ' JZ_7220/J920706.2212 '. Fig. AM1 illustrates the significance of this ordering.

Fig. AM1 Significance of file name
Enter all 9 files in this format into the file jz_names.
On the CD magnetograms are stored in folders named after their active region
number. Now simply copy the folder JZ_7220 from CD to the local directory.
The next time you select the DATA button on the FIND_JZ window, these new
magnetograms will be available. For example say someone selects JZ_7220/J920706.2212
from the DATA list, the program searches the local directory for the folder
JZ_7220 and then for the file J920706.2212 and displays it as an intensity
white light image with contours etc. similar to Fig. D2.