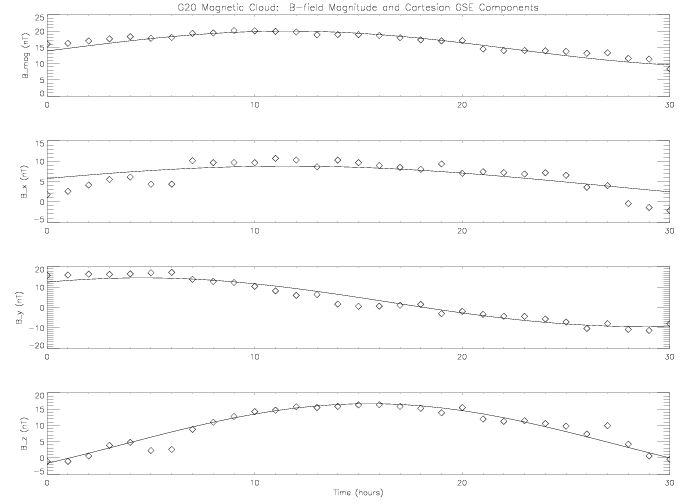

So, after many trials and tribulations, we were finally able to get the program running successfully. Shown below are the results of applying the fitting procedures to 2 sets of magnetic cloud data from Wind, which were obtained through CDAWeb.
This particular cloud had a duration of 31 hours, spanning from January
7, 1998 03:00:00 to January 8, 1998 10:00:00.
Shown below is the magnetic field magnitude, as well as the three components
in Cartesian GSE coordinates.

As you can see, the model magnetic field fits the observed data very well. Below is a table of the best-fit parameters as determined by AMOEBA:
Parameters for G20 Magnetic Cloud
|
|
|
|
|
|
|
|
|
|
|
|
|
|
|
|
|
|
2) Below is the hourly data for the magnetic
cloud along with what our model predicts as the best-fit. The data
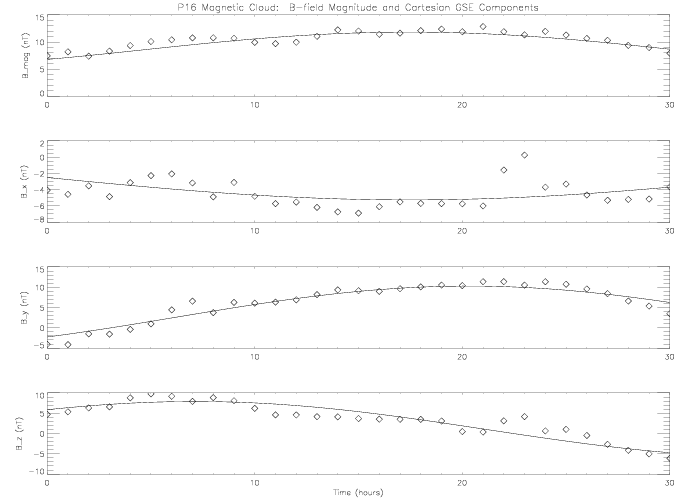
is for the magnetic cloud event produced by the P16 eruption event.
This magnetic cloud also had a duration of 31 hours. The cloud occurred
between December 24, 1996 03:00:00 and December 25, 1996 10:00:00.
Again, shown below is the magnetic field magnitude as well as the three
components in Cartesian GSE coordinates:

Again, the model fits the data very well. Dr. Ron Lepping, who developed a similar procedure for fitting magnetic cloud data, was kind enough to supply us with the parameters for this particular cloud that his fitting routine came up with, so that we might use it as a check to see how well our procedures compared with his. Shown below are the best-fit parameters as determined by our procedure (top), as well as Ron Lepping's parameters (bottom):
Parameters for P16 Magnetic Cloud
|
|
|
|
|
|
|
|
|
|
|
|
|
|
|
|
|
|
|
|
|
|
|
|
|
|
|
|
|
|
As you can see, our calculated best-fit parameters are close to those which Ron Lepping calculated. Although there are some minor disagreements, on the whole our fitting procedures seem to be a success. We therefore conclude that the 'constant-alpha' or 'force-free' approximation for our magnetic clouds is a good one.
As mentioned earlier, with the fitting procedures
working, we wished to compare certain physical characteristics of a magnetic
cloud, namely the total current and flux, to the associated characteristics
of the sigmoid eruption event that gave rise to that magnetic cloud.
To do this, we utilized the program developed by Keith
Lambkin, a Solar Physics REU student for the year 2001, that calculates
various characteristics of Active Regions by examining their vector magnetograms.
A vector magnetogram is a 'picture' of the magnetic
field around an Active Region. You cannot truly see the magnetic
field, but by measuring the spectral line splitting due to the Zeeman
Effect you can determine the magnitude of the magnetic field.
Also, by observing the polarization of the photons emitted, the direction
of the magnetic field can be determined. It is important to note,
however, that these magnetograms depict only the 'line-of-sight' magnetic
field, that is, the component of the total magnetic field that points directly
toward or away from the observer.
Due to time and magnetogram constraints, we were only able to examine one Active Region magnetogram for comparison with its associated magnetic cloud event. We chose the G16 sigmoid eruption event, and by applying Keith's program to this magnetogram, we were able to calculate the total current and total flux in the G16 Active Region.
Keith's program outputs a list of various parameters
for the Active Region under study. Among these are the total current
density, total magnetic field, number of pixels in the region of interest,
etc, all of which are line-of-sight values.
By multiplying the total current density and total
magnetic field by the area of the G16 Active Region (and applying appropriate
conversion factors), we found that the total current (Amperes) and total
flux (Webers), along with the photospheric value of alpha
in
the Active Region was,
IAR = 4.45 x 10 12 Amps
FluxAR = 6.20 x 10 13 Wb
alphaAR = -3.18 x 10 -8 1/m
ICLOUD = 1.22 x 10⁹ Amps
FluxCLOUD = 1.64 x 10¹³ Wb
alphaCLOUD = 5.93 x 10 -11 1/m
We expected to see that only a small fraction of
the magnetic flux and current in the Active Region is transferred to the
magnetic cloud, and that is indeed what the calculations above suggest.
We also expected the value of alphaCLOUD
to be smaller than alphaAR since alpha
goes as the inverse of the cloud radius, and we know that the cloud expands
once it is ejected from the Active Region. Furthermore, notice that
the photospheric and magnetic cloud values of alpha have
different signs. The negative value in the Active Region indicates
a left-handed twisting of the magnetic field, while the positive value
in the magnetic cloud indicates a right-handed twisting. This might
indicate that some mechanism, perhaps magnetic reconnection, may be responsible
for rearranging the magnetic helicity during the eruption that spawns the
magnetic cloud.
Now, calculations done for only one case are not
statistically significant, but they do open up interesting questions, like
those above, hopefully to be answered by further study of the correlation
between the properties of Active Regions and those of their associated
magnetic cloud events, as well as the magnetic dynamics during Coronal
Mass Ejections.
Introduction
Mathematics
The
Program
Results
Acknowledgements