WBS flare statistics
According to the SMM results, the continuum component due to Bremsstrahlung
is dominant in limb flares, whereas the flares with strong neutron capture line
emission often occurred on the disk.
The former results from the fact that the Bremsstrahlung mechanism,
in the gamma-ray region
(meaning MeV photons and relativistic electrons),
radiates the mainly in the forward
direction.
This would be from corona toward the solar surface, for coronal
acceleration; this biases against detection at disk center.
On the other hand the neutron capture line results from energetic particles
penetrating into the deeper and denser layer of the photosphere.
The radiation from these deeper layers, conversely, is better observed on the disk
where the line-of-sight depth is shorter than at the limb.
Although they have seldom been mentioned in our science nuggets, Yohkoh carries two spectrometers for high-energy X-rays and gamma-rays (BCS and WBS), in addition to the two well-known imaging telescopes (SXT and HXT). In contrast with the BCS, which observes detailed spectra in narrow wavelength ranges around four emission lines appropriate for solar flares, the WBS (Wide Band Spectrometer) observes wider ranges of spectra from 2 keV all the way to 10 MeV. This wide range of energy detected with WBS is covered by three types of spectrometers, as follows.
One can't tell much from these pictures, of course, but the GRS consisted
of large BGO (bismuth germanate) scintillation counters, just about the
densest and best type of detector for high-energy radiation.
In this respect (stopping power for these difficult photons) the GRS
instrument rivals the more modern
RHESSI.
For more details about the WBS instrument, see here.
Although one can come across some descriptions and displays of the BCS data in previous nuggets, (e.g. the 16-Jun-2000 edition), those of the WBS are harder to find. In fact, there haven't been any yet! For one reason, spectral data are generally less visually appealing than image data and thus many authors may not want to use them. But the main reason must be the fact that, thanks to Yohkoh's long life, a good number of flare data have been newly accumulated during the rising through maximum phase of this (23rd) solar cycle. The nugget writers simply have not noticed these good data, for which almost no analysis has yet been done!
Recently an able data-analyzer, Y. Matsumoto of the University of Tokyo,
carried through the troublesome work of WBS/GRS data calibration and
investigated properties of the gamma-ray flares observed with Yohkoh.
In her thesis work in 2001, she at first made statistical studies of the
whole data set.
She then picked two specific flares
(18-Aug-1998 and 27-Oct-1991) and made a closer analysis to derive some
interesting results; she plans to report these results by herself in a future
nugget.
This nugget is a brief review of the first part of
her work (the statistical study), and it turns out to be the first memorable
nugget featuring the WBS!

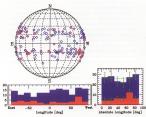
From the above table and figures, it turns out that the gamma-ray flares tend to be observed towards the limb region. This supports a result obtained with SMM. The highlighted cells in the huge table show the locations of the flares which occurred within ranges of absolute heliographic longitude, 60 through 70 degrees (yellow), and 70 through 90 degrees (pink). One can see that nearly half of the events (18 out of 38) came from the longitude larger than 50 degrees, in spite of the fact that the area of those regions is only one third of the whole hemisphere. Is this statistically significant?
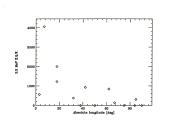
Turning to the flares showing the 2.2 MeV neutron-capture line, Matsumoto found that the Yohkoh gamma-ray flares show the same tendency as that seen in the SMM data: the line is less well detected in the limb flares. In the case of the Yohkoh flares, there were three events which have strong 2.2 Mev line emission (with equivalent width larger than 1000 keV), and they were all observed onn the disk at absolute longitudes less than 20 degrees. The relation between the equivalent width and the absolute longitudes is shown in the plot below, which is also taken from her thesis.

April 5, 2002
A. Takeda (takeda@isass1.solar.isas.ac.jp) with thanks to Y. Matsumoto and H. Hudson