March 9, 1999: Solar scientist Ron Moore extended his right hand and clasped a visitor at mid-forearm. "These are the solar magnetic field lines snaking around each other, forming the letter 'S'," he explained. "Usually they go past each other. But if they connect at the wrists, it's like a coronal short circuit. The mid-section pops up and drives out a coronal mass ejection, a CME. Nobody understand exactly why this happens. But you don't explode very often unless you're twisted." And until recently, no one could predict when it would happen. But a new study, published today in Geophysical Research Letters, is putting scientists on the trail of predicting such eruptions. It's something that scientists have suspected for decades, and it will help give advance notice for the Solar Vector Magnetograph (SVMG) at NASA's Marshall Space Flight Center. |
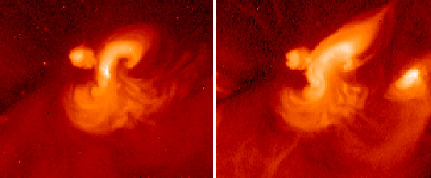
"With the vector magnetograph, you can get in there and measure the shear in the magnetic fields," said Moore, one of the scientists who uses the SVMG. "This new finding tells us what to do with our data; where to follow up." Left: Images from the Soft X-ray Telescope aboard Japan's Yohkoh satellite showing an S-shaped region before (left) and during (right) an explosion on Jan. 16, 1993. Such sigmoid structures can often be observed for several days before the occurrence of an eruption; links to 431x178-pixel, 63KB GIF. Credit: Montana State University. The "S marks the spot" finding was made by Drs. Richard Canfield and David McKenzie at Montana State University-Bozeman, and Dr. Hugh Hudson of the Solar Physics Research Corporation, Tucson, AZ. Solar activity has intrigued scientists since 1611 when Galileo turned his telescope to the sun and discovered sunspots (and eventually blinded himself, so never try this without the correct filters). Unseen to the eye, or even most telescopes, are intense magnetic fields that confine and conduct plasmas - electrified gases - over the visible surface of the sun. The effects of these magnetic fields are readily seen in the form of sinuous prominences and filaments that rise and fall above the surface.The Solar Vector Magnetograph uses a special optical package to extract the polarization from spectral lines of sunlight. From this, scientists can measure the intensity and direction of a magnetic field in a hot gas. |
Click here for a 000KB MPEG showing an S-shaped region that exploded on Oct. 25, 1994, and launched a CME toward the Earth. This one violated the hemispheric rule in that it was 2-shaped, rather than S-shaped, in the southern hemisphere. Suddenly, everything snaps back, and 10 billion tons of ionized gas are hurled into space at up to a 3 million km/h. If the gas bundle - still constrained by its own magnetic field - goes off at the right spot on the sun, it intercepts the Earth in about four days. In turn, that sets off geomagnetic storms that can damage satellites in space and shut down electrical power grids on the ground. |
|
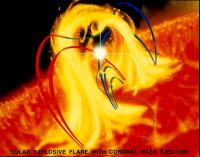
Above: Artist's concept depicts the magnetic field lines involved in a reconnection event leading to a CME. Links to 550x635-pixel, 98KB JPG. Credit: NASA/Marshall Space Flight Center. |
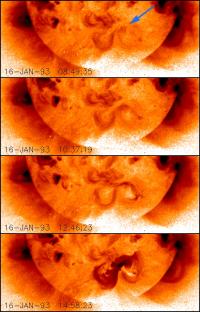
"If you draw an 'S' and turn it upside down, it's still an S," Moore explained. "But from the back it looks like a 2. There's a strong hemispheric rule about global magnetic fields. The handedness of that S - in the north it's a 2, in the south it's an S - shows that there's a global sense of twist to the magnetic fields." The twist is a global sign of shear in the magnetic field. "It means it has stored energy," Moore said. "It's cocked and ready to explode." For years, scientists using X-ray telescopes had seen glowing S-shaped regions in the midst of active areas. These were recognized as the dividing line between areas with different polarity - north-pointing magnetic fields on one side, south-pointing on the other. Taking two years of data from the Soft X-ray Telescope, Canfield, Hudson, and McKenzie theorized regions with an obvious global twist to the magnetic fields (S-shaped or 2-shaped in the X-ray images) are more likely to erupt into a CME than are regions with no traceable global twist. Left: A sequence of images from the Soft X-ray Telescope on Yohkoh shows a CME eruption on Jan. 16, 1993. As the images show, the eruption occurred when the region was just to the south of disk center; the material arrived at Earth and generated geomagnetic storms a few days later. Links to 512x800-pixel, 221KB GIF. Credit: Montana State University. "They did a statistical sample and determined which ones are going to explode," Moore said. "Previously, people have only inferred this from observations that were not as direct and didn't have the visible impact of the images from Yohkoh's X-ray telescope. No one has shown this so clearly before." |
| Now that it's been done, Moore says that telescopes like the vector magnetograph - several have been built since NASA/Marshall pioneered the technique in the 1970s - will be able to concentrate on likely explosion sites. It also provides a prime target for observations by the Solar X-ray Imager (SXI), a small X-ray telescope built by NASA/Marshall for launch aboard a NOAA geostationary-orbit weather satellite in 2000. While the satellite's cameras are watching storms march across the face of planet Earth, the SXI will watch the sun, and return images every minute as it looks for signs of stormy space weather that may be headed our way. Greater detail will be provided by the Solar-B satellite being developed by Japan, and by a proposed Next Generation of Solar High-Resolution Imaging Instrumentation under study at NASA/Marshall. |
More Space Science Headlines - NASA research on the web NASA's Office of Space Science press releases and other news related to NASA and astrophysics |
Join our growing list of subscribers - sign up for our express news delivery and you will receive a mail message every time we post a new story!!! More Headlines return to Space Science News Home
|