 |
MSU Solar Physics Group |
 |
MSU Solar Physics Group |
Notice: The full text of our March 1999 Press Release is linked here, as well as a list of News Organizations carrying the story.
Background
What are Coronal Mass Ejections (CMEs)?
Coronal mass ejections, or CMEs, are violent discharges of material from the Sun's outer atmosphere. The ejected material can travel at speeds of up to a million miles per hour. If this flow of charged particles and embedded magnetic field collides with Earth, it can dramatically disrupt Earth's geomagnetic field and ionosphere. The ensuing geomagnetic storms can result in:
Observations on the Sun's Limb
 CMEs are observed in visible light by watching the cloud of material as it
leaves the Sun; they are also observed in ultraviolet light and in X-rays
by detecting the emission from hot solar plasma in flares associated with
the ejection. At right is a series of X-ray images taken August 28, 1992
by the Yohkoh satellite. The images show a flare which occurred in conjunction
with a CME on the edge, or limb, of the visible disk of the Sun.
The images have been rotated so that north is to the right and east is
at the top of each frame. The sequence proceeds in time from top to bottom
frame, spanning nearly 3 hours. Two features of interest are (1) the X-ray
emitting (and therefore hot) structure of magnetic arches, and (2) the
dimming of the corona above the arches. It is believed that the dimming corresponds
to the removal of material (i.e., the CME). The bright magnetic arches are
formed by rearrangement of the coronal magnetic fields during the eruption.
Images prepared by Greg Slater and Hugh Hudson. Movies are available:
1.5 Mb animated GIF
and 5 Mb animated gif

Observations on the Sun's Disk
 CMEs can also be monitored closer to the center of the Sun's disk. In
particular the Soft X-ray Telescope (SXT) on the Yohkoh solar observatory
satellite can make images of the magnetic structures before, during, and
after a CME. The CMEs which occur near the middle of the Sun's disk are
potentially more problematic for conditions on the Earth than those which
erupt from the Sun's limb, because the ejected material is aimed more
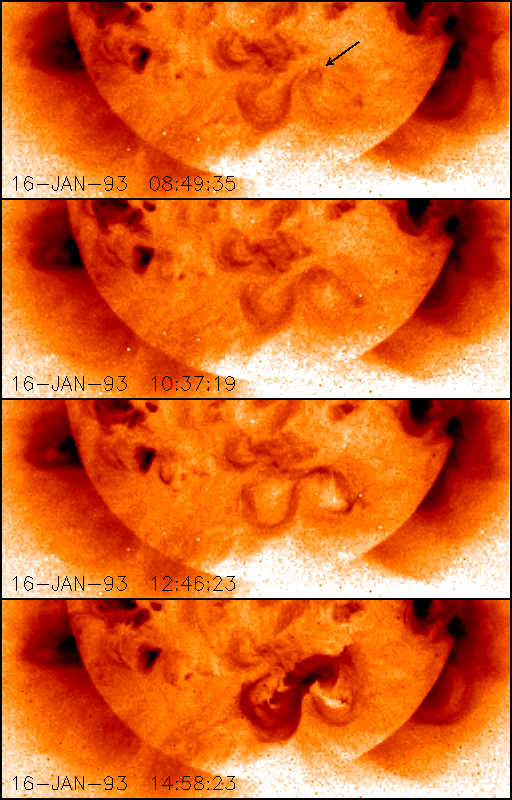
directly at the Earth. At right are SXT images of an active solar region
which produced a CME on January 16, 1993. As the images show, the
eruption occurred when the region was just to the south of disk center;
the material arrived at Earth and generated geomagnetic storms a few days
later.
Images prepared by Hugh Hudson and David McKenzie.
Larger image also available: 1024x1600
pixels, 729 kbyte.
Sophisticated theoretical models have been constructed which simulate the eruption of CMEs. By varying the vantage point of the viewer, the models can depict eruptions at the limb or at the disk. Provided by Sarah Gibson and BC Low.

Summary of the New Results
Predicting CMEs: "S" marks the spot
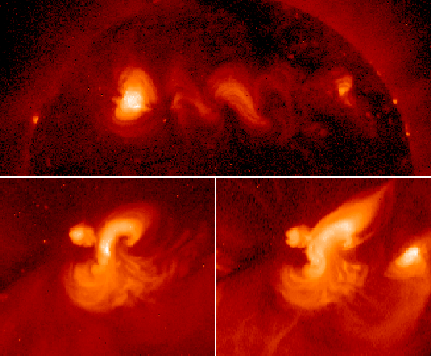
Because of the potential effects of Earth-directed CMEs, one would like to have tools with which to predict CME occurrence. A feature that has been found to be common to many eruptions is an "S" shaped structure of the CME-producing solar active region before the eruption takes place. Two papers describing how sigmoids tend to lead to eruptions are: Sterling and Hudson (1997, Astrophysical Journal (Letters), vol. 491, page L55) and Hudson et al. (1998, Geophysical Research Letters, vol. 25, No. 14, page 2481). The "S" shape -- or sigmoid -- can be seen in the above image of the 16-Jan-93 eruption. Two sigmoids are in the upper panel; a distinctively bright one is in the lower left panel. The sigmoid structure can often be observed for several days before the occurrence of an eruption; this can be seen in the movie linked below. The theoretical models illustrate -- even predict -- this precursor structure. Now, the statistical study by Canfield, Hudson, and McKenzie shows that the sigmoid shape can be used as a reliable indicator of the likelihood that an active region will erupt. Additionally, the study links eruptive probability to the size of the region.
It is still not possible to predict exactly when a given region will produce a CME. However the new findings allow astronomers and space weather specialists to predict the probability of space storms in much the same way that meteorologists predict weather on Earth. Images prepared by Hugh Hudson and David McKenzie.
For a copy of the Canfield et al. paper, contact Harvey Leifert of the American Geophysical Union at hleifert[-a-]agu.org.
Some related images:
Contact Information
For more information, please contact
Last updated on April 12, 1999, by David McKenzie