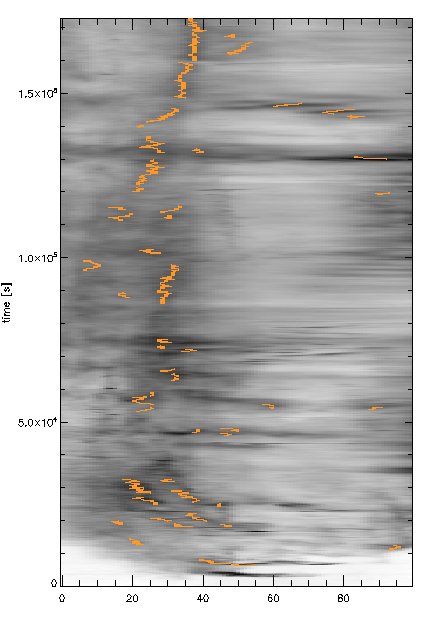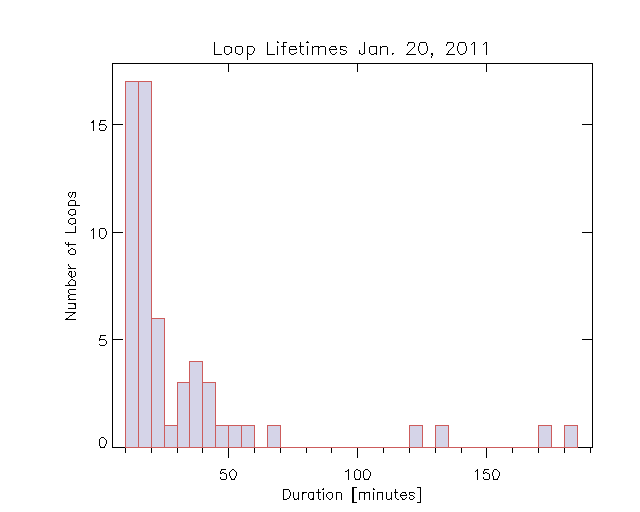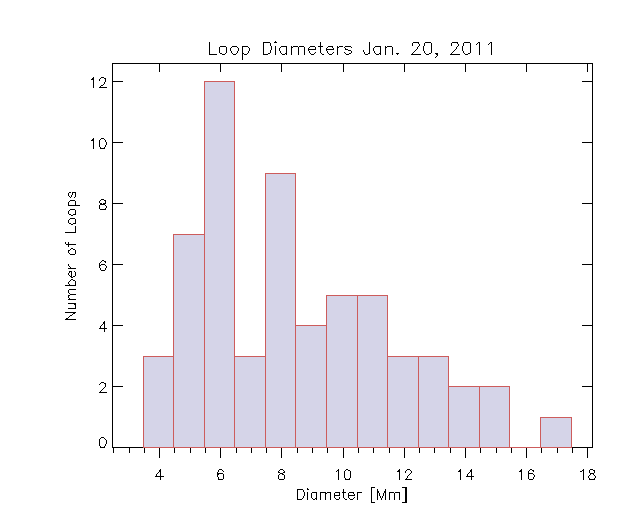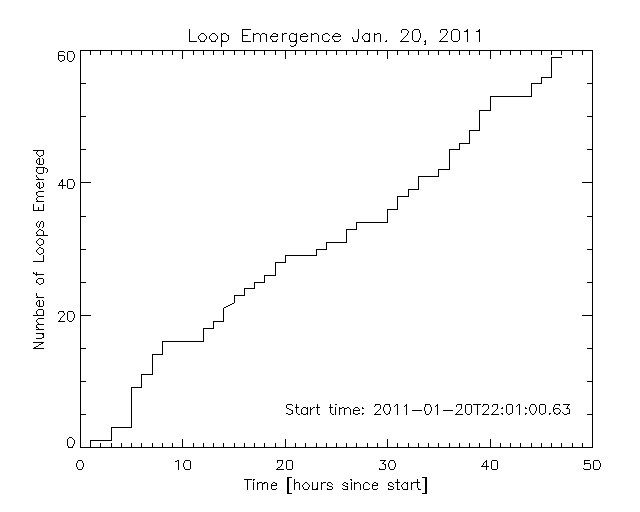
This week, I used the output from Marika's analysis codes in order to create useful graphs of interconnecting loop characteristics. There were 59 detected loops after I went through and threw out data the program identified that didn't appear to be an interconnecting loop. One point of interest was looking at a delay between emergence and reconnection. In the 2005 paper there was a clear 24 hour delay, a period of reconnection, and then a plateau. In the plot of loop emergence that I obtained this week, there doesn't seem to be a delay, and loops are still connecting very late in the data set (40+ hours after the event begins).


