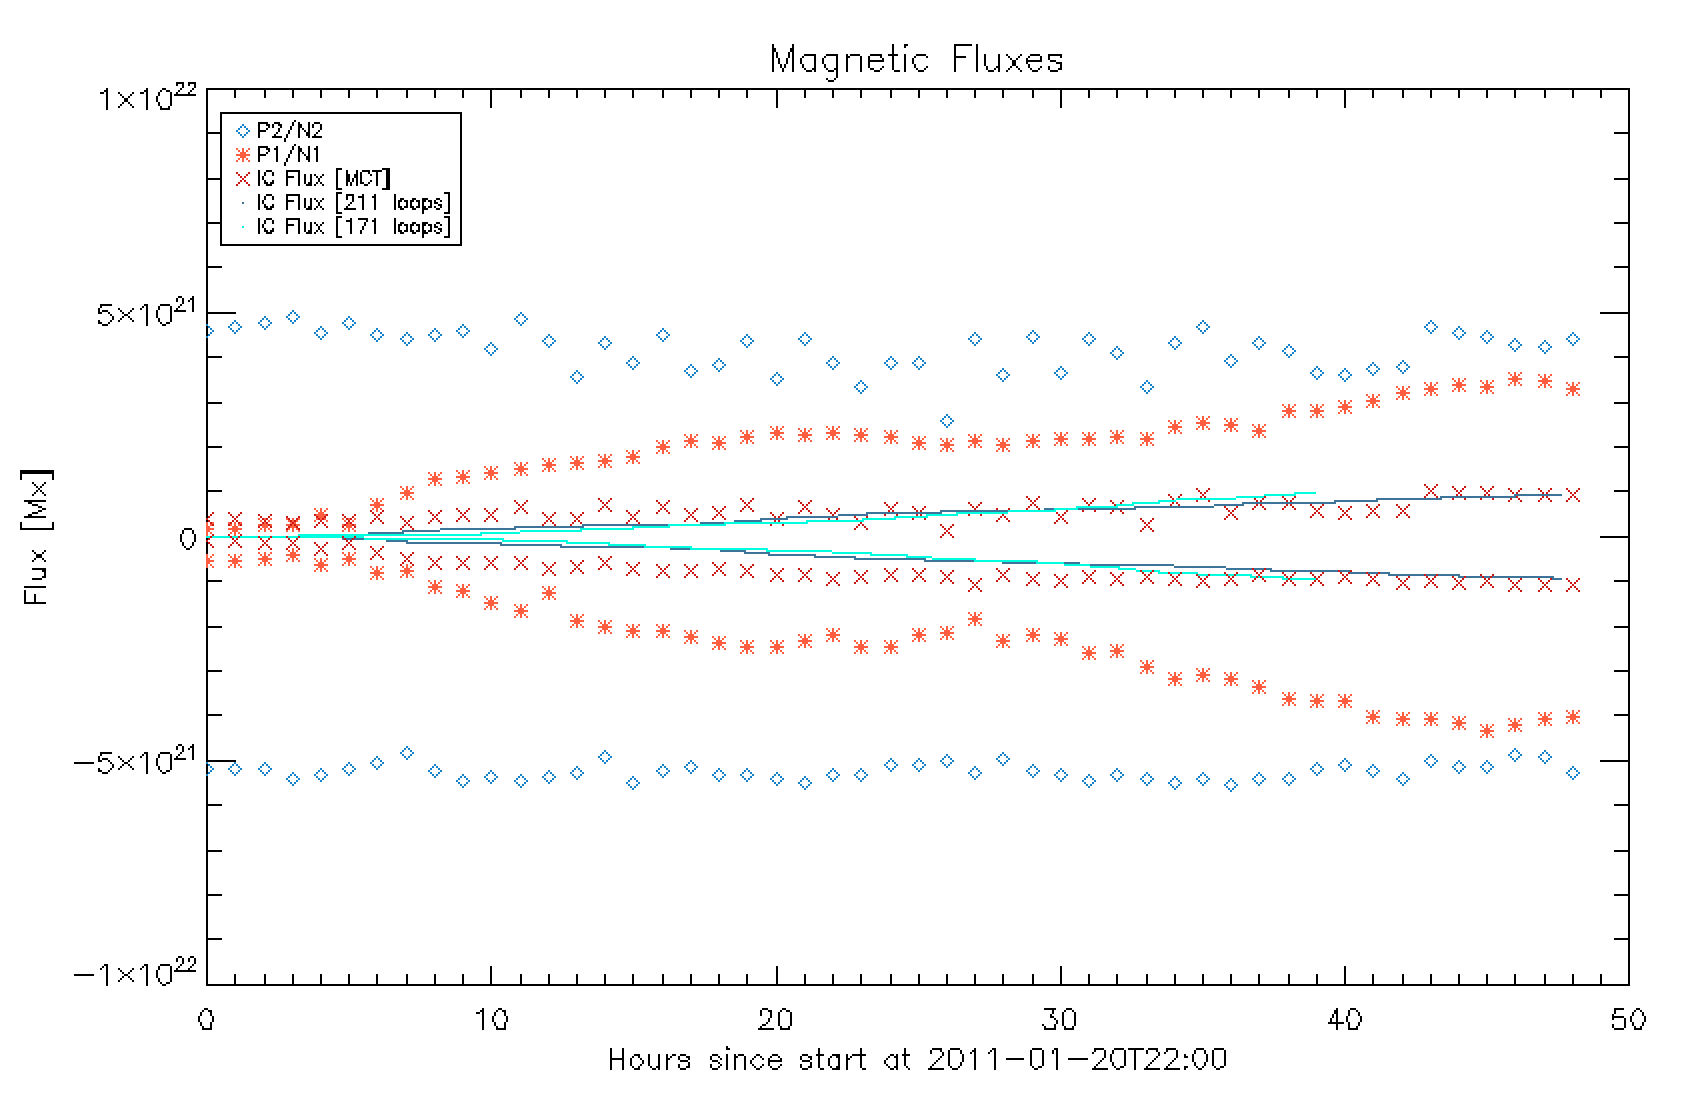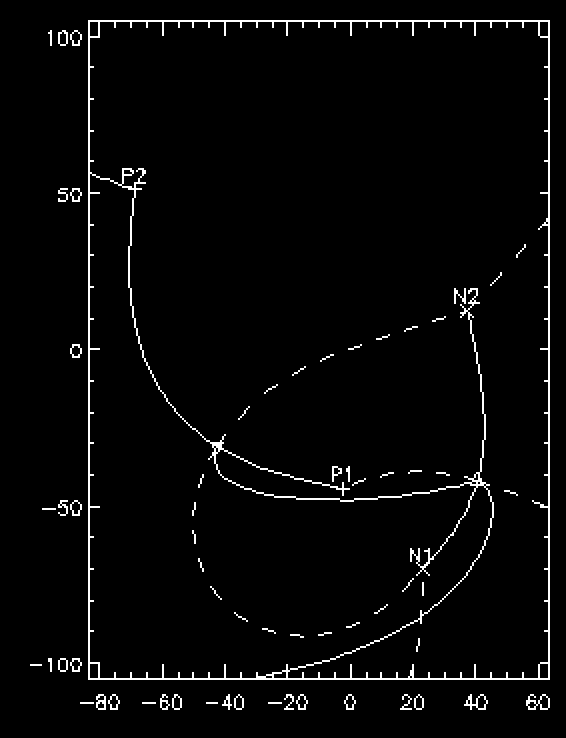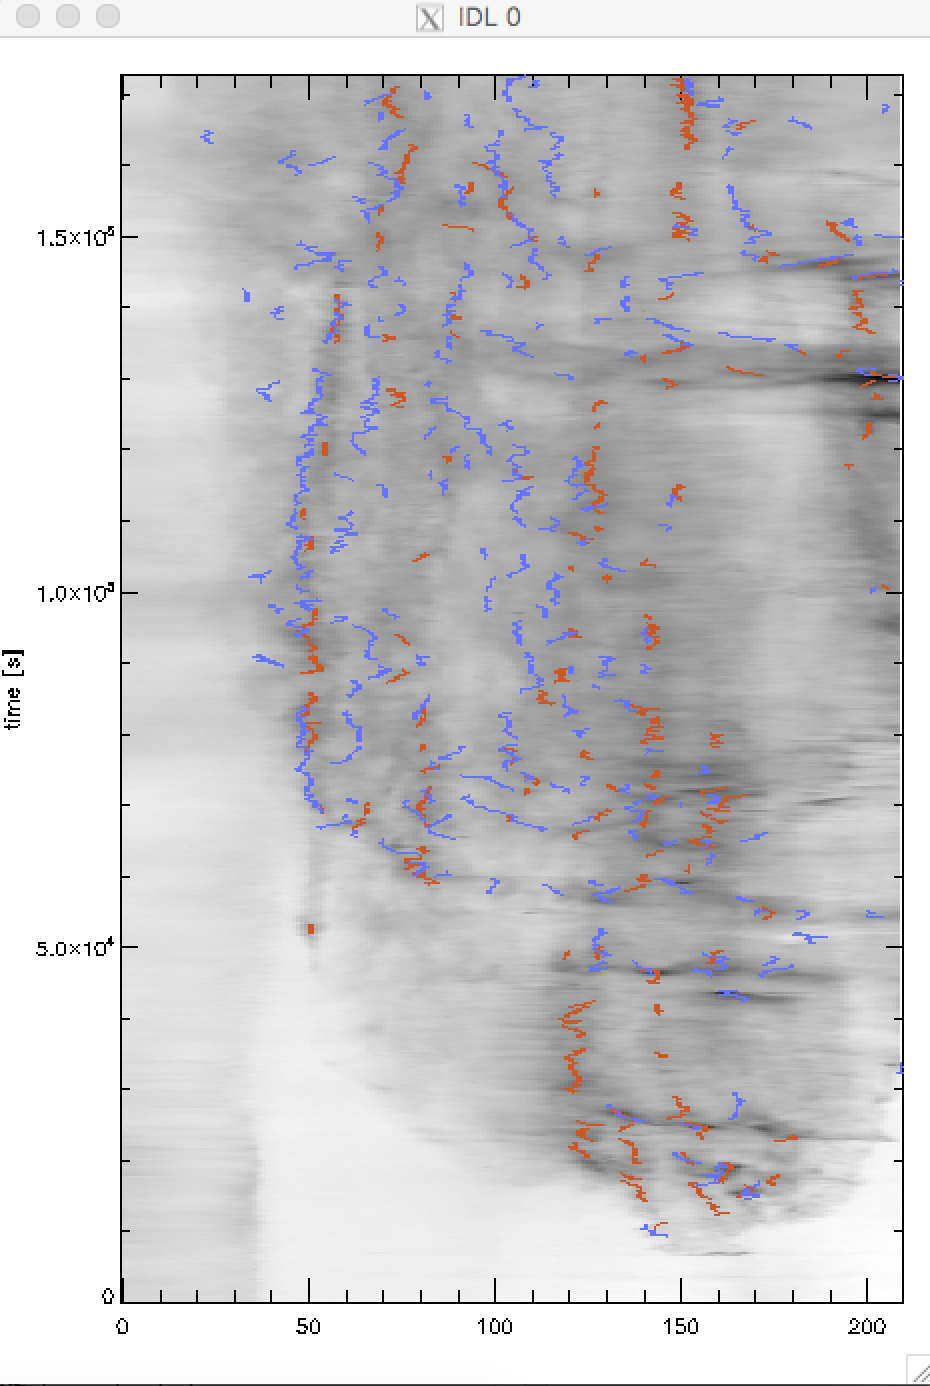
This week I worked on creating a plot of interconnecting flux using the MCT model. I also was able to retrieve three-dimensional images of the topology for the simplified quadrupole model of case 1. I expanded the slit width for the 211 data by about 200 pixels, which added almost 100 loops to the 211 data (59 loops to 151 loops)! There are many more examples of cooling and heating in the new overlaid stackplot. Now that the REU program is coming to it's last few weeks, I will begin to take some time to make my codes more streamlined and user-friendly as well as write a readme file explaining how to use them.


