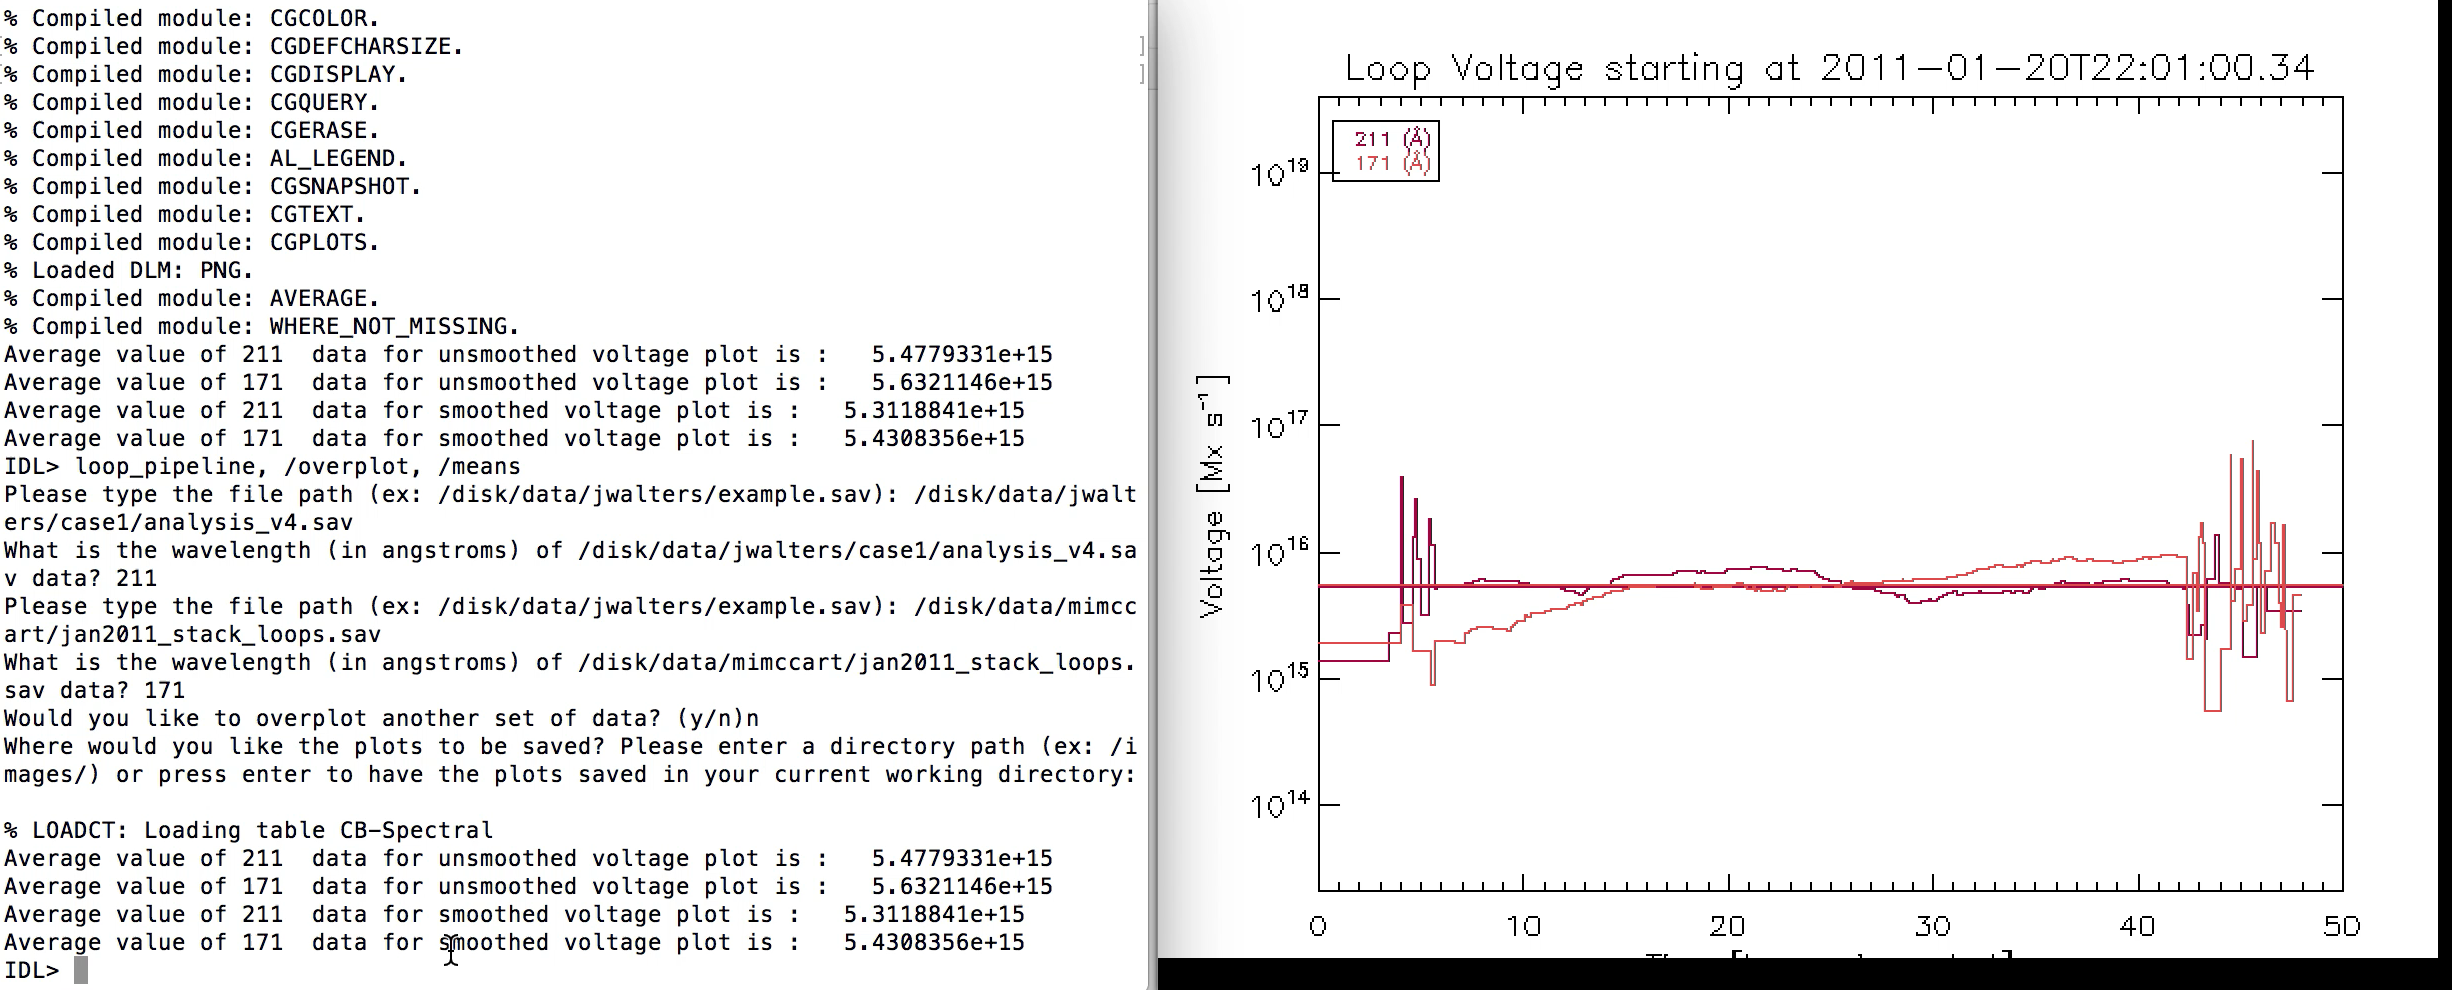
The final product of this week's work is loop_pipeline_elaborate.pro, a program that creates graphs of loop emergence, cumulative area, flux, voltage (both smoothed and unsmoothed) and histograms of duration and diameter. It is user-friendly, and with the OVERPLOT keyword, many different wavelengths can be plotted together. I used this program to re-do the comparison plots I had created for the midterm presentation between 171 angstrom and 211 angstrom data for case 1 (since I now have an expanded stack for 211 angstrom data with almost 100 more identified loops).
