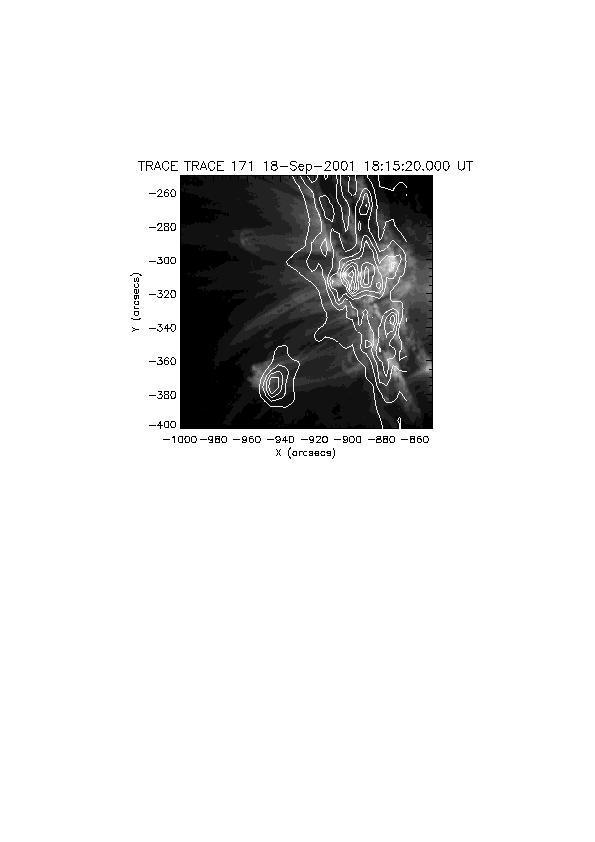
A. .map files are made of each t he TRACE data and the CDS (SoHO) data
using index2map on the calibrated data sets
B. plot_map was used to display the .map files and overlay images
1. the Trace pointing was found to be 10 arc sec off (both x,y directions) of the CDS
pointing this was corrected in the data
C. by overlaying the maps a correlation between the two can be made
we can see where the cds data (ion intensity maximums) is on the TRACE map
The plan is to use the correlation to obtain similar data from TRACE
