I. Intensity maximums
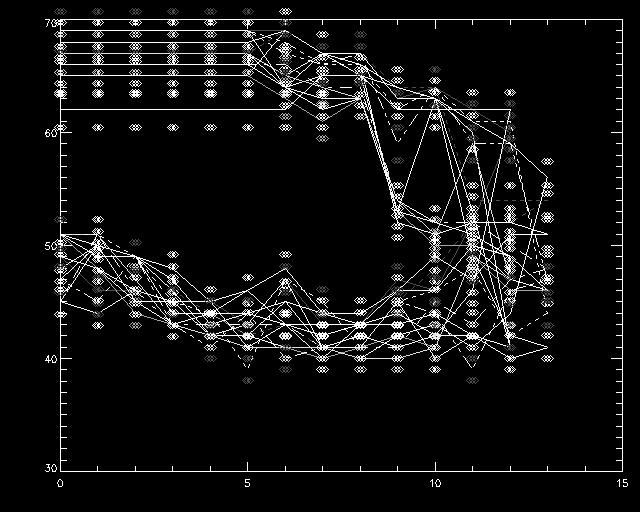
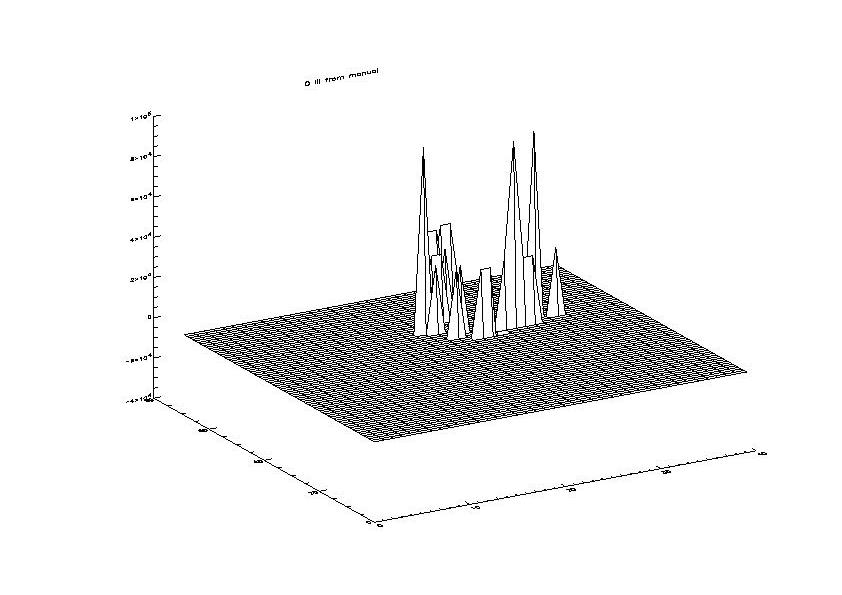
A. from the generated maximums a plot of the maximums
as a function of x,y was made for each wavelength
1. this was done by creating a small program (plotloopall ) that would plot the maximums for all wavelengths
a. then any wavelength could be compared with any other or group vs. group
1. this was done by creating a small program (plotloopall ) that would plot the maximums for all wavelengths
a. then any wavelength could be compared with any other or group vs. group

II. Doppler shifts
A. from fitline the observed wavelengths of all the maximum intensity pixels for each ion were recorded
B. this observed wavelength was used along with the initial (real) wavelength and C (speed of light) to determine shifted velocity
V(shifted velocity)= ((observed - initial wavelength) / initial ) * C
if V > 0 then red shift
V < 0 then blue shift
C. the Velocity shift value was then plotted as a function of x,y using another small program dopplot

III.
Overlaying images
getting the info | start | overlay