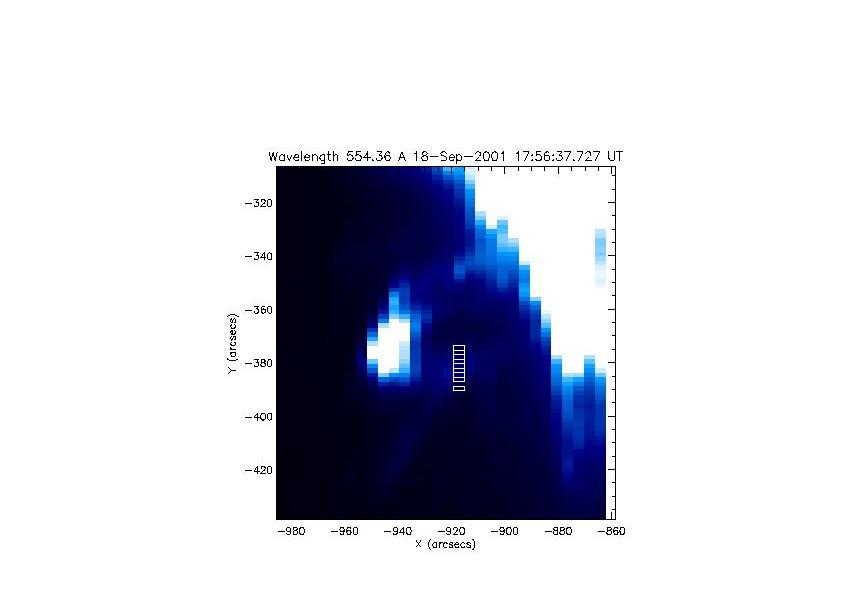
3. once the correct pixels and hatches are selected it
is time to analyze the each selected pixel in all 13 wavebands
a. hatches
are goups of pixels with the same x value that span the loop
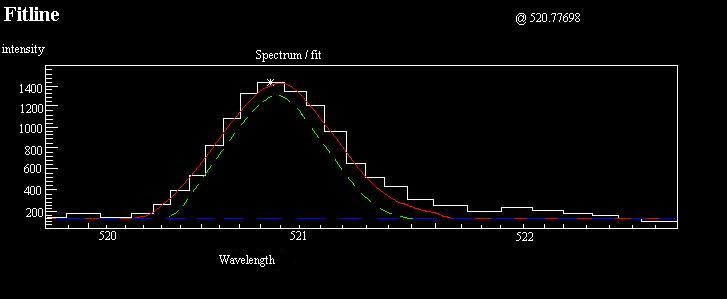
C. a program called fitline,x,y is used to
determine the spectral line intensities for the selected pixels
1. each selected
pixel is run through each of the 13 .ana files
a. for each of the wavebands a peak wavelength , peak intensity
, Full width half mass, total intensity and uncertainty are
produced
for each ion
b. this data is then
saved into a file containing, in the end, this information for each
wavelength or ion
the resulting data set looks like this:
ion(wavelength) observed
total intensity
% error
wavelength
Si XII(520.665)
520.812 636.08200000
10.79713100
O IV(554.513)
554.568 99.47880000
5.37056570
Fe XVI(360.761)
360.737 3278.85000000
21.14618700
Mg IX(368.070)
368.060 636.56500000
9.94645060
Mg X(624.941)
625.025 458.81900000
8.97660300
O V(629.732)
629.844 224.48000000
6.89293910
Ne VI(562.803)
562.952 107.80500000
5.03164290
Fe X(345.723)
345.742 40.58470000
3.79447710
Si IX(345.124)
345.052 57.09360000
5.36203050
Fe XIII(348.183)
348.162 77.74250000
6.06145260
Si X(347.403)
347.410 53.76150000
4.67036480
He I(584.334)
584.343 80.18290000
4.29280600
Fe XIV(353.831) 353.843
8.65570000
1.15724750
Si X(356.012)
356.026 191.96500000
8.22727350
O III(599.597)
599.555
7.72323000 1.83300370
00000000000000000000000000000000000000000000000000

