CCD dark calibration using CCD bakeout
20-Dec-2017 : prepared by Aki Takeda
16-Jan-2018 : added images and plots.
7-Feb-2020 : added readings of v-slope.
Motivation
Check CCD performance after 10 years of on-orbit operation.
The previous on-orbit calibration
was performed in 2008.
The goal of the coming calibration:
- Temperature variation of the dark current level.
- Dark current level accumulated during the period of charge transfer
(8 sec for the whole CCD).
- Calculation of the charge transfer efficiency (turned out unable to
derive from the 2017 data due to short exposure time. link to
the 2018-2019 data analysis page .
Operation sequence
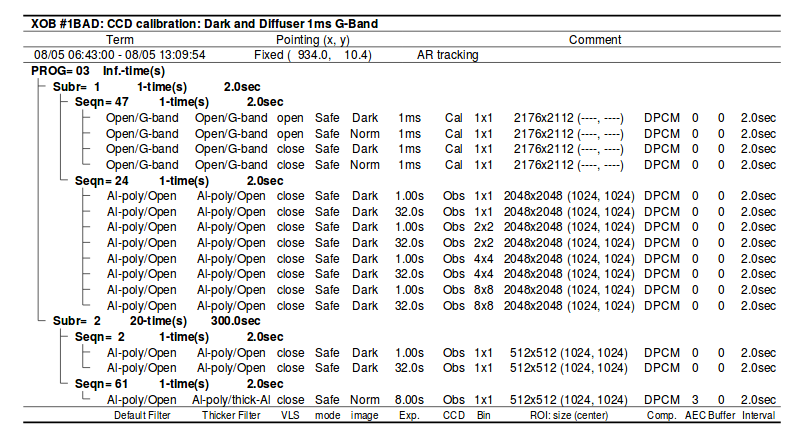
- 2017/8/5 06:43:00 : CCD cal program (XOB#1BAD) start.
- 2017/8/5 07:09:54 : CCD bakeout heater on (72 hours).
- 2017/8/5 13:09:54 : CCD cal program stop.
- 2017/8/8 07:09:54 : CCD bakeout heater off.
- 2017/8/8 13:26:00 : 4-quadrant observations started.
Note:
- Exposure time for dark images does not correctly appear
in the EXPTIME tag in FITS headers. You should use the
EXCCDEX tag instead.
Data Analysis
What you need to know for data analysis:
XRT CCD basics.
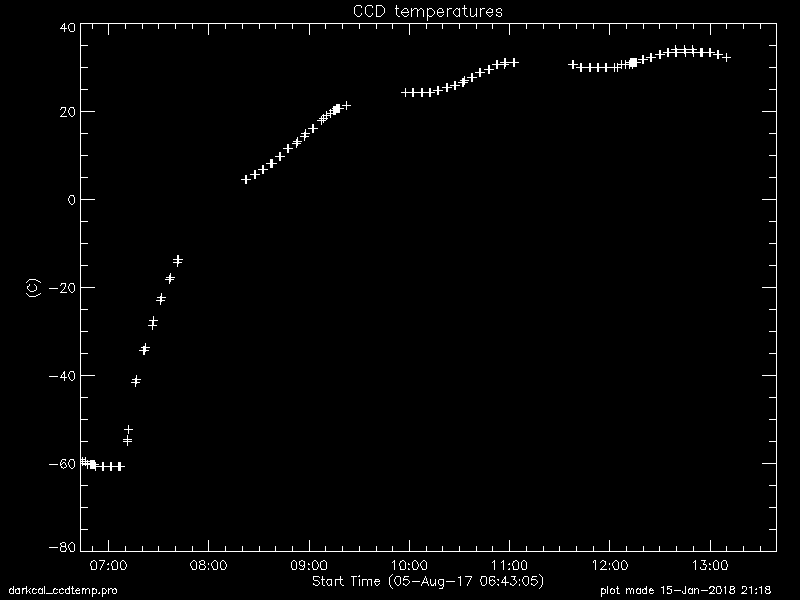
Variation of CCD temperature
(click plot to enlarge)
Obtained images
Full_res Cetner 512x512 Short
(Seqn. 2 of XOB#1BAD)
Full_res Cetner 512x512 Long
(Seqn. 2 of XOB#1BAD)
Full_res Cetner 512x512 Normal
(Seqn. 61 of XOB#1BAD)
Full-CCD readout Short
(Seqn. 24 of XOB#1BAD) --- all size rebined to 512x512.
Full-CCD readout Long
(Seqn. 24 of XOB#1BAD) --- all size rebined to 512x512.
Cal_image 2716x2112 Dark
(Seqn. 47 of XOB#1BAD)
Cal_image 2716x2112 Normal
(Seqn. 47 of XOB#1BAD)
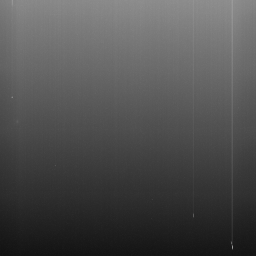
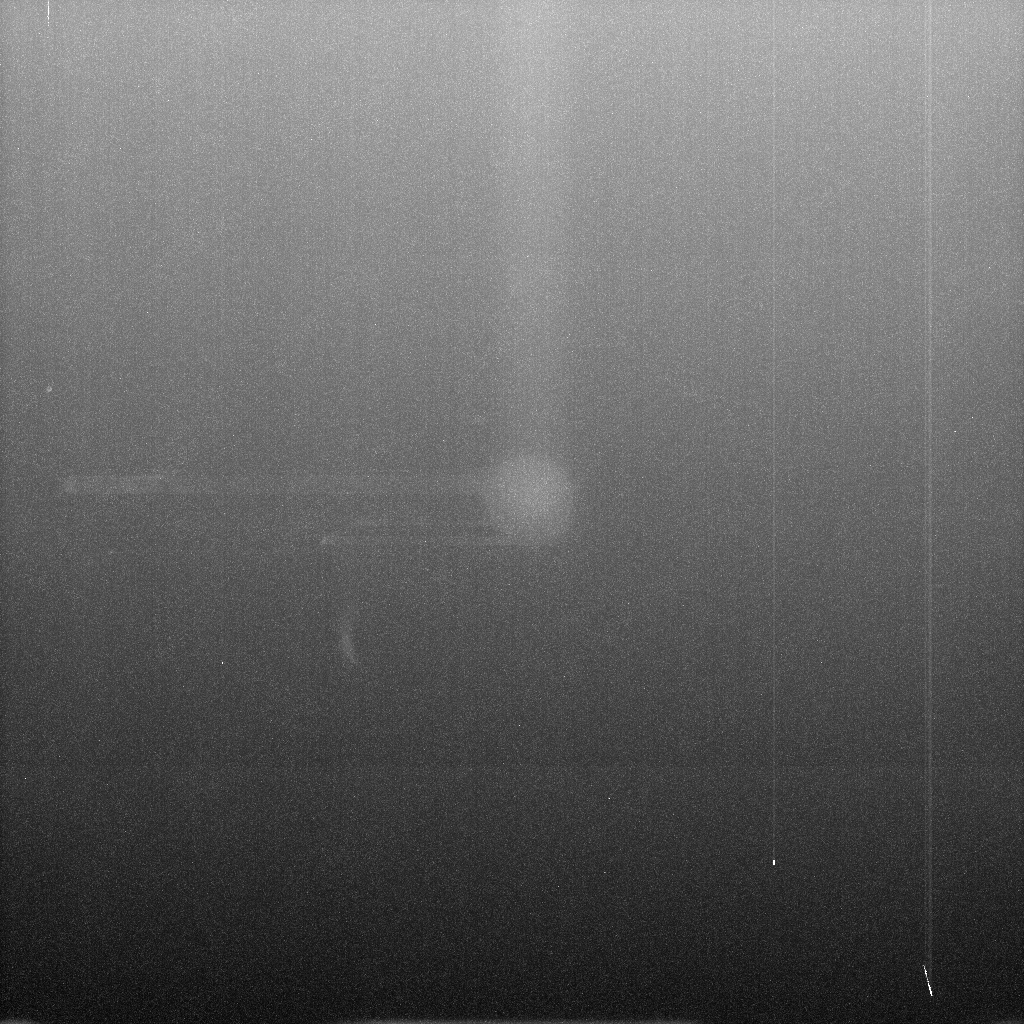
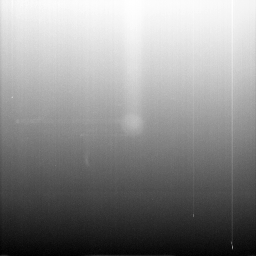
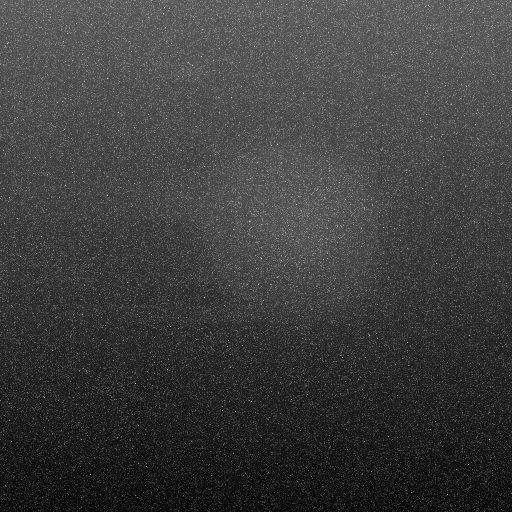
Typical pattern (click image to enlarge)
5-AUG-2017 09:15:01
full-CCD 1024x1024(pix),
1.04800(sec), 20.1868(C)
|
5-AUG-2017 12:09:17
full-CCD 2048x2048(pix),
1.04800(sec), 30.6163(C)
|
5-AUG-2017 11:02:04
center ful-res 512x512(pix),
1.04800(sec), 31.1968(C)
|
|
|
|
- Expected patterns
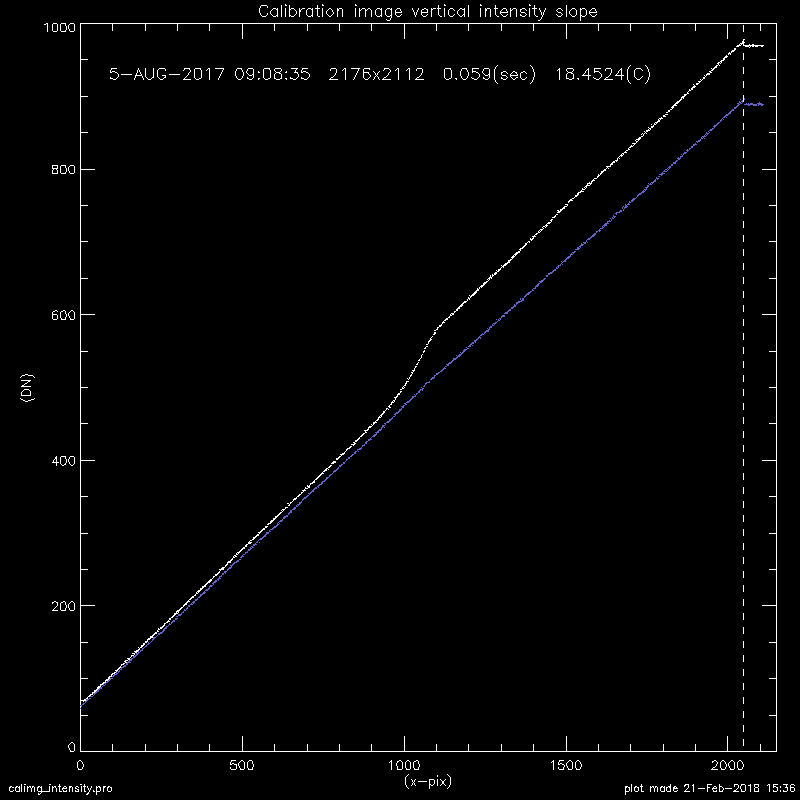
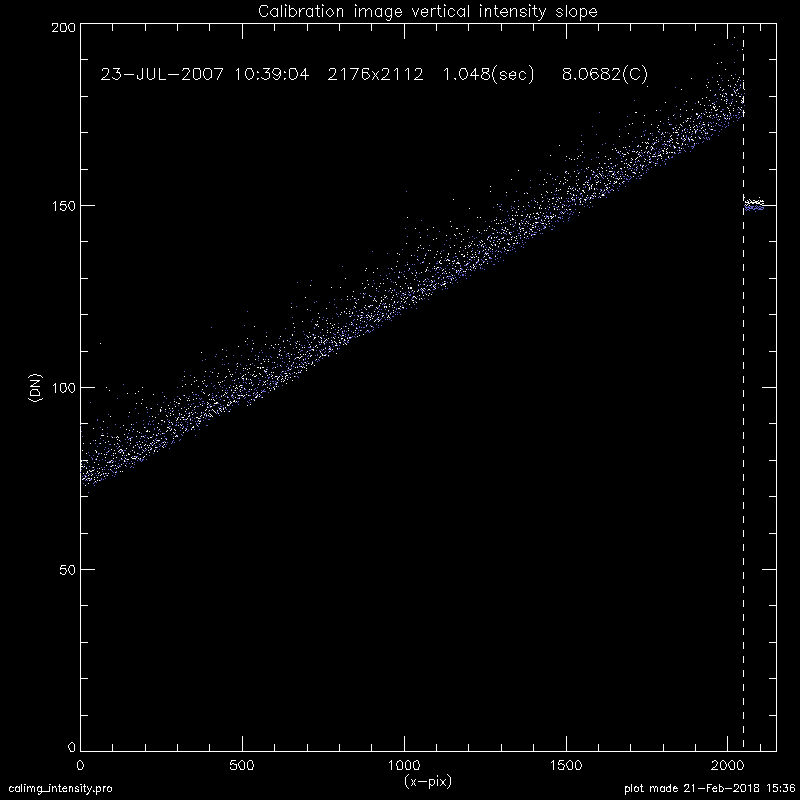
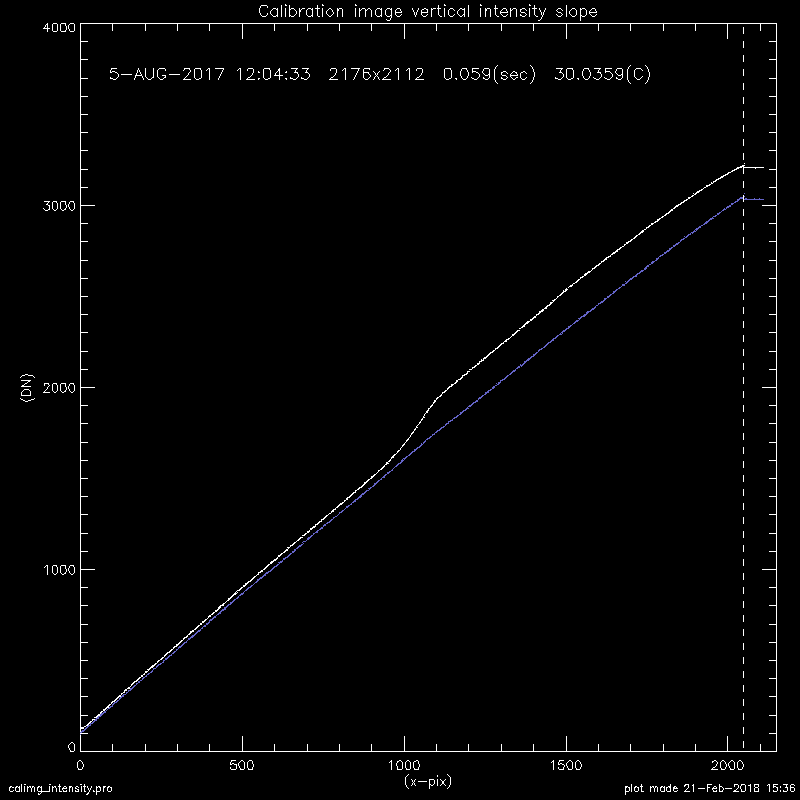
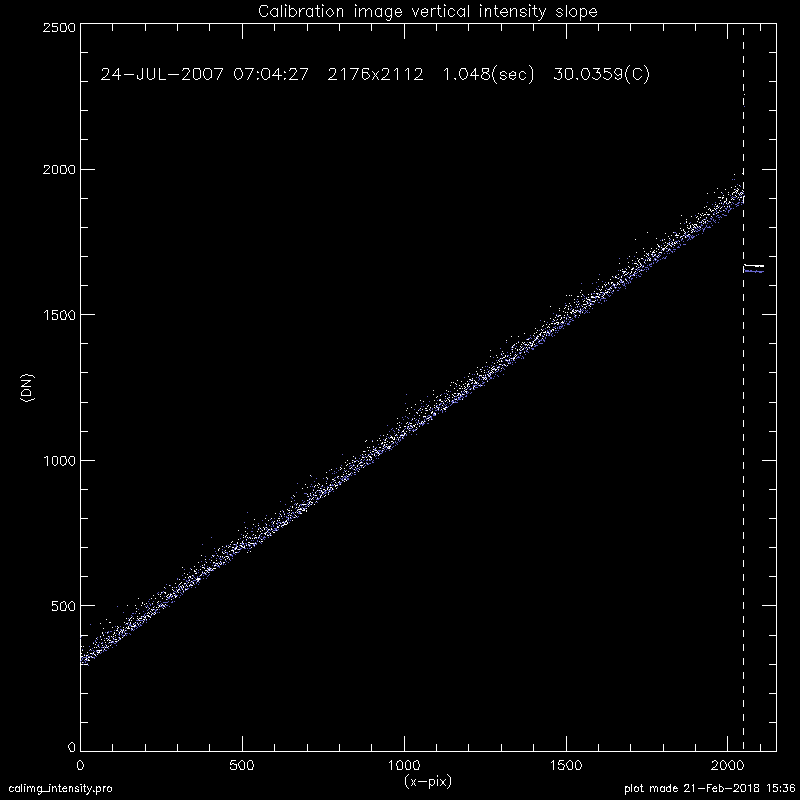
- vertical intensity slope :
plot 1,
plot 2,
plot 3.
- 4 rectangular segments
- persistent hot pixels (at lower right)
- temporal hot pixels
- New patterns
- white blob at the CCD center
- horizontal extension from the blob
CCD count variations
CCD count v.s. Time
(×: 1.0sec data, ◊: 32.0sec data)
CCD count v.s. CCD Temp.
CCD normalized count v.s. CCD Temp.
--- 32sec data are not suitable for analysis due to partial saturation.
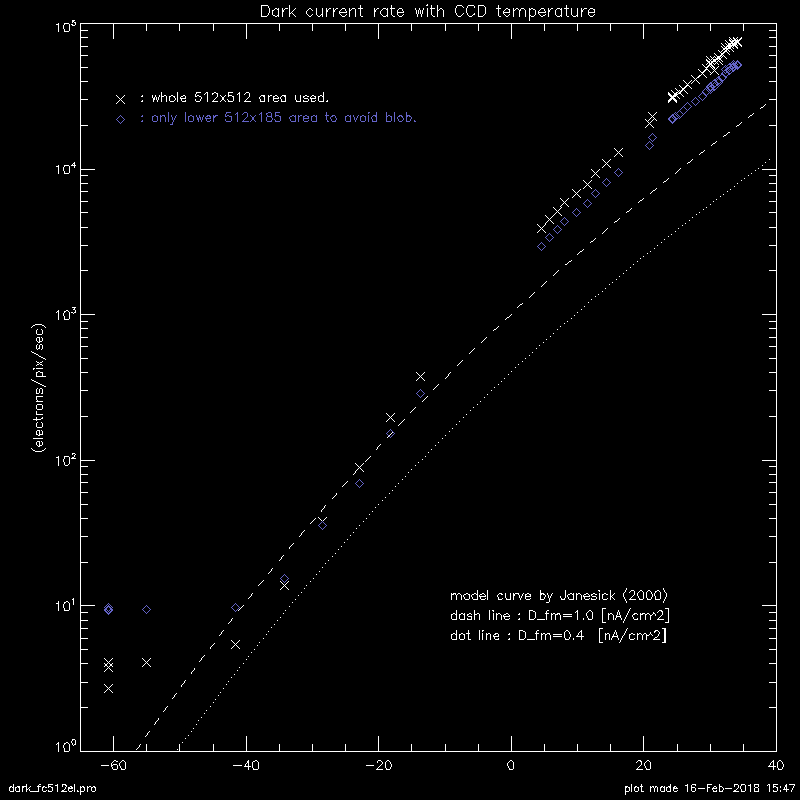
Dark electrons v.s. CCD Temp.
Dark electrons v.s. CCD Temp.
--- use only area (512x185) lower than the blob.
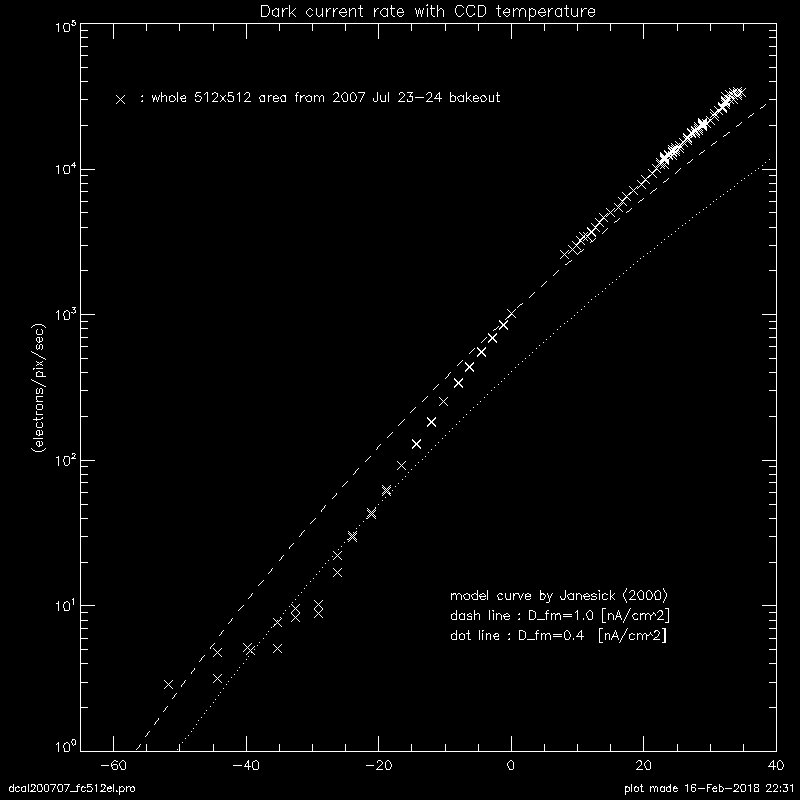
Comparison with 2007 (7/23-24) bakeout data
(click image to enlarge)
Comparison of Dark electrons v.s. CCD temperature.
(click image to enlarge)
Comparison of vertical slope of calibration images.
- This CCD takes 8 seconds to readout the whole region,
regardless of the exposure time of the image.
- Vertical slope of the dark current reflects the amount of
dark current accumulated during the CCD readout.
(Upper area of the CCD spends more time before reaching to
the serial register located at the bottom of the CCD.)
- The dark current accumulated during the exposure is added
to the slope and observed as the signal of the calibration images.
(click image to enlarge)
- blue line : 21 pix around x=512
- white line : 21 pix around x=1024
Calculation of dark current produced during charge transfer (8 sec):
| date | CCD temp. | exp time |
x pos. | a: DN @ y=0 | b: DN @ y=2050 |
(a-b)/8 |
| 2017/08/05 | 30(C) | 0.059(sec) |
512 | 100 | 3050 | 368.8 (DN/sec) |
| 2007/07/24 | 30(C) | 1.048(sec) |
512 | 300 | 1900 | 200.0 (DN/sec) |
Results
- New patterns on hot CCD images in 2017 (white blob + horizontal
extension) have about 10% higher values of the dark current than the
area without patterns (for both CCD temp. at 18C and 30C cases).
- Dark current produced during charge transfer (8 sec) at 30(C)
was increased from 200 DN/sec (in 2007) to 369 DN/sec (in 2017).
Below are written before Kano-san's comments.
- new patterns on hot CCD images (white blob + horizontal extension),
suggest sensitivity degradation around the CCD center.
- vertical slope of the dark image became steeper than in 2007:
at CCD temp=30C, the value range between lower and upper edges is
[600-3400] in (DN/sec), while it was [350-1900] (DN/sec) in 2007.
- dark current (DN/pix/sec) above 0(C) is about 2 times larger
than the values in 2007.
- I can't still see how to analyse CAL images for CTR estimation
(need to ask Kano-san).
- I am not sure if the index.exccdex values are true for calibration
images. 2017 cal-images show 0.059 sec as exposure time, but the counts
are similar to 1 sec data (does anyone know?).


