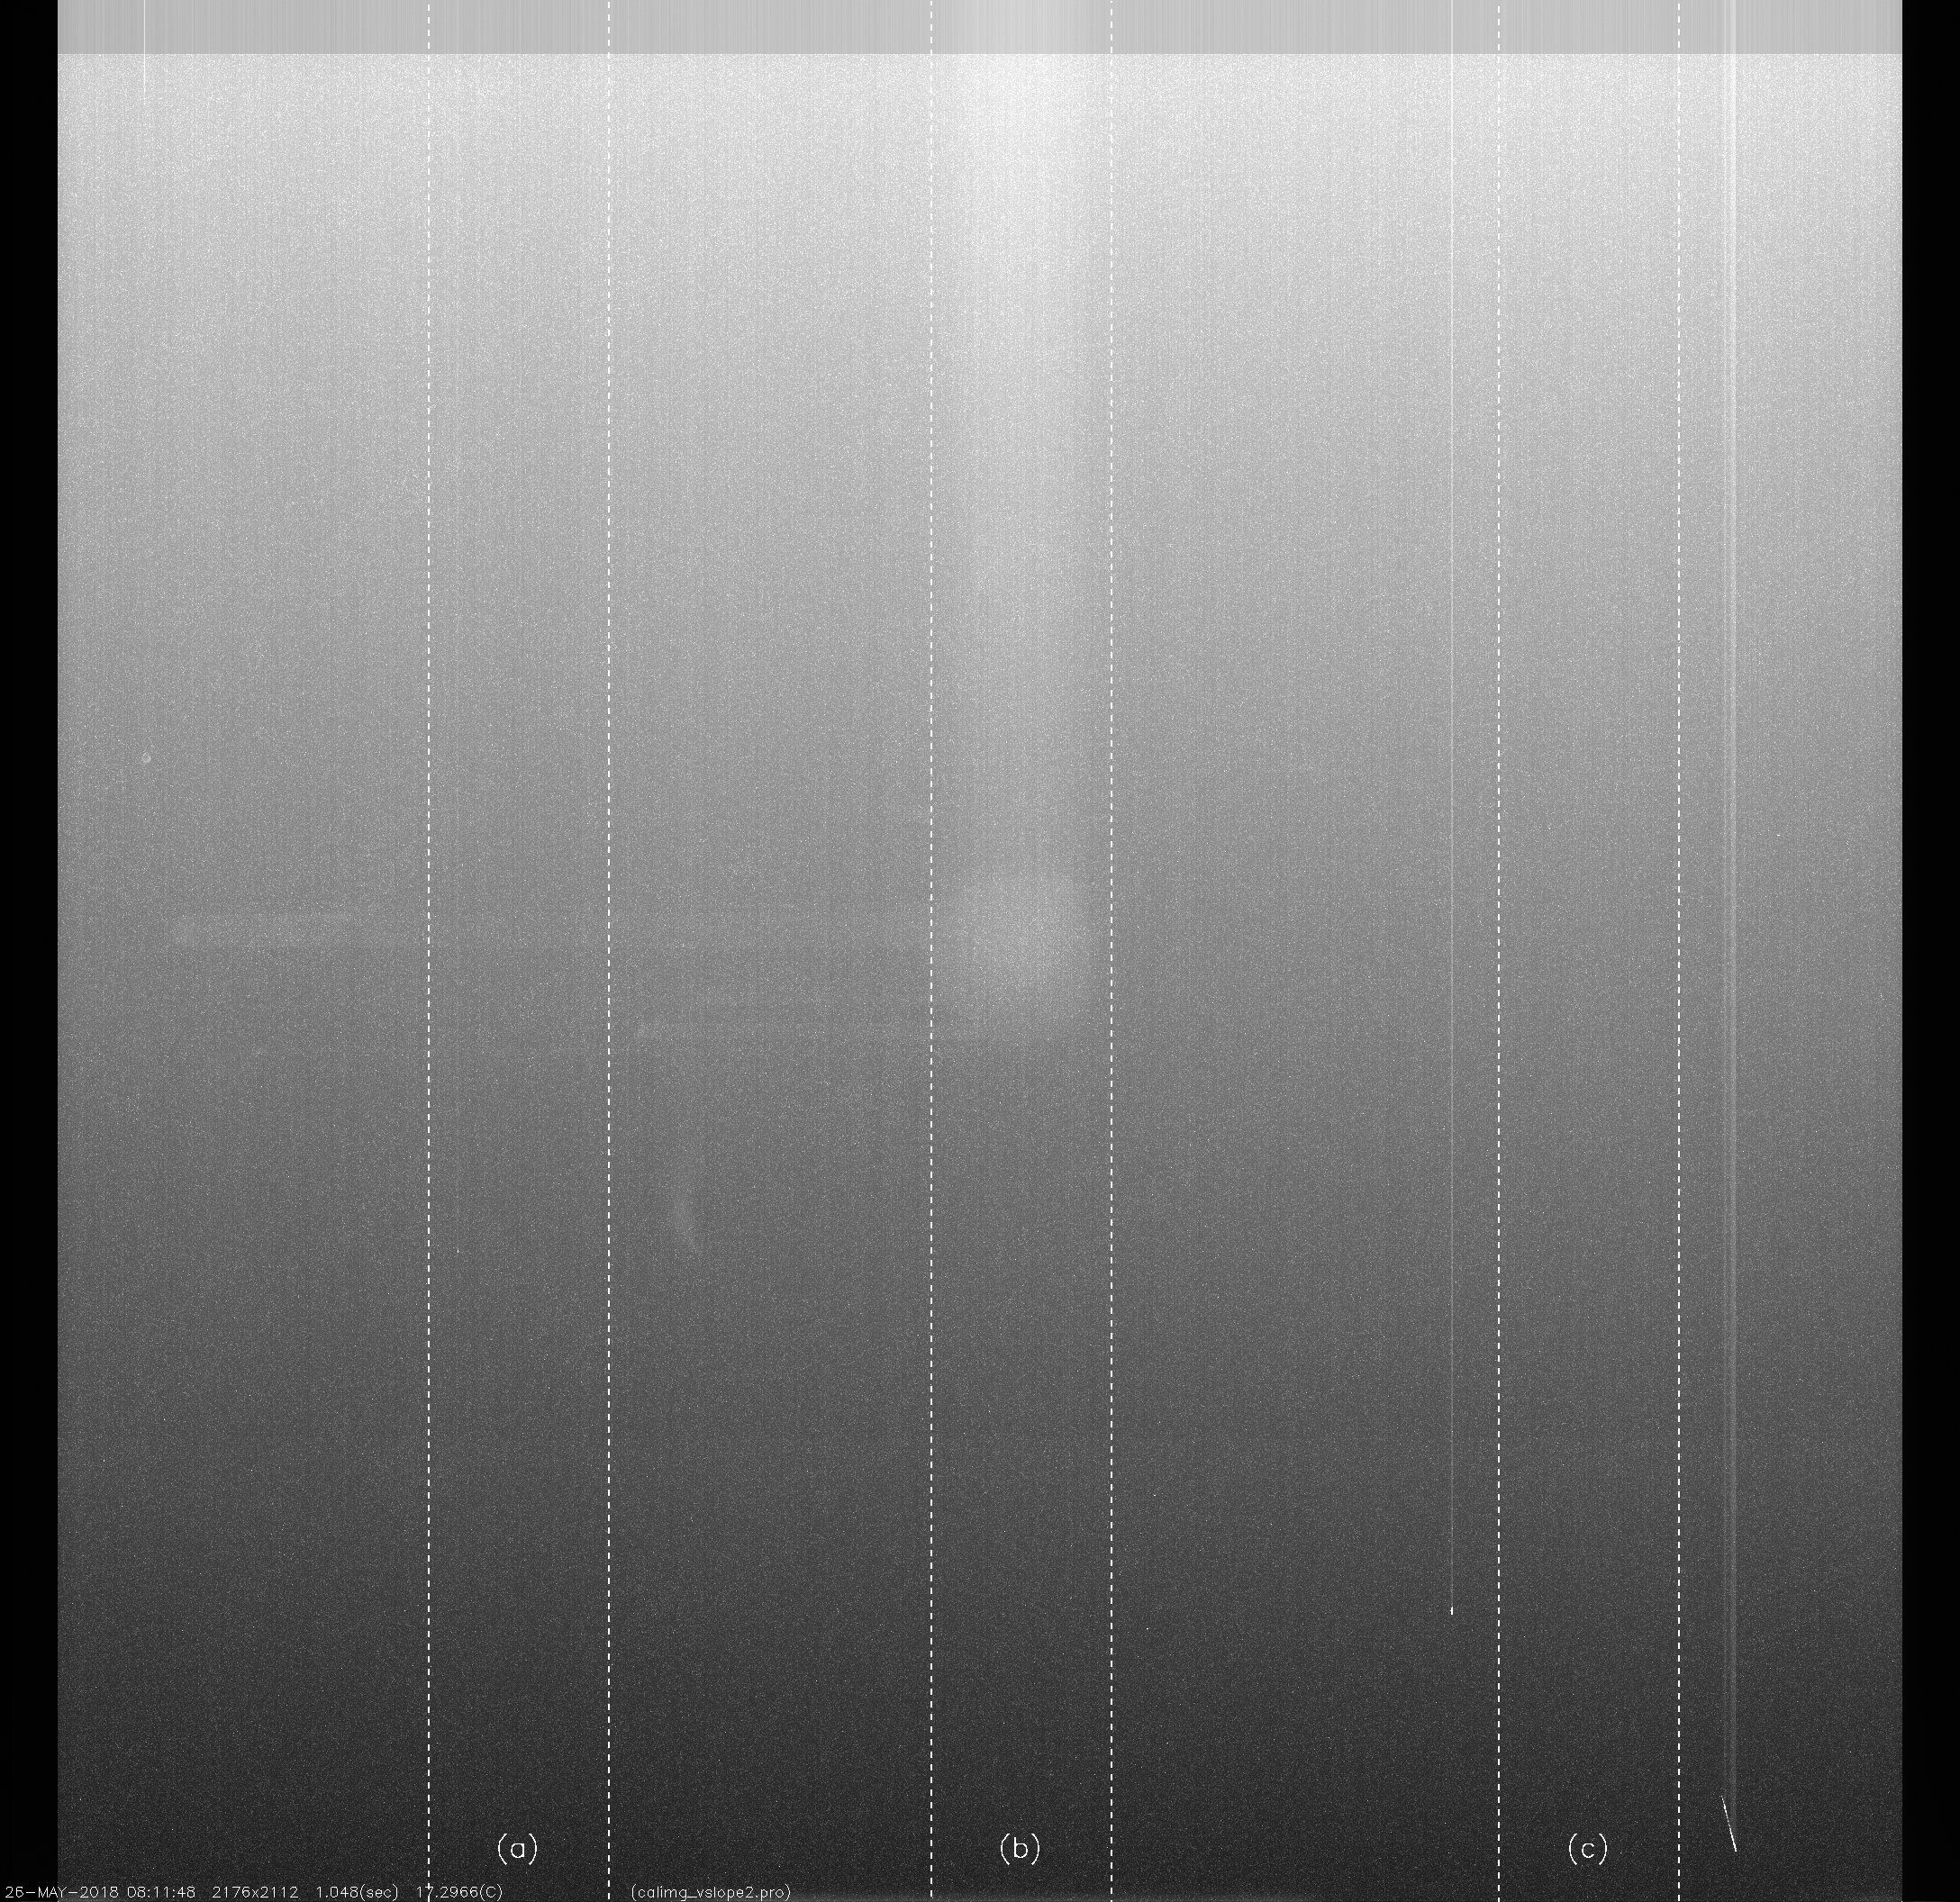
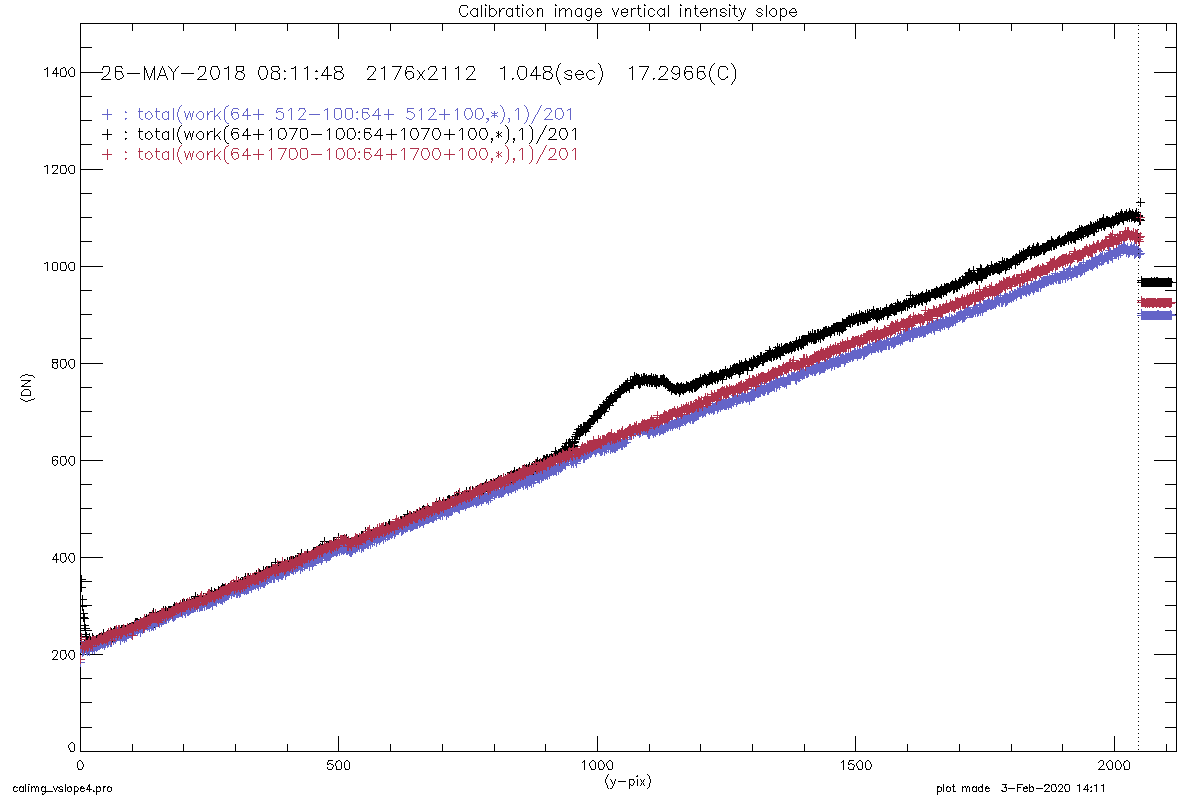
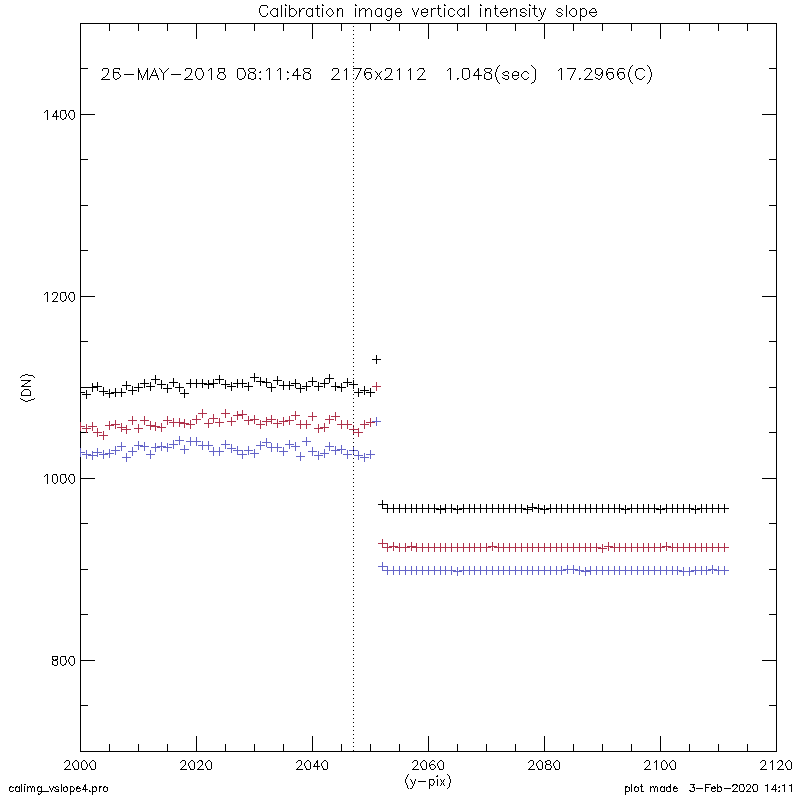
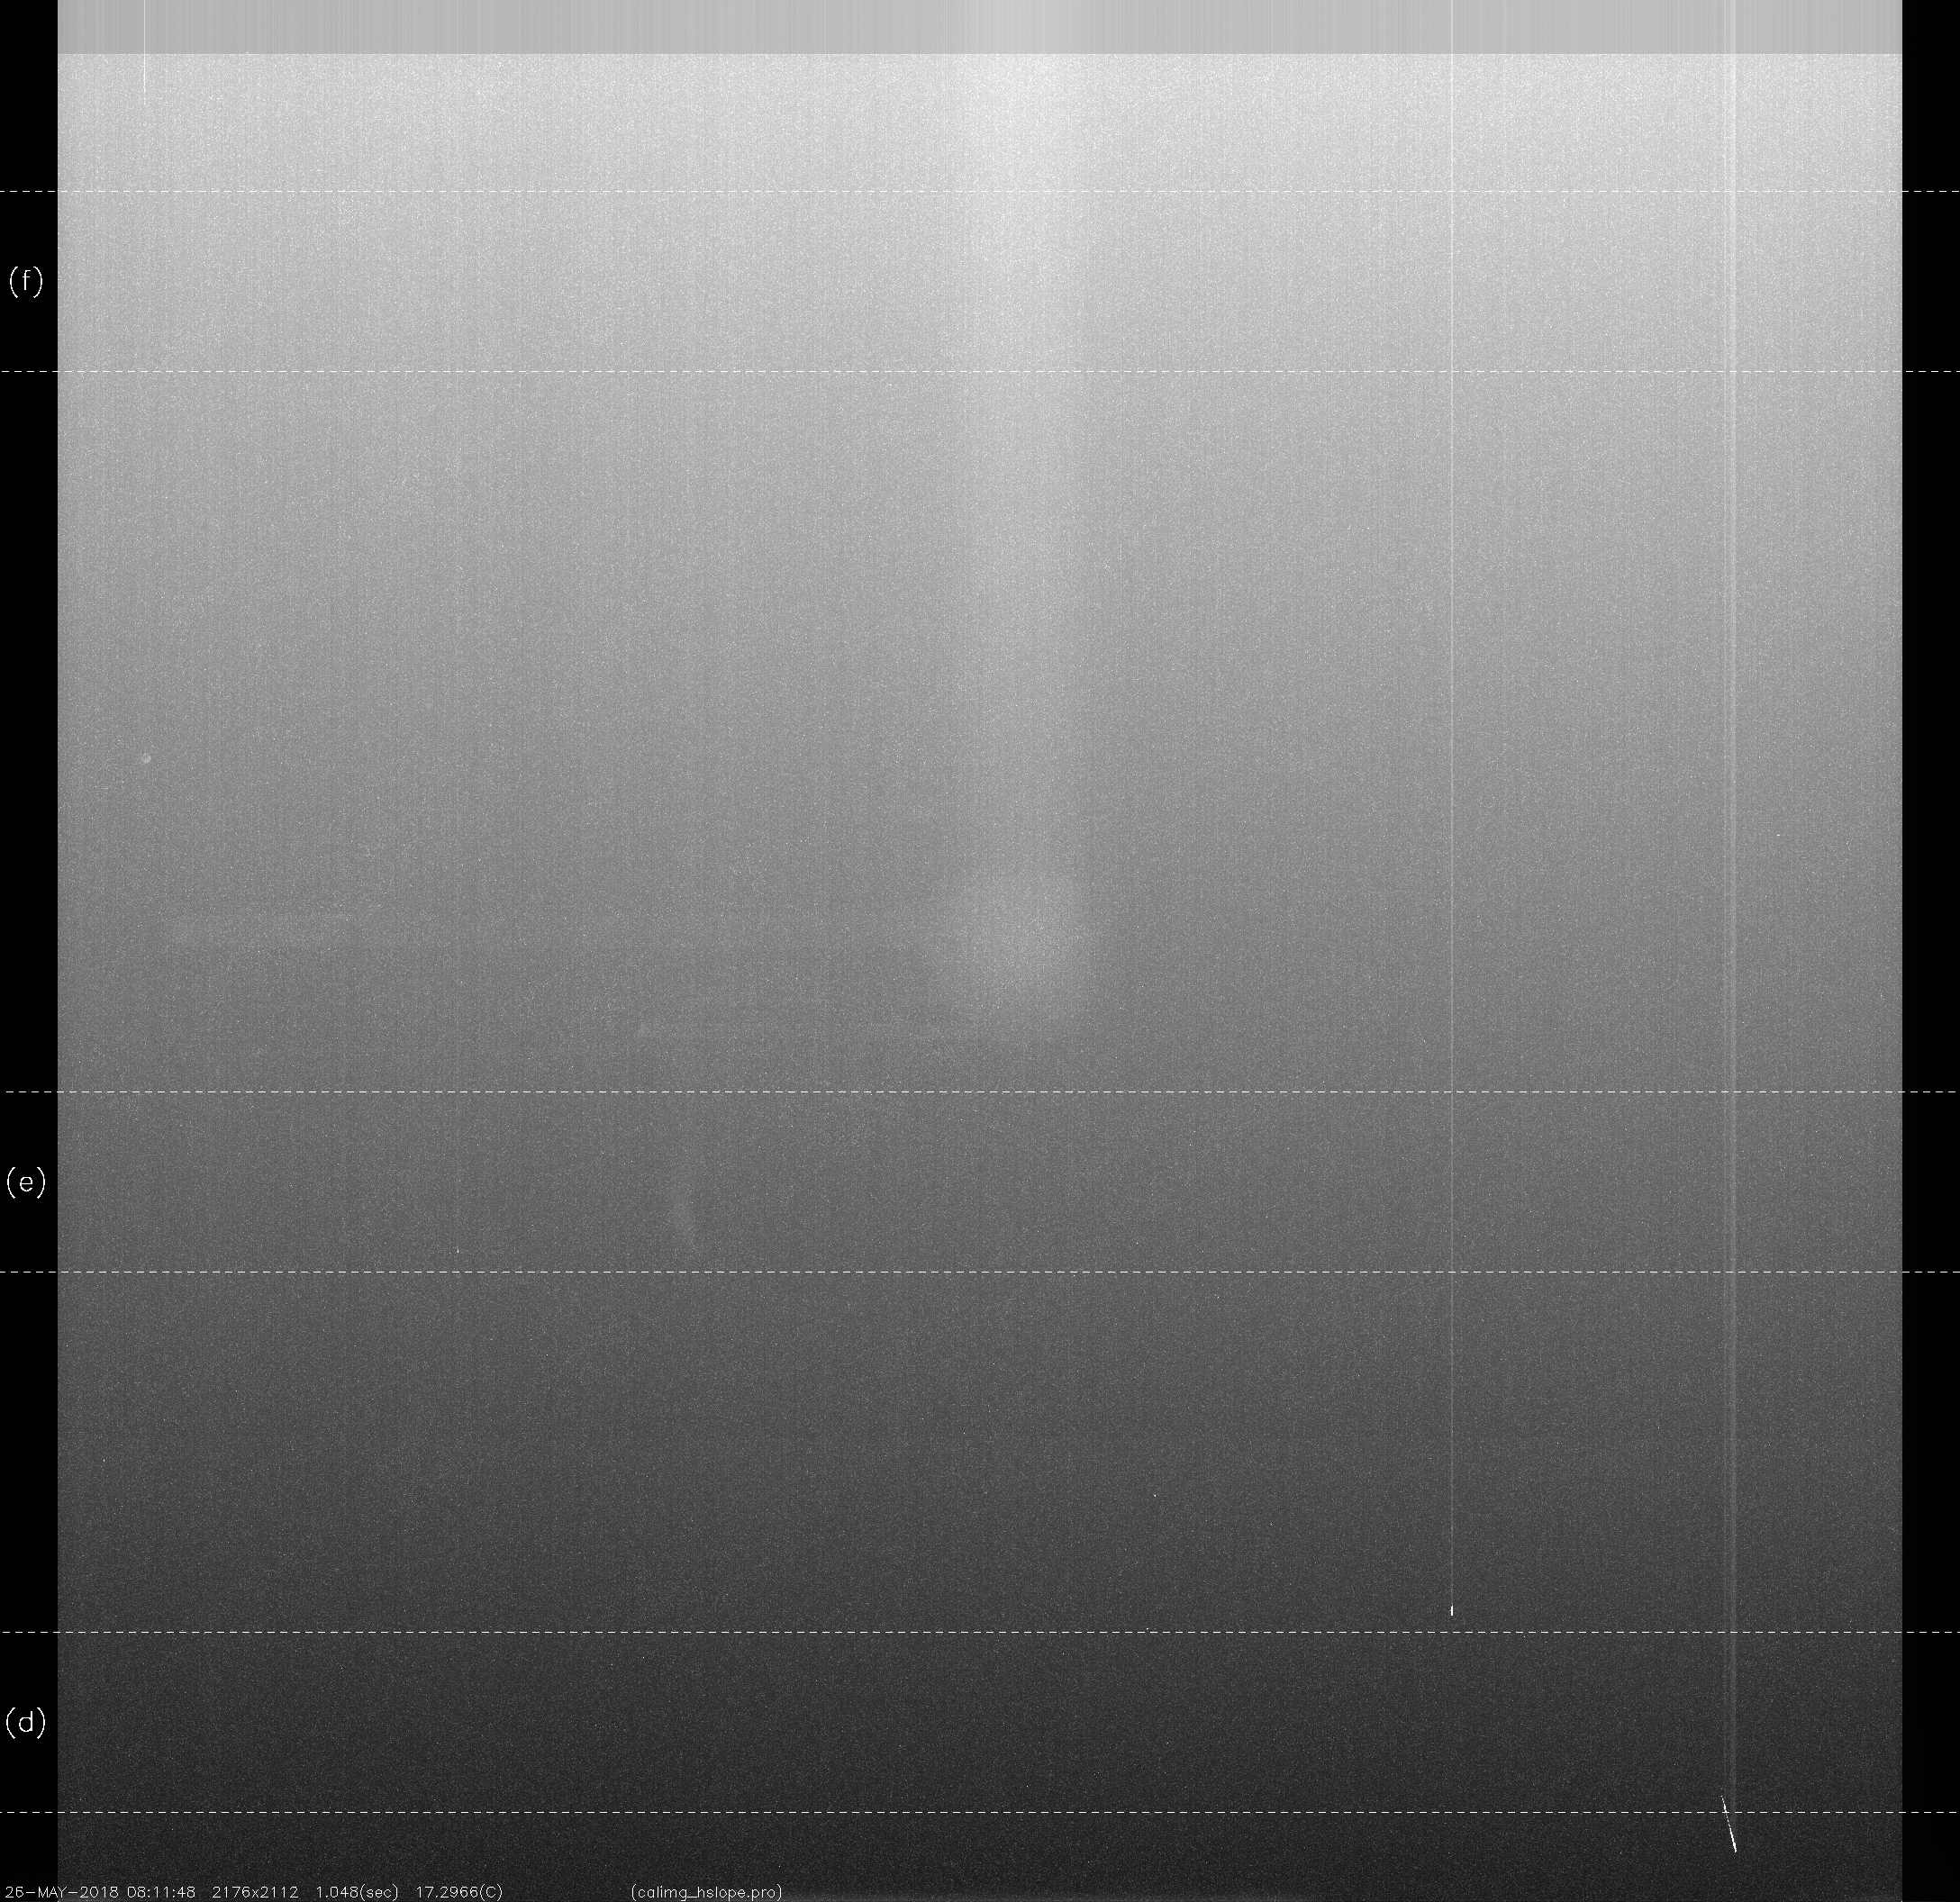
1.04800(sec), 17.2966(C)
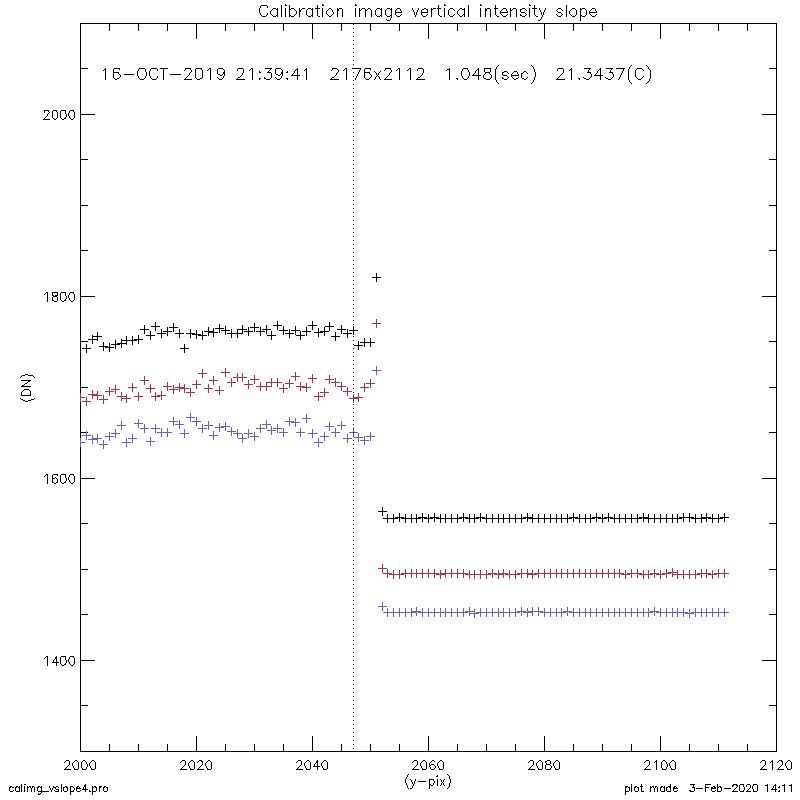
with reference lines.
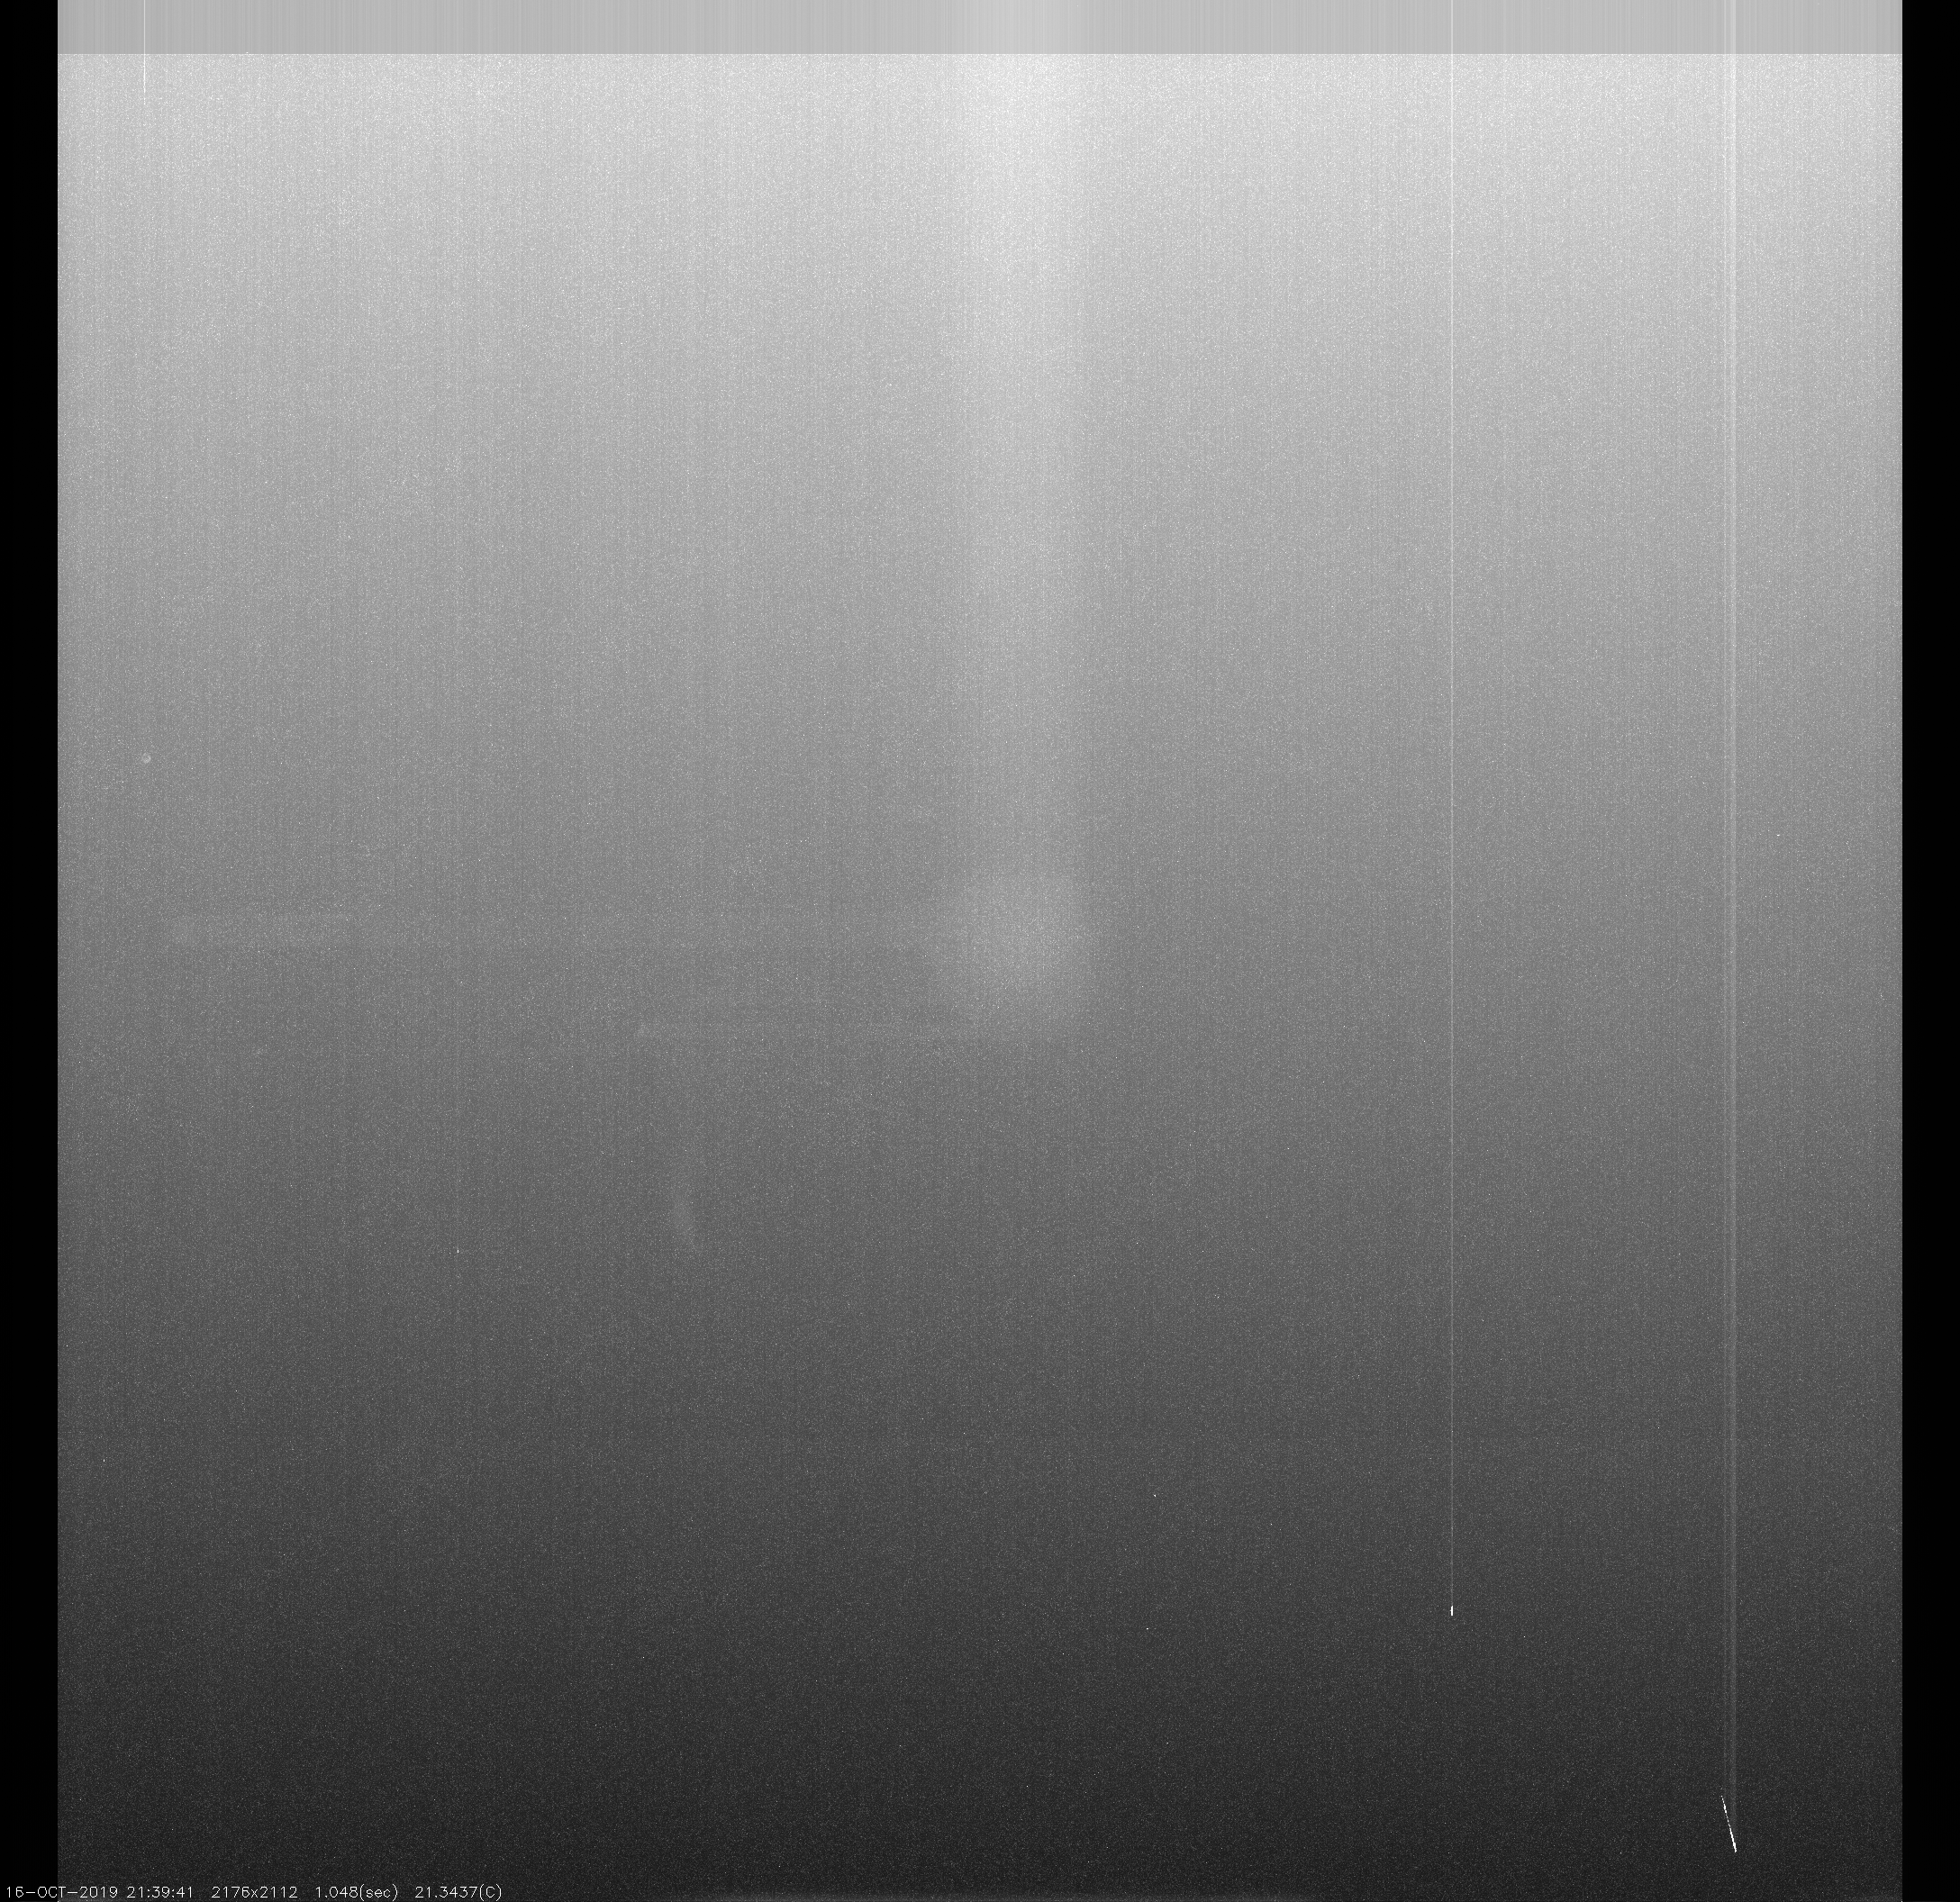
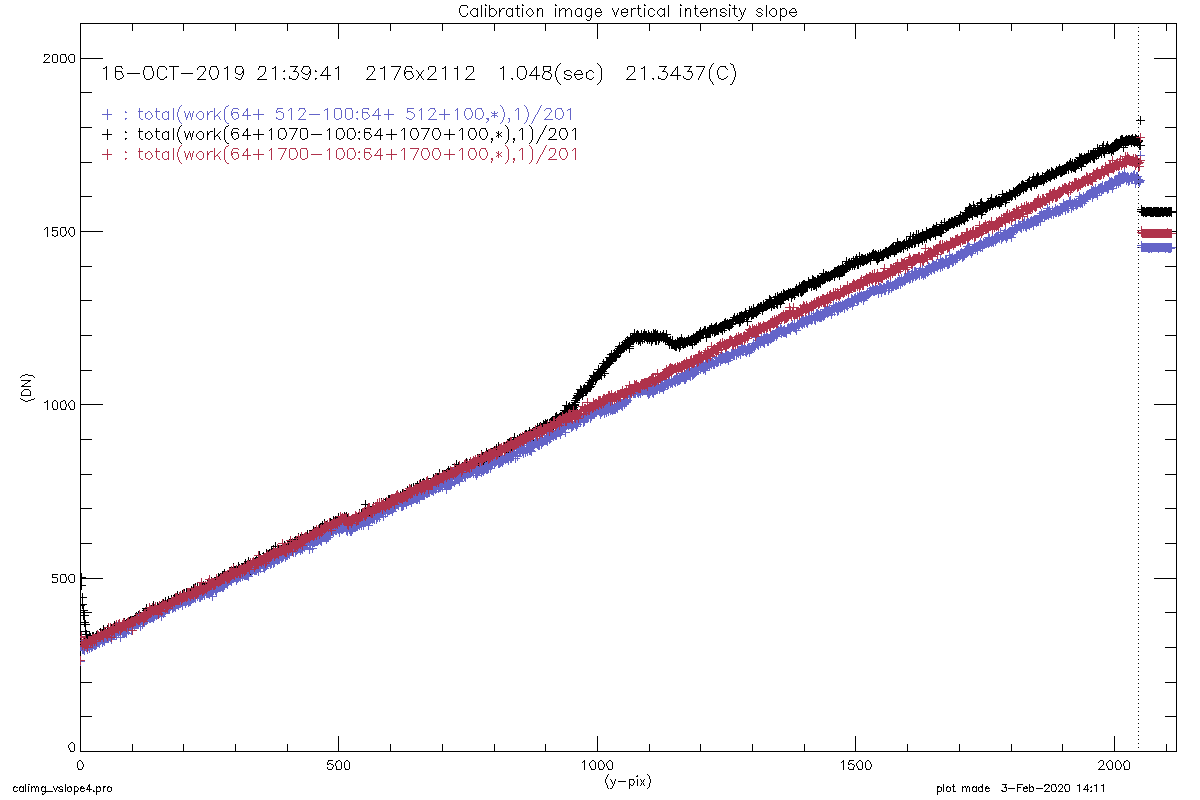
full-CCD 2176x2112(pix),
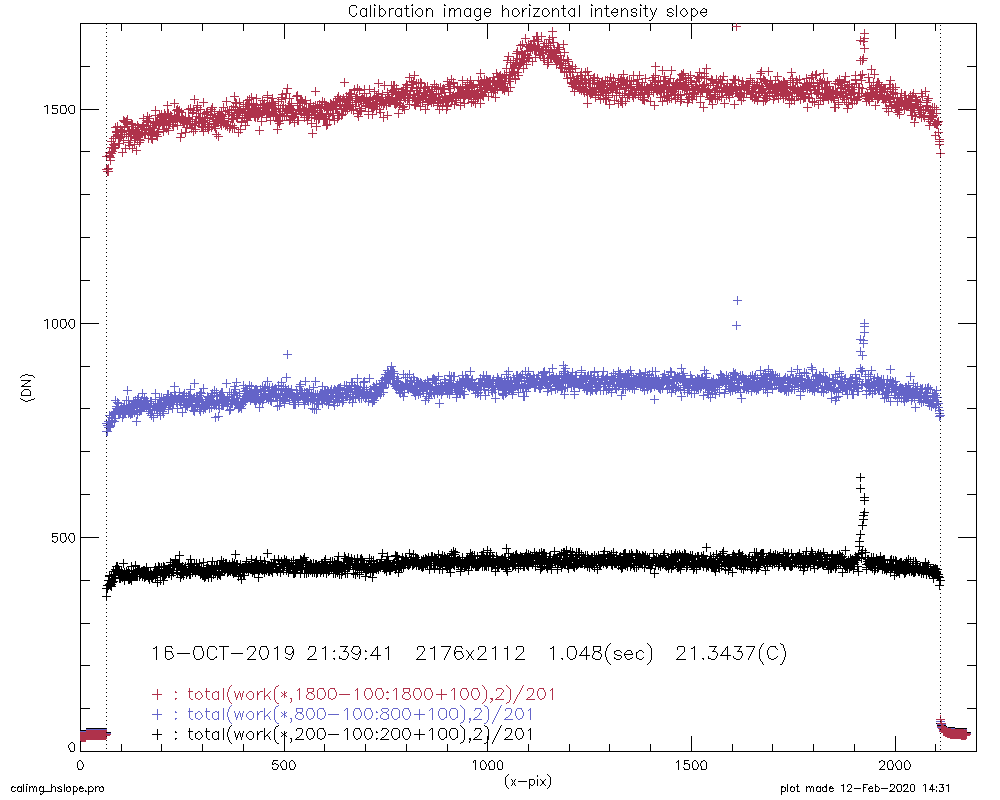
1.04800(sec), 21.3437(C)
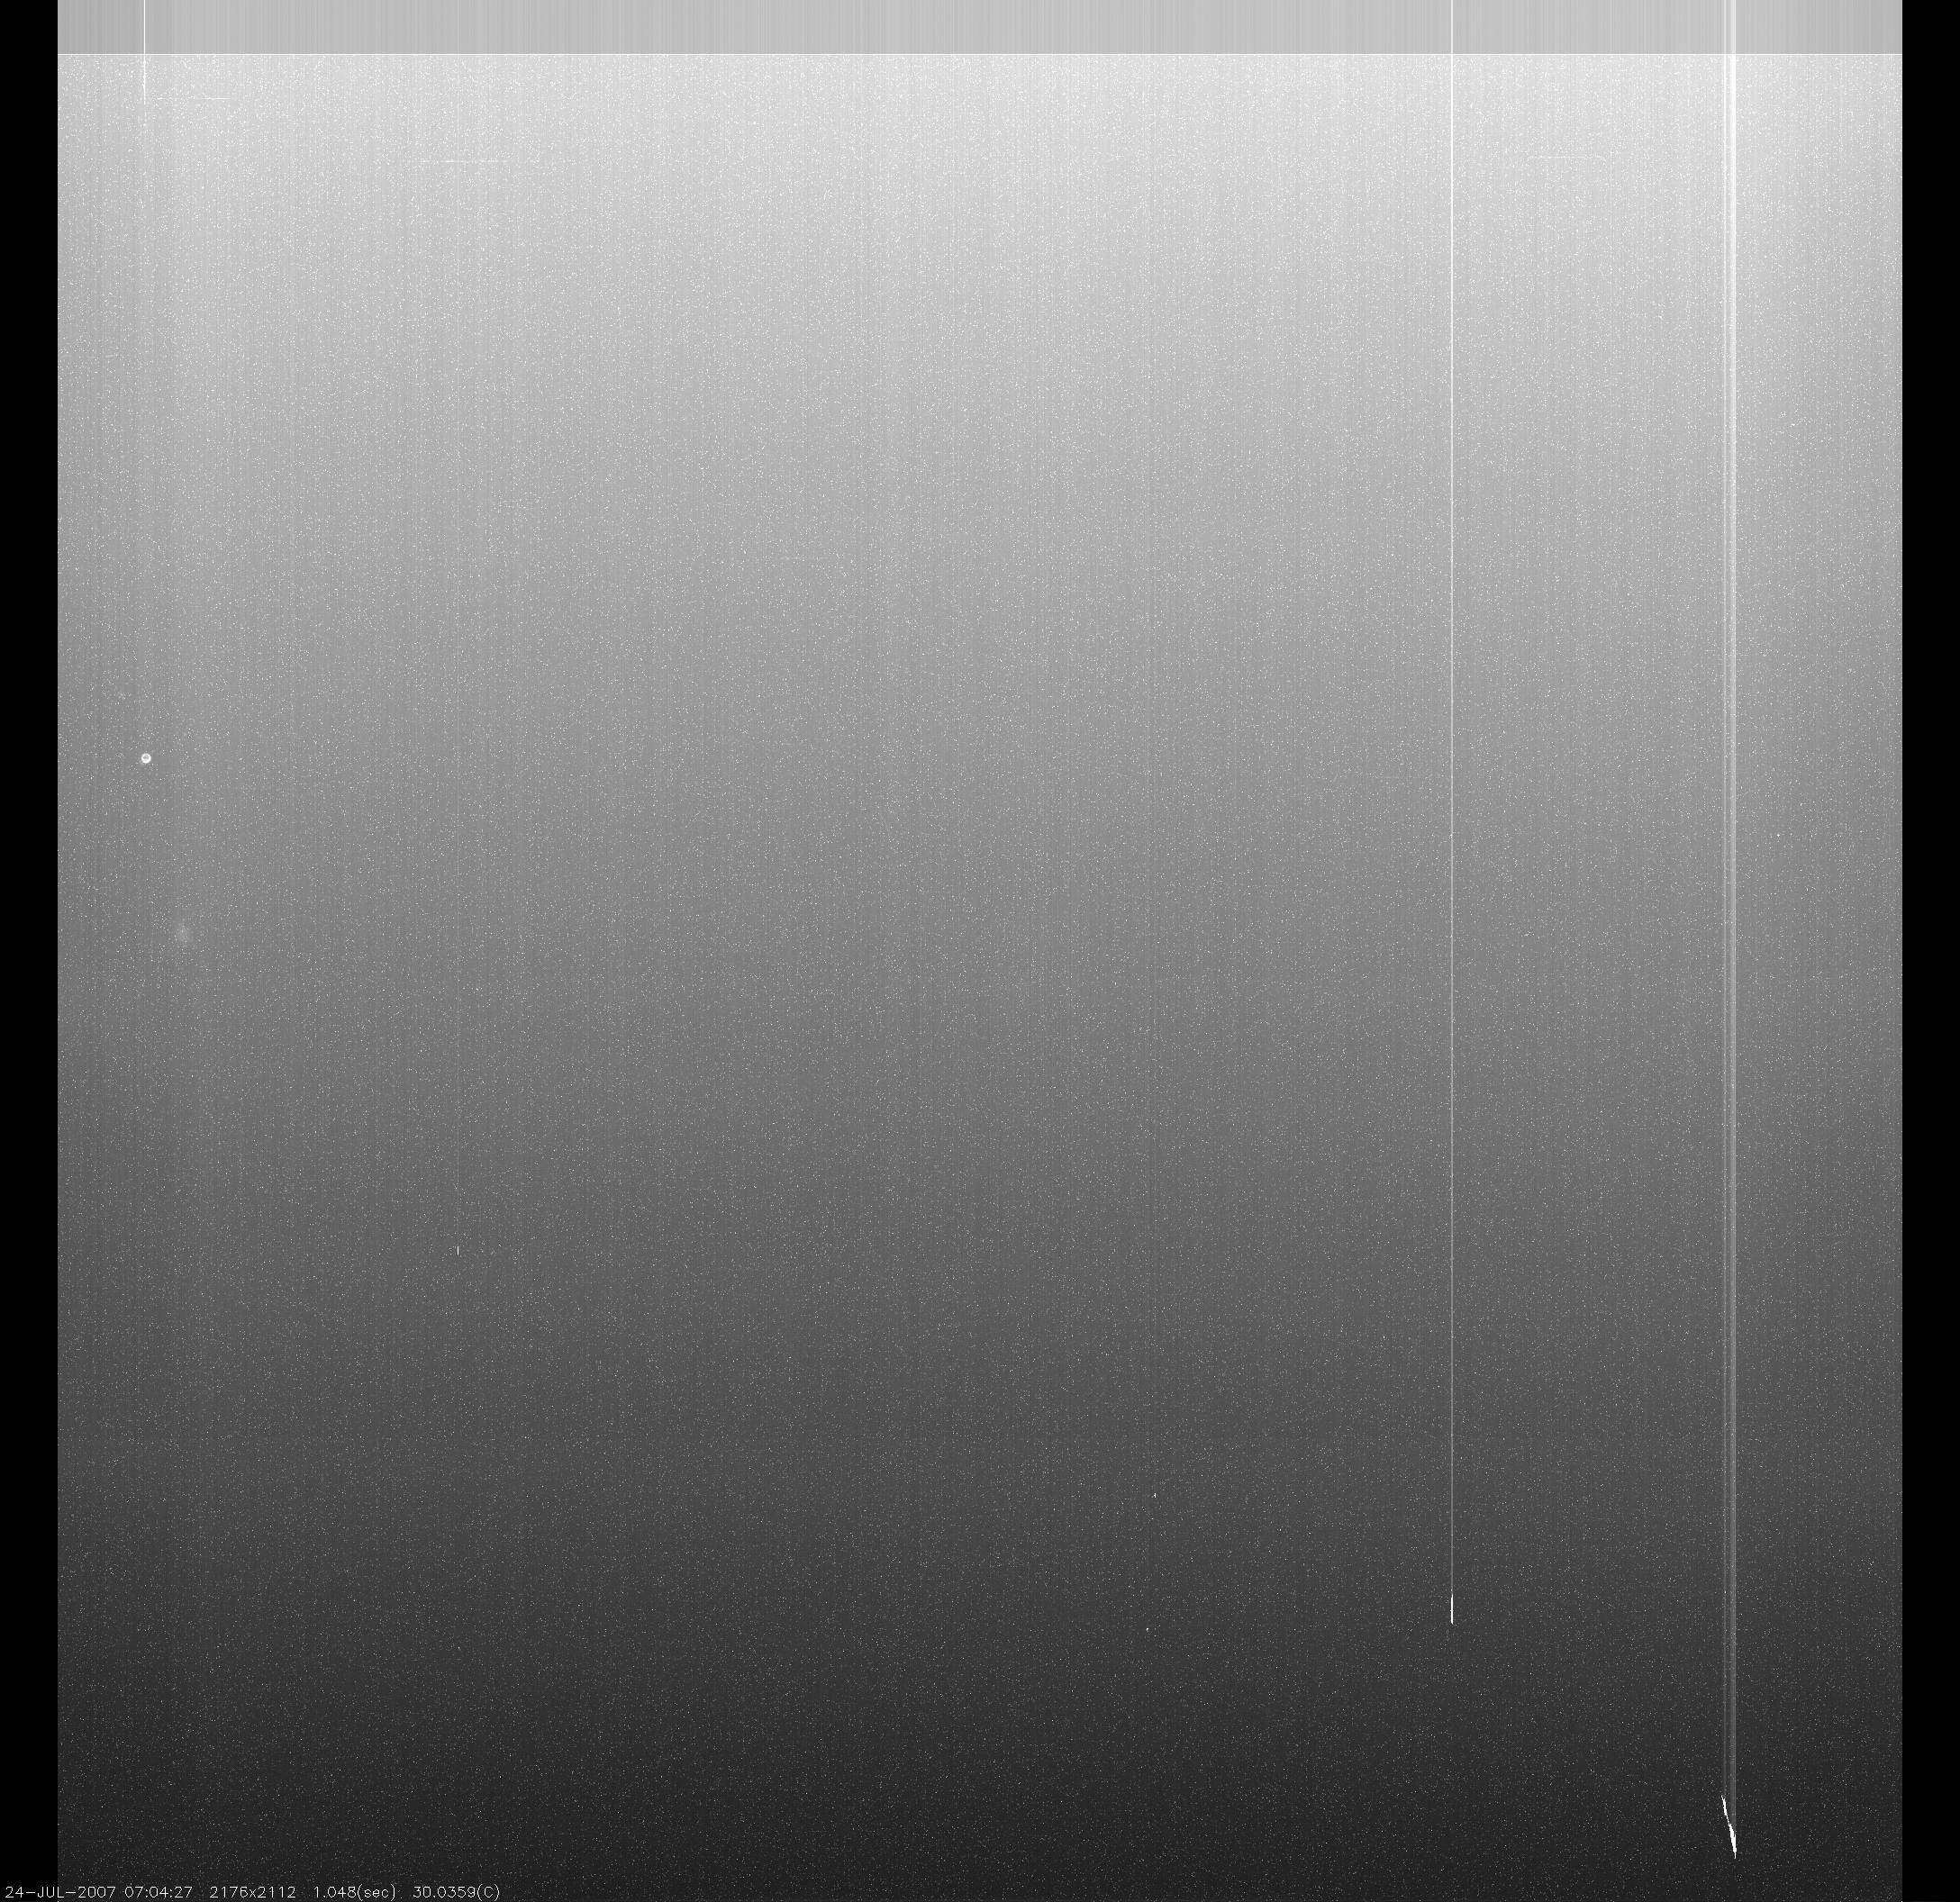
full-CCD 2176x2112(pix),
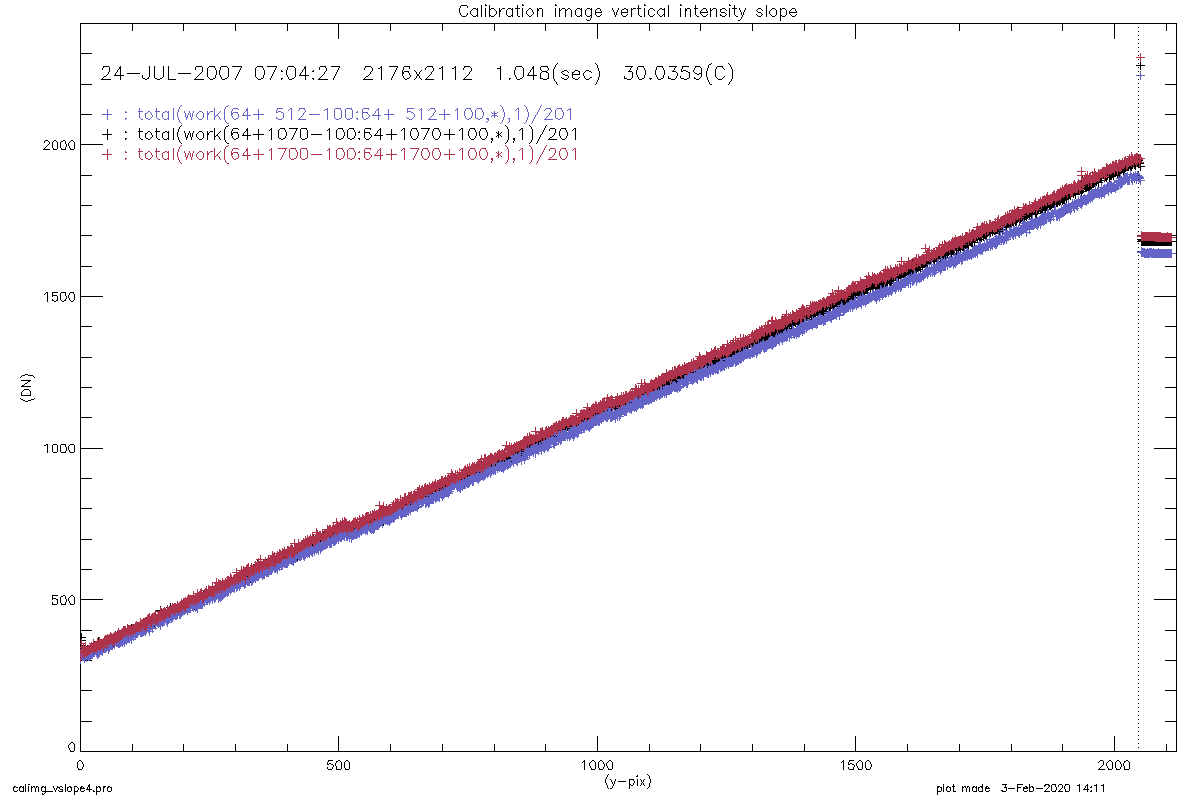
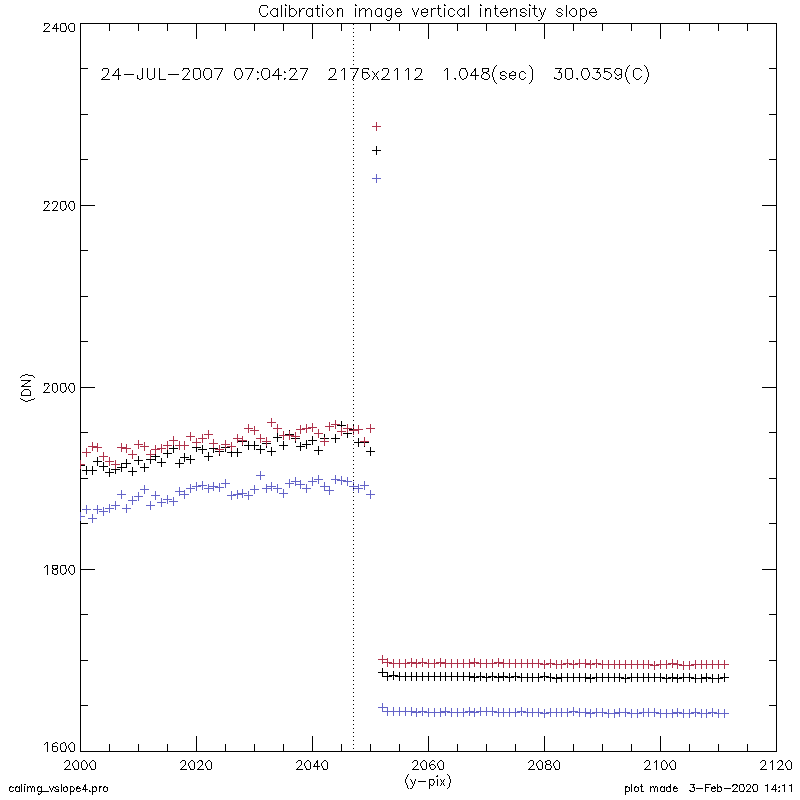
1.04800(sec), 30.0359(C)
link to the 2017 data analysis page.
link to the CCD basics page.
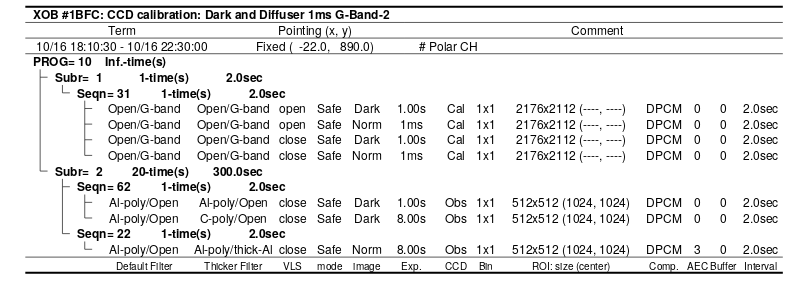
(sample images. click image to enlarge)
|
|
|
|
|
|
|
|
------------------------------------------------------
 I(y) - I(2111) = ( I(yo) - I(2111) ) * (yo*p)^(y-yo)
------------------------------------------------------

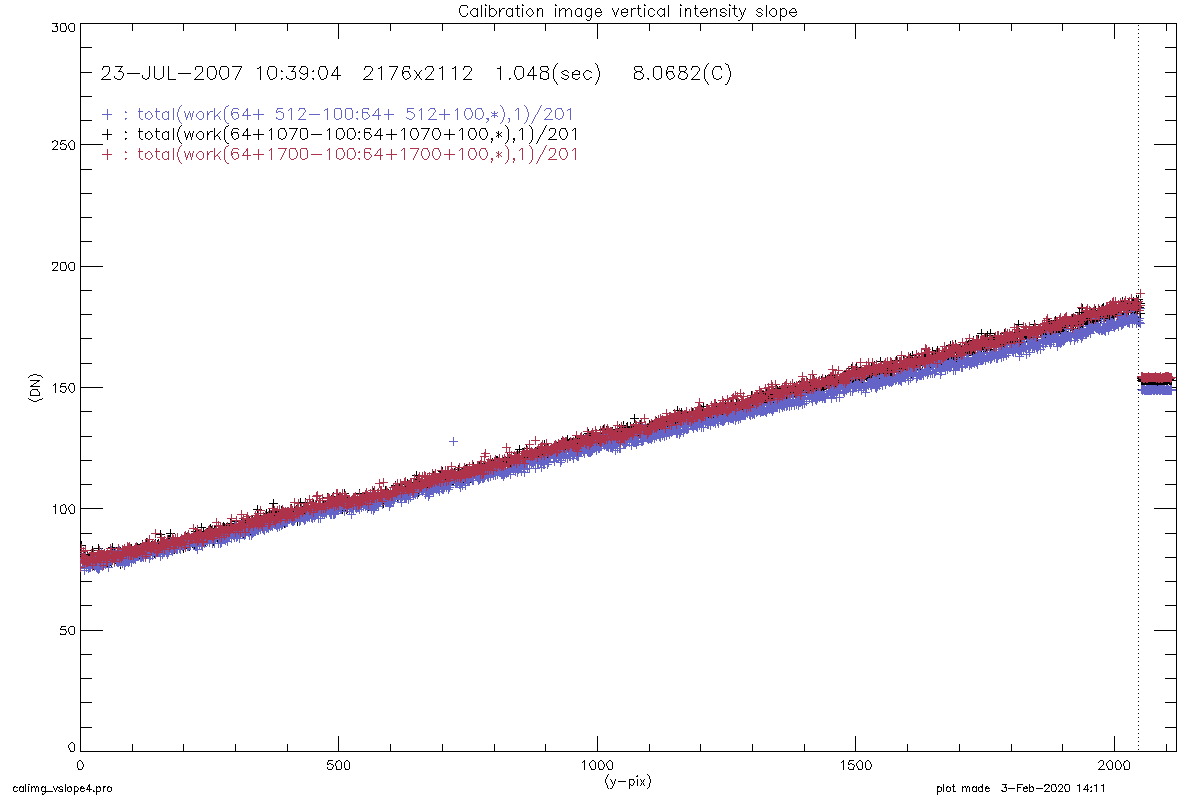
  I(y) : Vertical intensity slope of a cal-mode image.
         (averaged over 201 pix)
    yo : Pix number of the edge of CCD from the bottom.
         (yo = 2051 in our case)
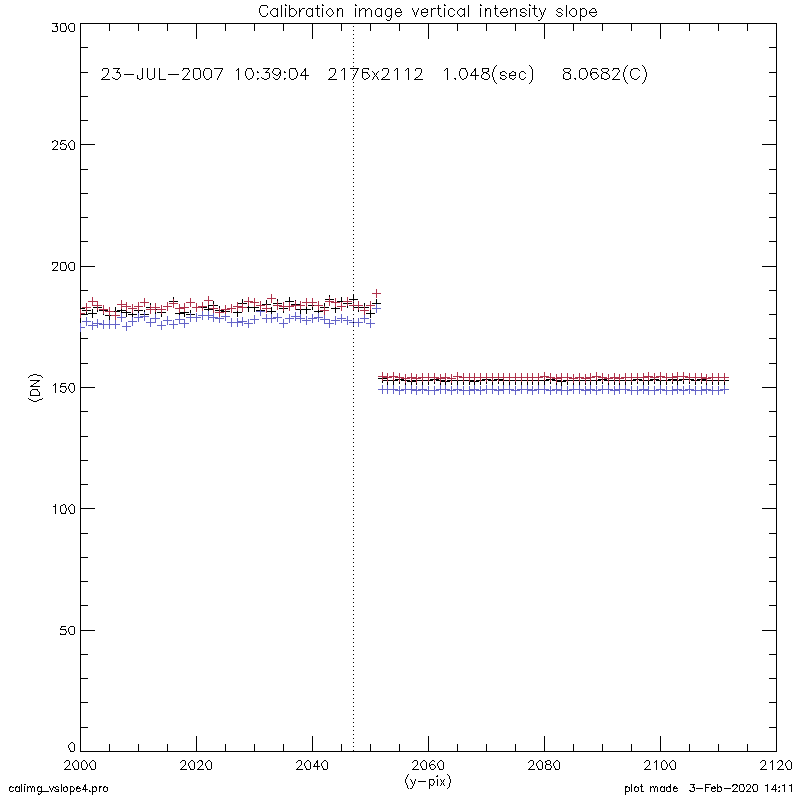
  I(2111) : Converged I(y) value at the over clocking area (y>2052).
            (calculated by mean(I(2060:2111)))
  p : Charge Transfer Inefficiency
      (CTE = 1 - p)

For y=yo+1=2052, the above formula is reduced to the following.
------------------------------------------------------------------------
2051 * p = [I(2052) - mean(I(2060:2111)] / [I(2051) - mean(I(2060:2111)]
------------------------------------------------------------------------
measured and calculated values
(averaged over 201 pix).
(averaged over 101 pix) .
Calculated CTE values and errors at each position.
(a) : 201 pix average around x=512
(b) : 201 pix average around x=1070 (region with the bright blob)
(c) : 201 pix average around x=1700
Errors were estimated from the standard deviation of the averaged pixels
propagated through the reduced equation in the above.
| date | CCD temp. | (a) | (b) | (c) |
| 16-OCT-2019, 21:39:41 | 21.3437(C) | 0.99998780 ± 0.000033 |
0.99998739 ± 0.000062 |
0.99998863 ± 0.000031 |
| 26-MAY-2018, 08:11:48 | 17.2966(C) | 0.99998735 ± 0.000037 |
0.99998770 ± 0.000069 |
0.99998843 ± 0.000036 |
| 24-JUL-2007, 07:04:27 | 30.0359(C) | 0.99999575 ± 0.000016 |
0.99999538 ± 0.000018 |
0.99999615 ± 0.000016 |
| 23-JUL-2007, 10:39:04 | 8.0682(C) | 0.99999776 ± 0.000064 |
0.99998966 ± 0.000080 |
0.99999387 ± 0.000061 |
| ratio : (16-OCT-2019)/(24-JUL-2007) |
--- | 0.99999201 | 0.99999166 | 0.99999475 |
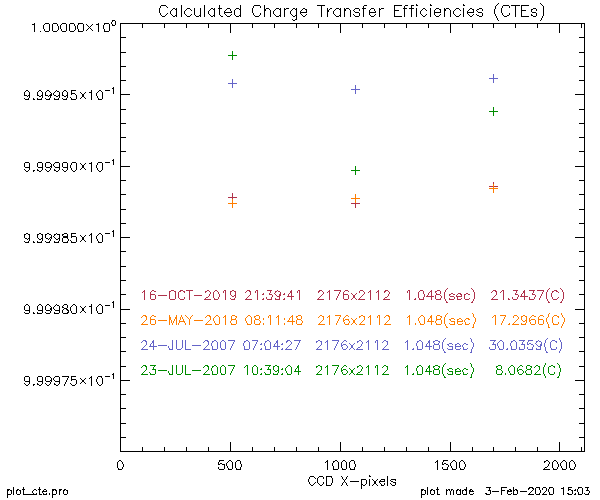
plot with error bars
case of 101 pix average
|
16-OCT-2019, 21:39:41 full-CCD 2176x2112(pix), 1.04800(sec), 21.3437(C) with reference lines |
24-JUL-2007, 07:04:27 full-CCD 2176x2112(pix), 1.04800(sec), 30.0359(C) |
|

|
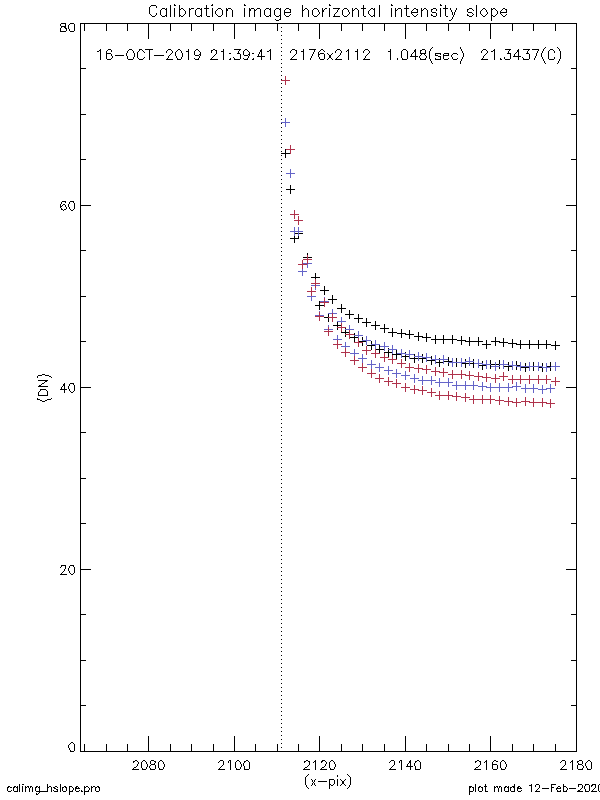
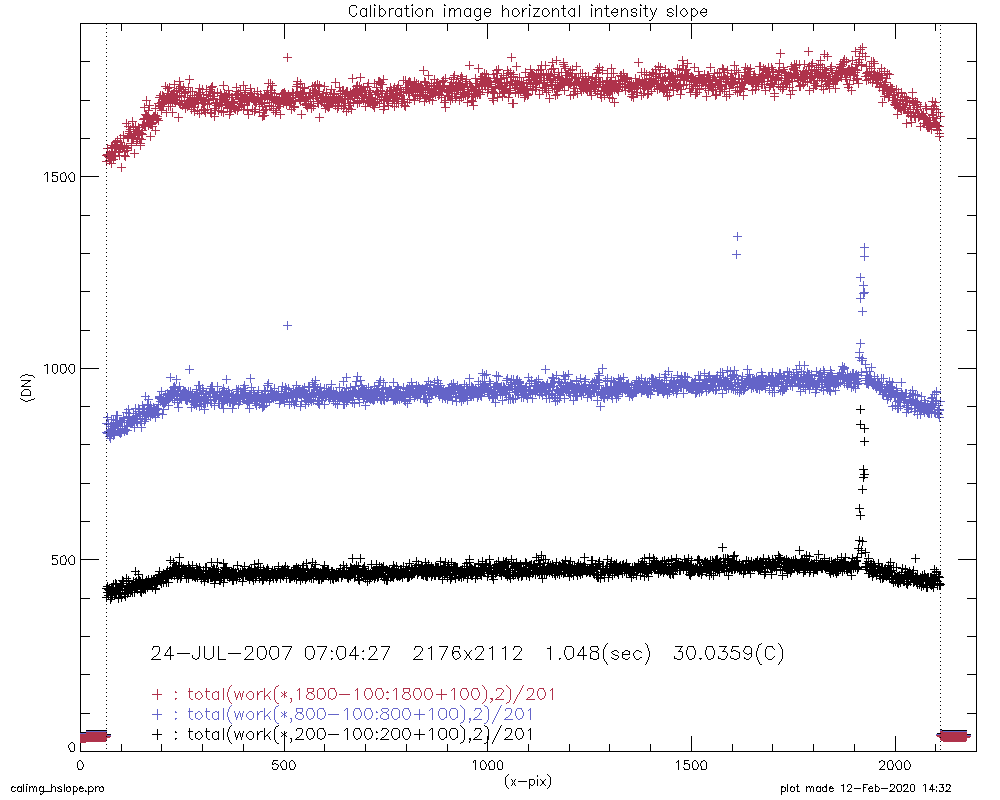
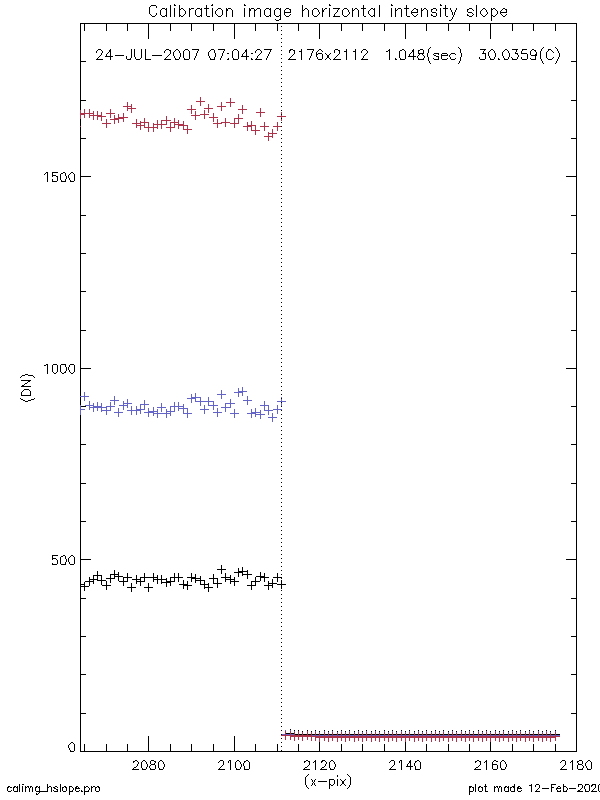
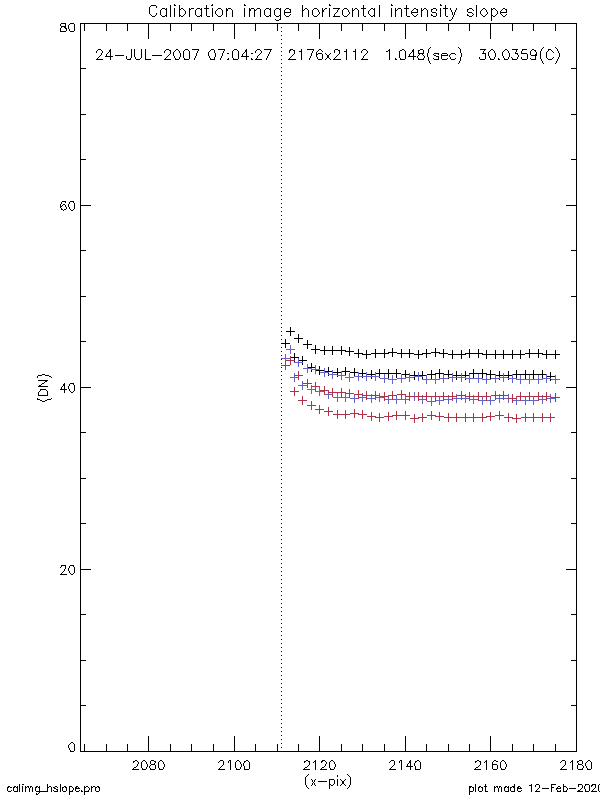
Plots of the horizontal profile averaged over the following region.
(d) : 201 pix average around y=200
(e) : 201 pix average around y=800
(f) : 201 pix average around y=1800
(click image to enlarge)
|
|
|
|
|
|
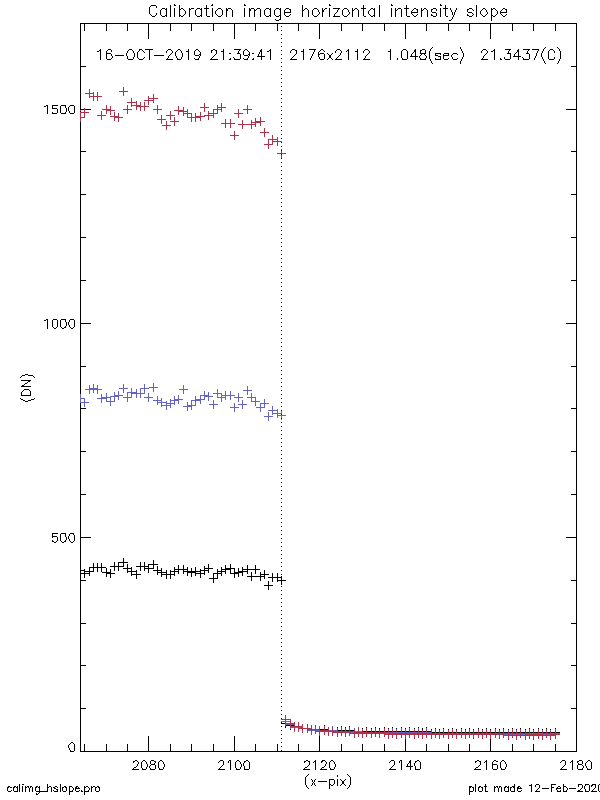
The counts at the over clocking area of the horizontal profile are bi-modal (see the right-most plots in the above). This reflects the characteristics of our serial register, i.e., because of the electrical noise created by the system (DC-DC converter), even- and odd-numbered pixels have slightly different base of the signals. It affects the whole area of CCD, but becomes obvious only when the signal level is low (like in the over-clocking area).
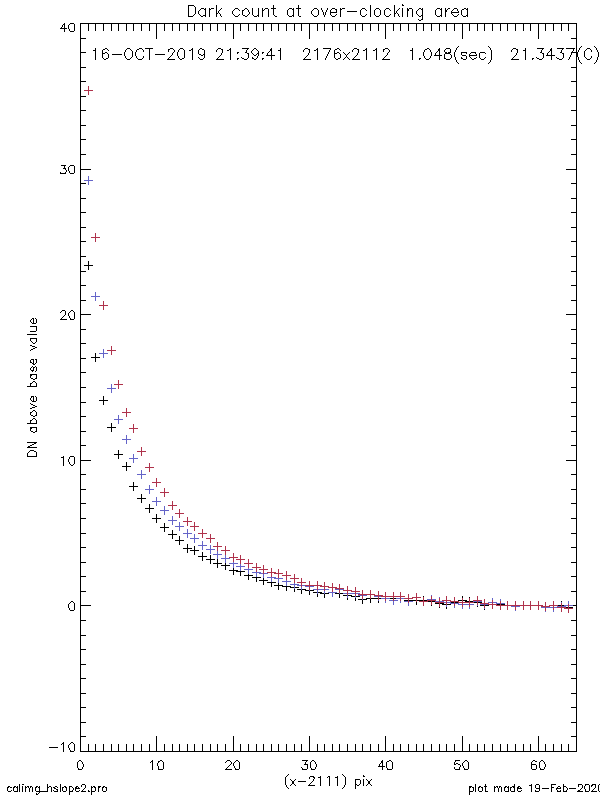
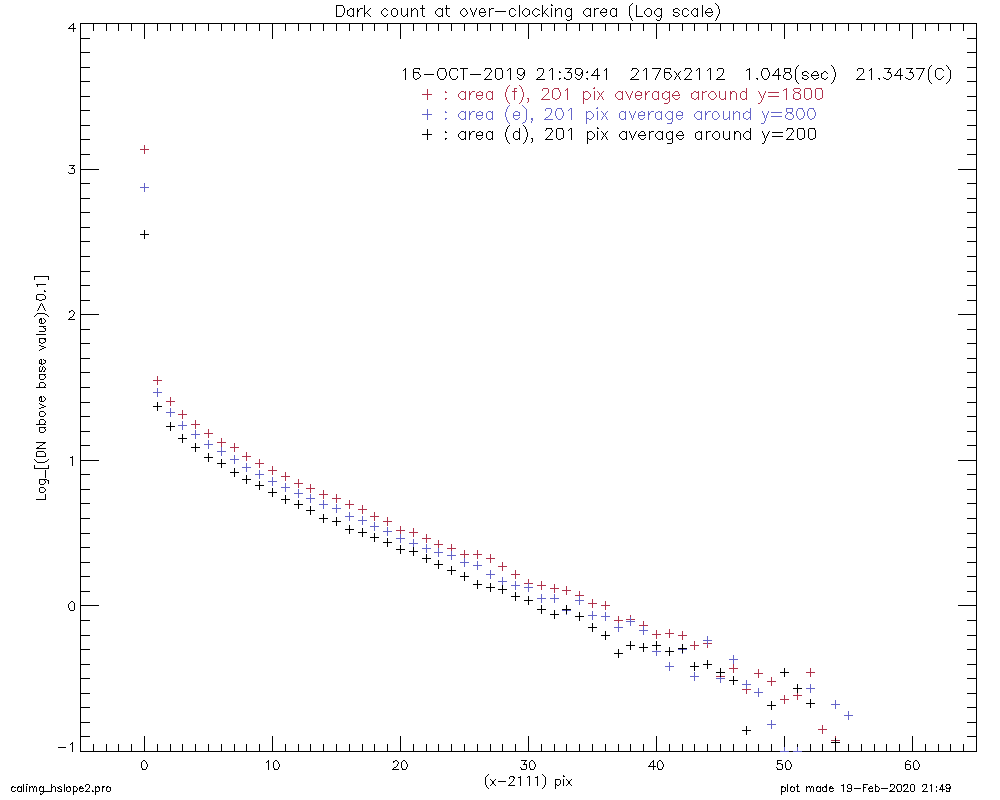
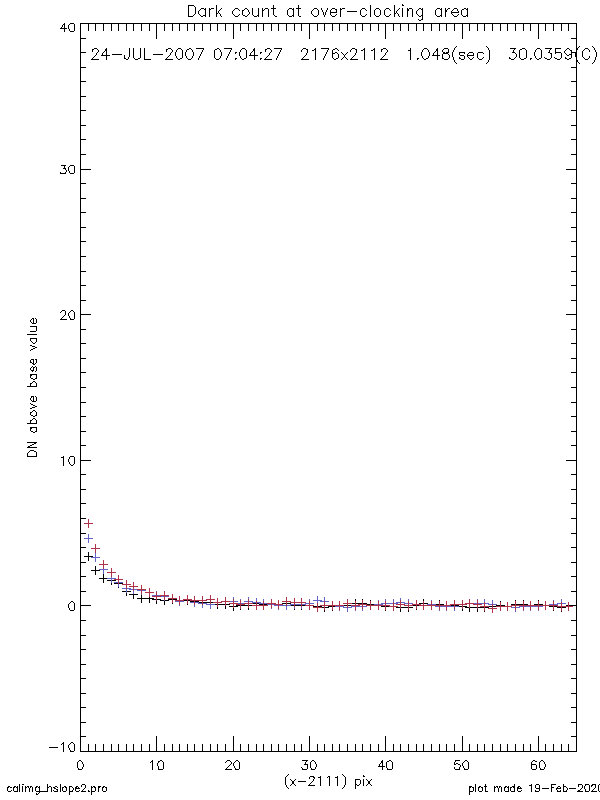
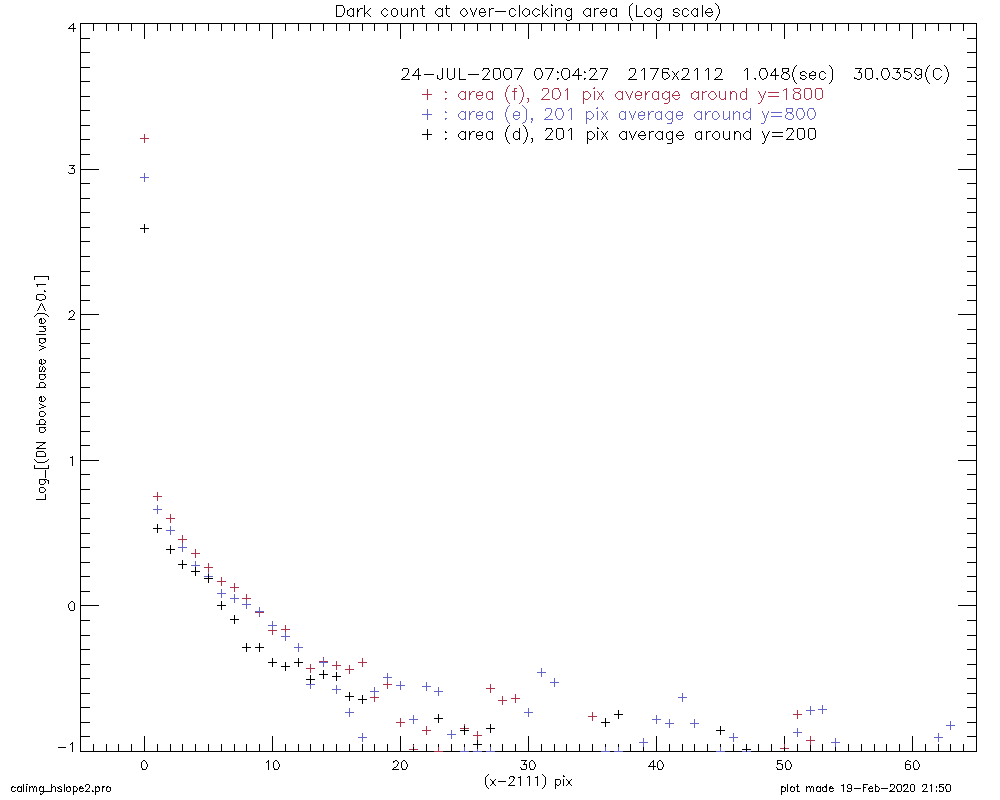
We therefore subtracted different base values from even and odd
pixels separately, and got the following plots (left plots: DN in
linear scale, right plots: DN in log scale).
(click image to enlarge)
|
|
|
|
For simplicity, the CTE in the horizontal direction was calculated by the same method as the case of vertical CTE using I(0) and I(1) values of the above plots.
Calculated CTE values and errors at each position.
(d) : 201 pix average around y= 200
(e) : 201 pix average around y= 800
(f) : 201 pix average around y=1800
measured and calculated values
| date | CCD temp. | (d) | (e) | (f) |
| 16-OCT-2019, 21:39:41 | 21.3437(C) | 0.99996869 | 0.99998135 | 0.99998765 |
| 24-JUL-2007, 07:04:27 | 30.0359(C) | 0.99999589 | 0.99999749 | 0.99999834 |
I(k) = I(0) * nCk * p^k * (1-p)^(n-k)Under the condition, p<<1 and n>>1, the above expression is approximated by the Poisson distribution as follows.
--------------------------------------
 I(k) = I(0) * (np)^k * exp(-np) / k!
--------------------------------------
   k : number of pixel from the right most edge of the image area
       (i.e., k=0 is x=2111 in a cal-mode image).
   n : total number of transfer to the readout = 2111+k-14
   p : Charge Transfer Inefficitncy (p=1-CTE)
Here we estimate the value of p using the value the above equation
at k=7.
---------------------------------------------
 I(7)/I(0) = (2104*p)^7 * exp(-2104*p) / 7!
---------------------------------------------
From the horizontal plot of 2019 and 2007, we have the following values at the lines y=200, 800 and 1800. Derived p and CTE are also shown in the table below.
| date | line | I(0) | I(7) | I(7)/I(0) | p | CTE (=1-p) |
| 16-OCT-2019 | 200 | 353.866 | 8.2278 | 0.02325 | 1.4525e-3 | 0.99854 |
| 16-OCT-2019 | 800 | 742.553 | 10.102 | 0.01360 | 1.2758e-3 | 0.99872 |
| 16-OCT-2019 | 1800 | 1356.47 | 12.196 | 0.00899 | 1.1622e-3 | 0.99883 |
| 24-JUL-2007 | 200 | 392.978 | 0.80497 | 0.002048 | 8.588e-4 | 0.99914 |
| 24-JUL-2007 | 800 | 871.807 | 1.1204 | 0.001285 | 7.861e-4 | 0.99921 |
| 24-JUL-2007 | 1800 | 1617.25 | 1.3422 | 0.000829 | 7.250e-4 | 0.99927 |