Calculation of XRT CCD contaminant layer thickness.
Link to the
Stray Light Correction of the XRT Temperature Response Functions.
(22 August 2016 by Aki Takeda)
(4-Sep-2016, 4-Oct-2016, 6-Nov-2016, 2-Dec-2016, 4-Jan-2017:
analysis report by Keiji Yoshimura was added.)
(21-Sep-2017, analysis of 3rd stray light increase by KY added.)
(27-oct-2020, figure 4.1.7 added.)
1. Importance of estimating the contaminant layer thickness.
It is officially reported that there exists an accumulation of
contamination(unspecified compound) on the surface of XRT's CCD
and Focal-plane analysis filters
(Narukage, et al. 2011, Solar Physics, vol.269, p.169-236).
Since this contamination partially absorb observed X-ray signal
(and partially enhance G-band signal), it affects the photometry of
the XRT observation. It is also reported that the thickness of the
contaminant layer varies with time; generally accumulates with
time and cleared by the CCD bakeout operation.
So it is important to estimate the thickness of the layer at any
time of observation by XRT. For this purpose, The intensities of
the G-band full-Sun images are being monitored regularly (see,
G-band luminosity monitor page).
2. The current model and handling method.
We handle the absorption/enhancement by contaminant (their spectral dependence)
as a factor of XRT's effective area function;
[Effective Area] = [aperture] * [prefilter] * [mirror1] * [mirror2] * [filter1] * [filter2] * [ccdqe] * [contamination]
which is used to derive XRT's temperature response functions.
- Spectral dependence of intensity modification by contamination.
IDL> lambda = findgen(3991)/10. + 1.      ; 0-4000 (A)
IDL> _contaminant='DEHP'                  ; assumed type of contaminant
IDL> contamination = xrt_calc_att(_contaminant, contam_thickness, lambda)
- Estimation of contamination thickness (CCD + Filters).
IDL> fw1=3 & fw2=0                        ; thin-Be/open, required for Filter part.
IDL> time='20-aug-2015'
IDL> contam_thickness = xrt_time2contam(fw1, fw2, time)
- Contamination database accessed by xrt_time2contam.
mithra:~> cd $SSW/hinode/xrt/idl/response/contam
mithra:/ssw/hinode/xrt/idl/response/contam> ls -lrt
total 1692
-rw-rw-r-- 1 software guest 166231 Oct  5  2008 n_DEHP.txt
-rw-rw-r-- 1 software cron  657032 Aug 20  2010 xrt_contam_on_filter.geny
-rw-r--r-- 1 software cron    4164 Feb  4  2014 gband_vs_bakeout.sav
-rw-r--r-- 1 software cron    7052 Mar 10 13:49 xrt_contam_on_ccd.geny
-rw-r--r-- 1 software cron  888108 Mar 10 13:49 xrt_contam_on_ccd.pdf
- XRT_CONTAM_ON_FILTER.GENY : constant since mid-June 2007
(operational heaters permanently ON keeping the filter temperature high
enough to avoid further accumulation of contaminant).
plots of contamination of each filter
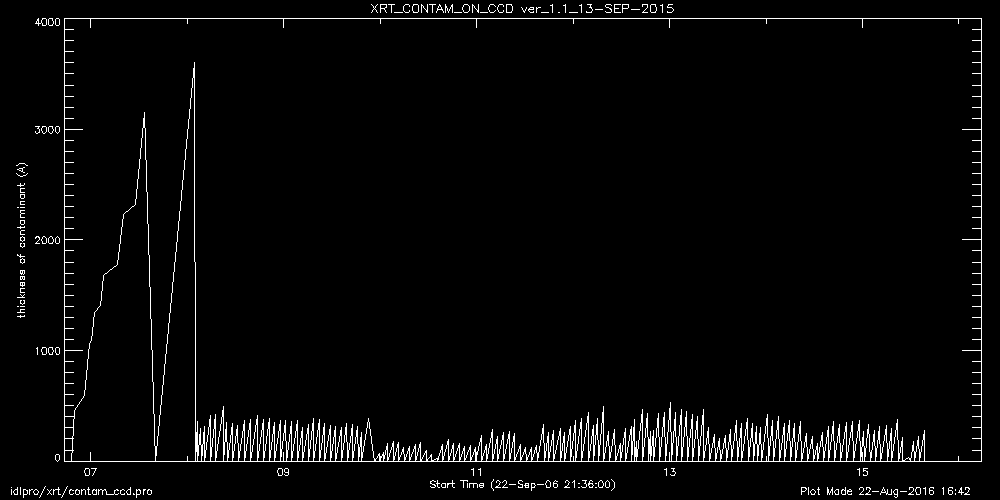
- XRT_CONTAM_ON_CCD.GENY : should be updated (at least)
after every CCD bakeout operation.
| Figure 1 (click image to enlarge) |
|
A code to update this geny file (by N. Narukage) : run_from_NNarukage.pro
- Outline of
run_from_NNarukage.pro (comments added and lines re-formatted by AkT).
[purpose]
Update xrt_contam_on_ccd.geny and also create xrt_contam_on_ccd.pdf.
[main logic]
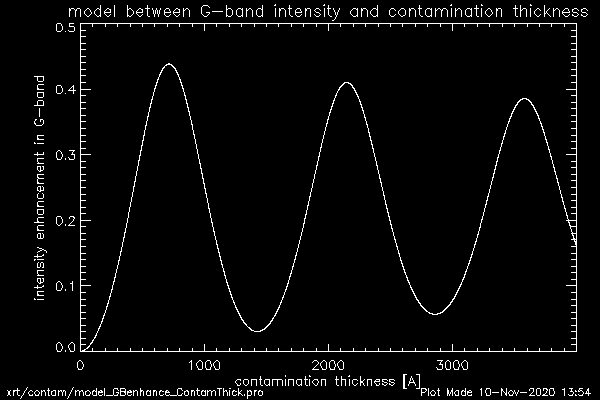
Use model between G-band intensity enhancement and contaminant layer
thickness (line no. 514 - 517).
| Figure 2 (click image to enlarge) |
Figure 3 (from xrt_contam_on_ccd.pdf, click to enlarge.) |
|
|
- [part 1]
read DN_QS_latest_dark_o1.sav and
Gband_after_2nd_bake.sav from
NAO:/home/narukage/work/xrt/filter/contami directory.
- [part 2]
make bakeout list (read bake.sav, update and save).
read housekeeping data, HK1_XRT_S_HTR_A_E_D, HK1_XRTD_OPHTR_PWR.
- [part 3]
read, update and save Gband.sav (<--- includes G-band
intensity data for estimating contaminant layer thickness.)
- figure out new data since last update (use xdat_yyyymmmmdd.sav)
- find GBand full-Sun images near DC pointing (xcen:-23.94, ycen:-29.89,
each +/- 5 arcsec).
- find corresponding dark image, and read.
- exclude spot area using spot map (xrt_spotmasters.geny).
- cut out center part of Gband and dark (line no. 338):
data = data[(1024.-256.)/index.chip_sum:(1024.+256.)/index.chip_sum-1, (1024.-256.)/index.chip_sum:(1024.+256.)/index.chip_sum-1].
- calculate Gband intensity (line no. 380):
data = (data-dark)/index.exptime/index.chip_sum^2.
- [part 4]
convert GB intensity to contaminant layer thickness.
- [part 5] make plots for the PDF file and update & save
xrt_contam_on_ccd.geny file.
3. Possible improvements.
(1) More frequent update of DB.
As of this writing(Aug, 2016), the latest DB (xrt_contam_on_ccd.geny,
ver_1.1_13-SEP-2015) covers until 13-Sep-2015.
Ideally, updates after every CCD bakeout operation (when the level0 data
before the latest bakeout become available) is desirable.
(2) Taking into account the gradual increase of G-band baseline.
The G-band luminosity monitor page shows gradual increase of the baseline
of G-band intensities since 2011 (even excluding the effect of intensity
jump-ups due to the stray light increase of 9-May-2012 and 14-Jun-2015).
The contaminant layer is not completely removed by each bakeout operation
after 2011, while the current model assumes it is cleared to zero after
every bakeout. Taking this residual layer into account would provide
more realistic estimation of contaminant layer thickness.
Obtaining the best effective area function possible (with respect to the
correction of CCD contamination effect) is crucial to estimate the
effect of the increased stray light on the effective area function and
the response functions.
4.1 Re-calculation of G-band intensity variation
(Keiji Yoshimura, 4-Sep-2016).
Using the same data selection and data processing method as the current
official version by N. Narukage, the G-band intensity data since 2008 were
re-collected. It is noticed from the Fig. 4.3 that the G-band intensity
curves between two consecutive bakeouts started to go downward in the
late phase since March, 2016. The similar trend is observed in the
"recent plot" at the G-band monitor page at SAO, but seems to
have started earlier (Jan-2016). This indicates that the CCD contamination
has become so thick (nearly 1000A) that the G-band intensity started to
reduce because of the effect of interference. In other words, we are
around the first maximum of the model curve
(Fig.2).
If this interpretation is right, we significantly underestimates the
recent contaminant thickness (the current method generally calculates
them as less than 300 A), and thus need to modify the current handling
method.
[click image to enlarge]
| Fig.4.1.1 |
Fig.4.1.2 |
Fig.4.1.3 |
 |
 |
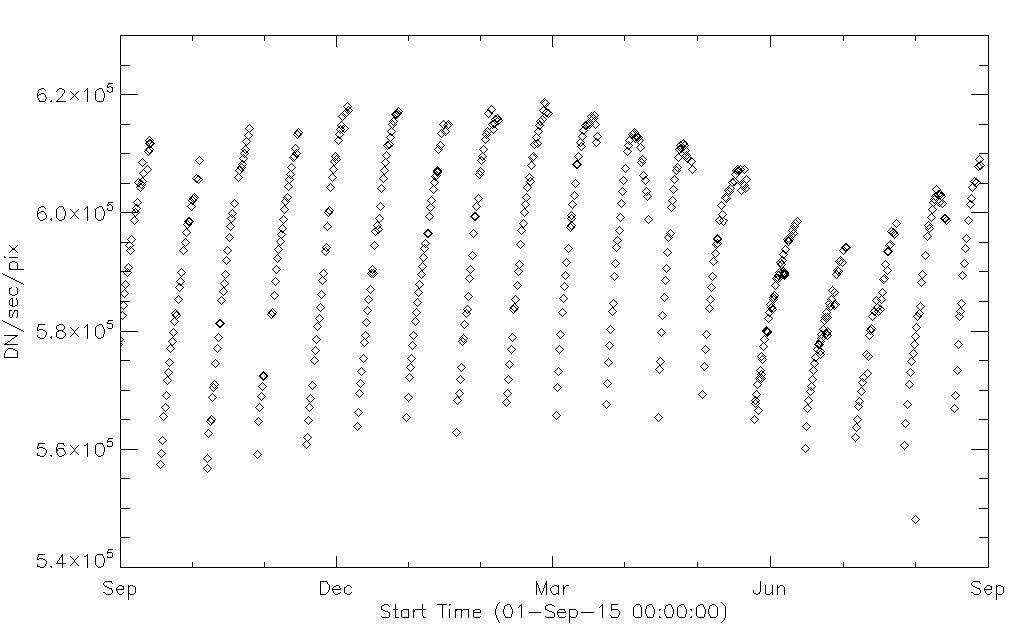 |
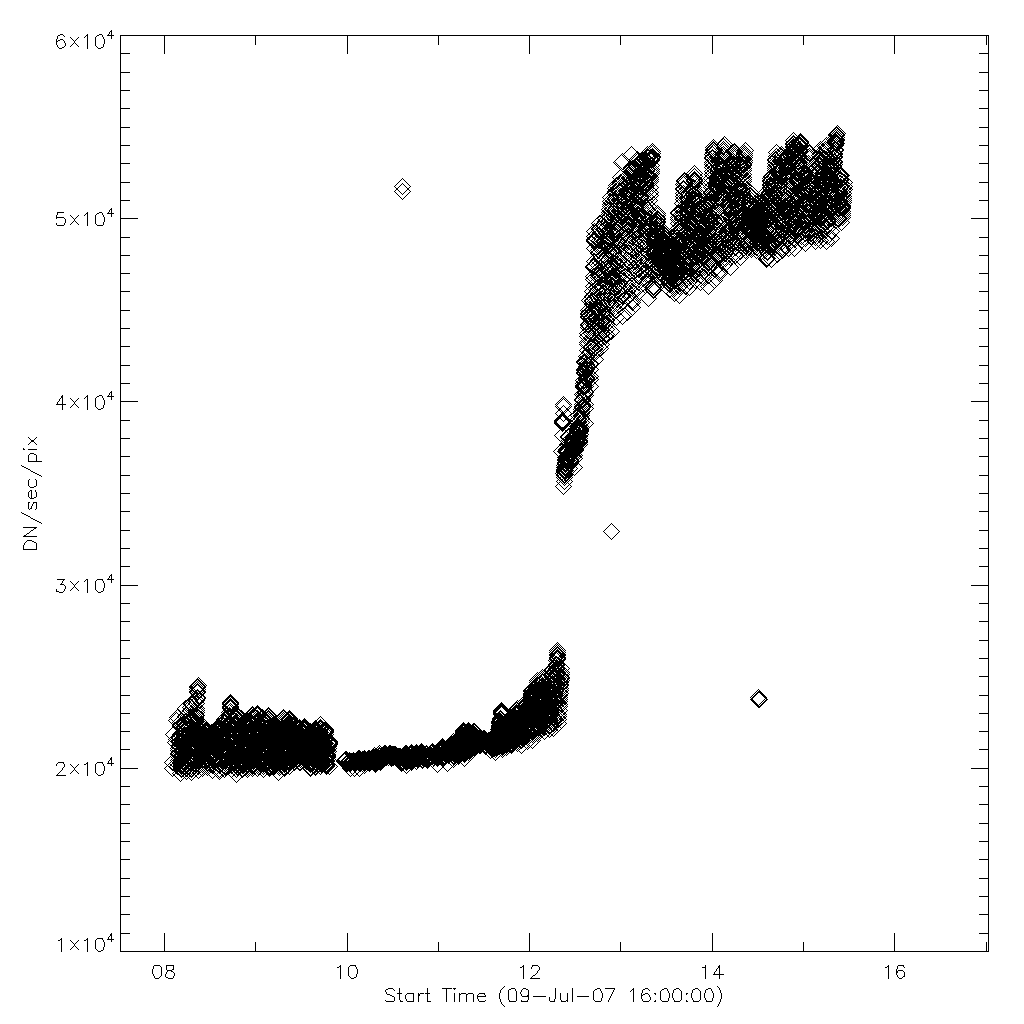
- Figure 4.1.1 : G-band intensity variation "at a glance",
from Jan-2008 through Aug-2016 in the same scale.
- Figure 4.1.2 : Close-up of the period Jan-2008 to Jun-2015.
- Figure 4.1.3 : Close-up of the period Sep-2015 to Aug-2016.
- Note: In order to calculate the G-band baseline increase,
we need to subtract the intensity jump due to stray light increase.
We have not removed this effect yet in the Figs 4.1 to 4.3 above.
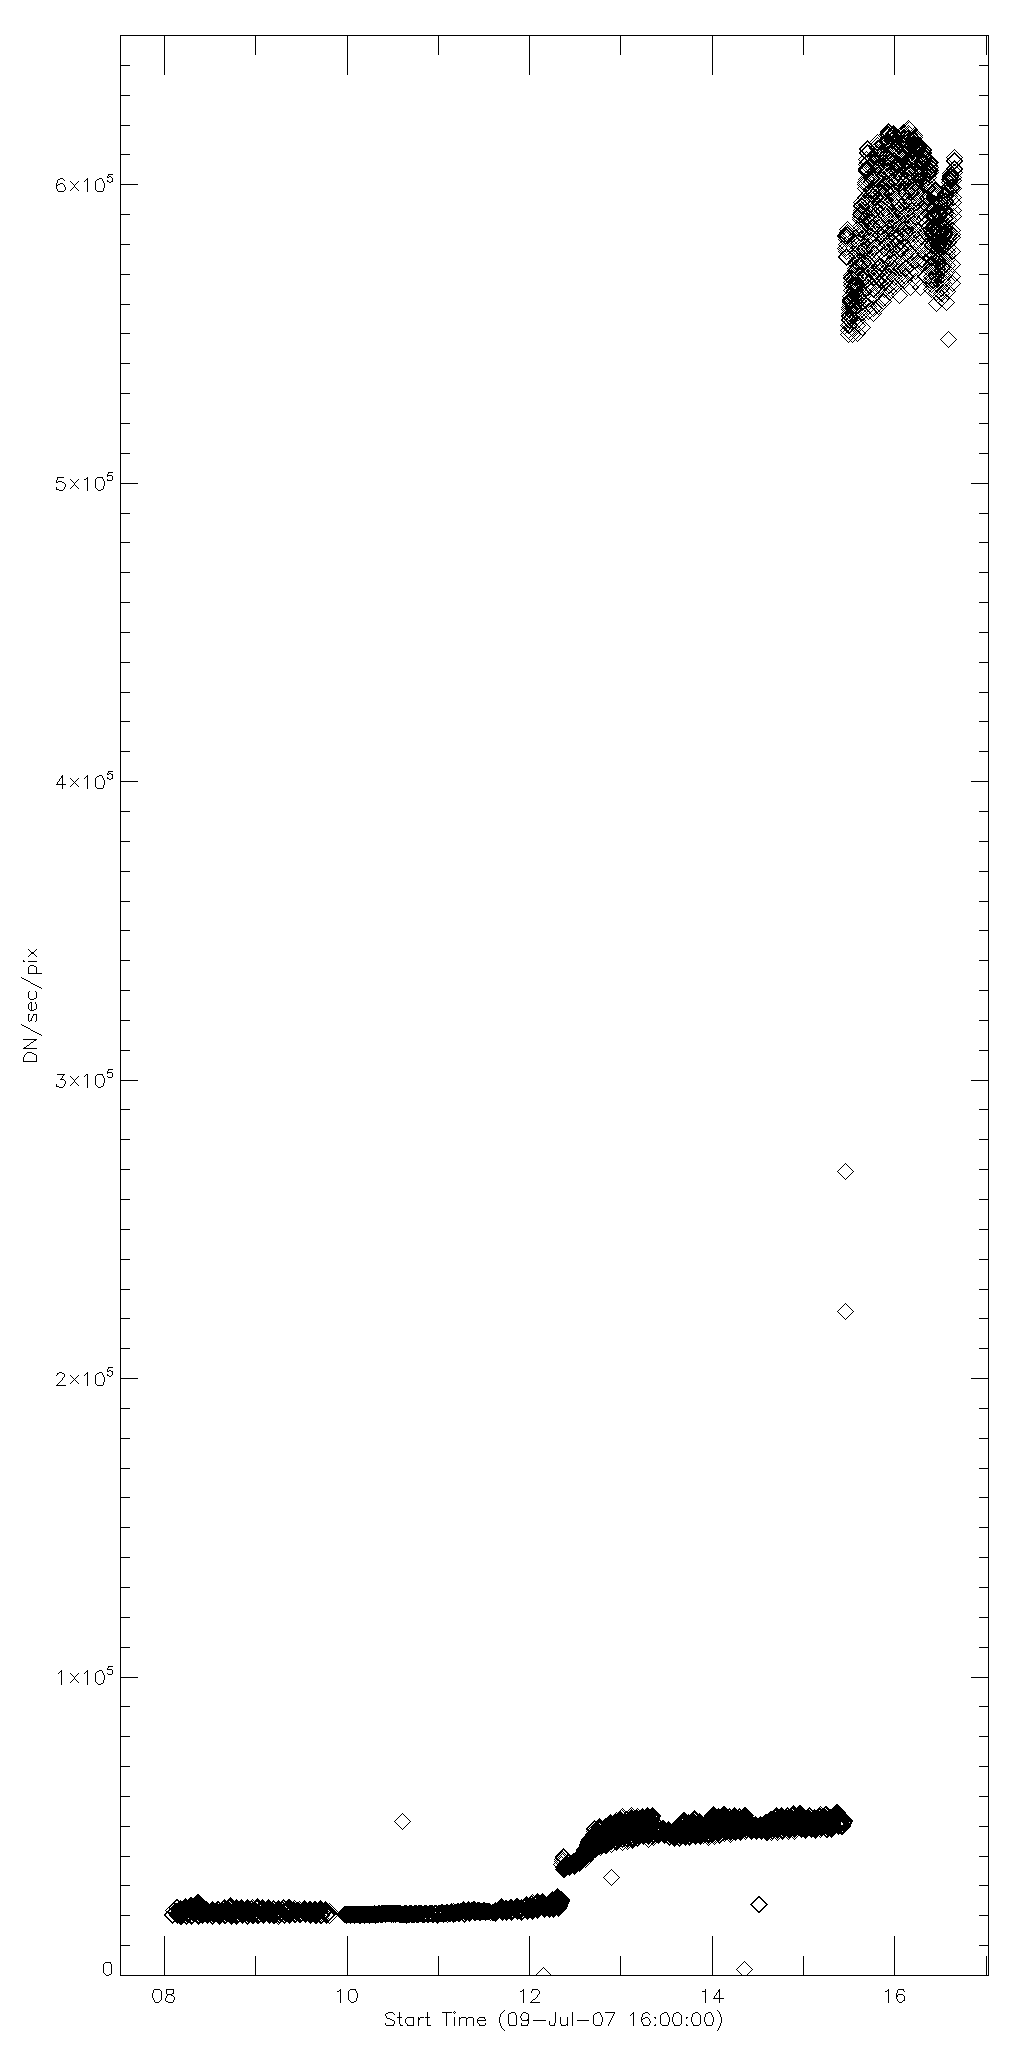
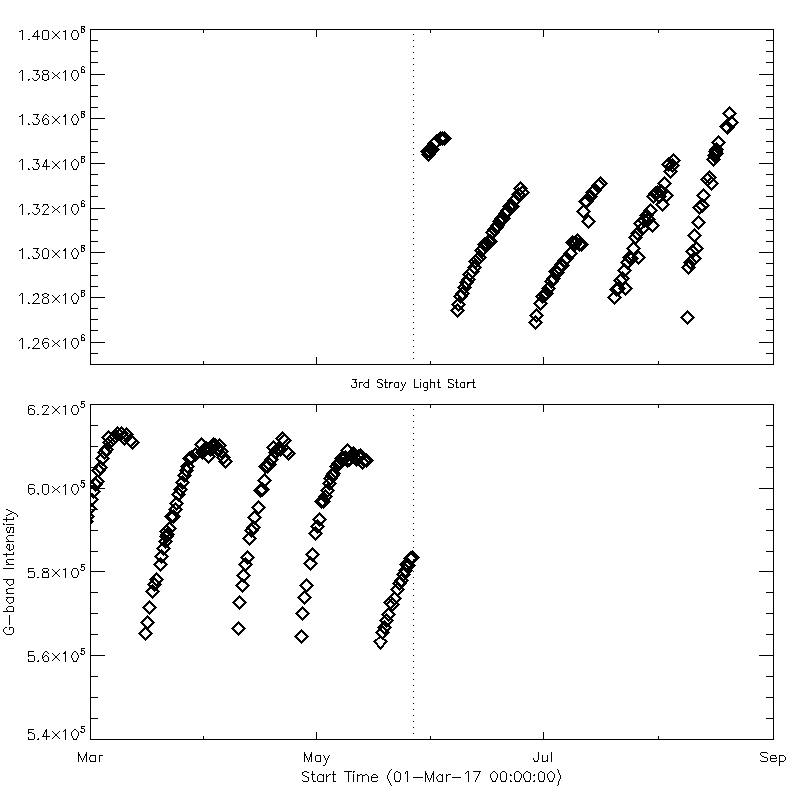
[Update_1: data added after the 3rd stray light increase on 27-May-2017]
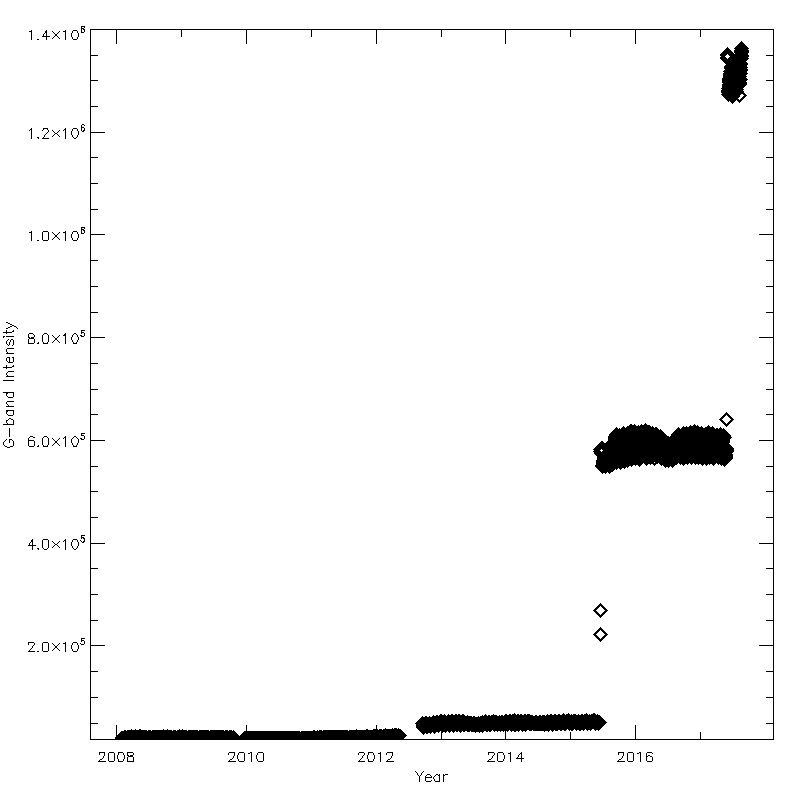
Reading from Fig. 4.1.6, the G-band intensity right before 27-May (shown
in the lower panel) was 5.84x10⁵ (DN/sec/full-res-pix),
while the value interporated back to 27-May in the upper panel is
1.34x10⁶ (DN/sec/full-res-pix).
This yields the increase by 2.3 times.
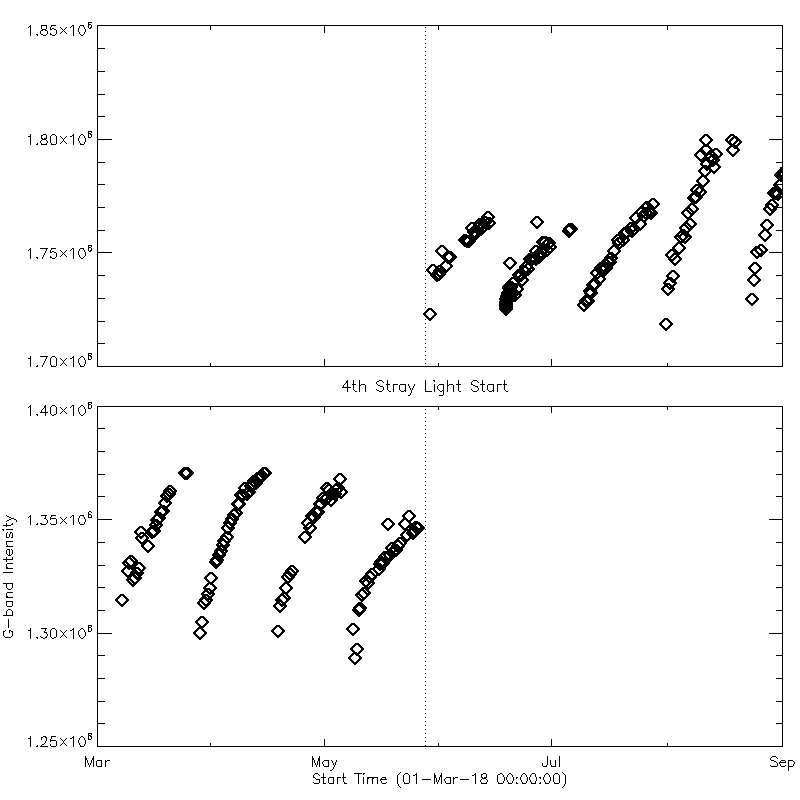
[Update_2: data added after the 4th stray light increase on 29-May-2018]
From Fig. 4.1.7, the G-band intensity before and after 29-May is ~1.33.
The 4th event occurred during the CCD bakeout, and so the estimation was
made from the compariton of bottom part of the curves before and after
the pre-filter failure event. For example, it was ~1.3e6(~1.72e6)
before(after) the event on 29-May-2018.
[click image to enlarge]
Fig.4.1.4 : Jan-2008 through Aug-2017.
Plot in a same scale. |
Fig.4.1.5 : Jan-2008 through Aug-2017.
Plots in separate scales. |
 |
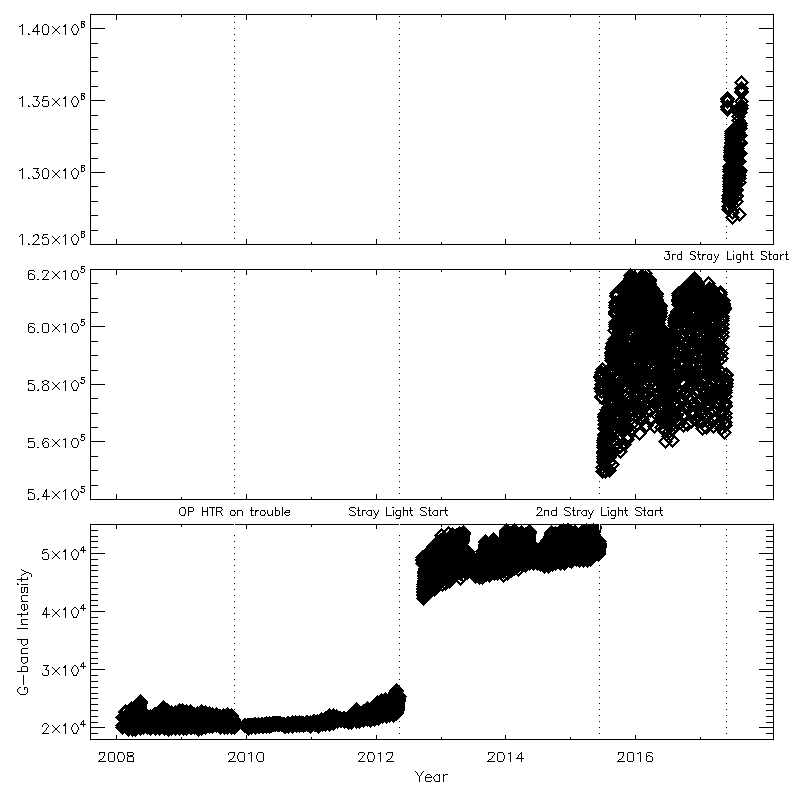 |
Fig.4.1.6 :
close-up, Mar-2017 through Aug-2017.
| Fig.4.1.7 :
close-up, Mar-2018 through Aug-2018. |
 |
 |
4.2 Determination of the baseline of the G-band intensity
(Keiji Yoshimura, 4-Oct-2016).
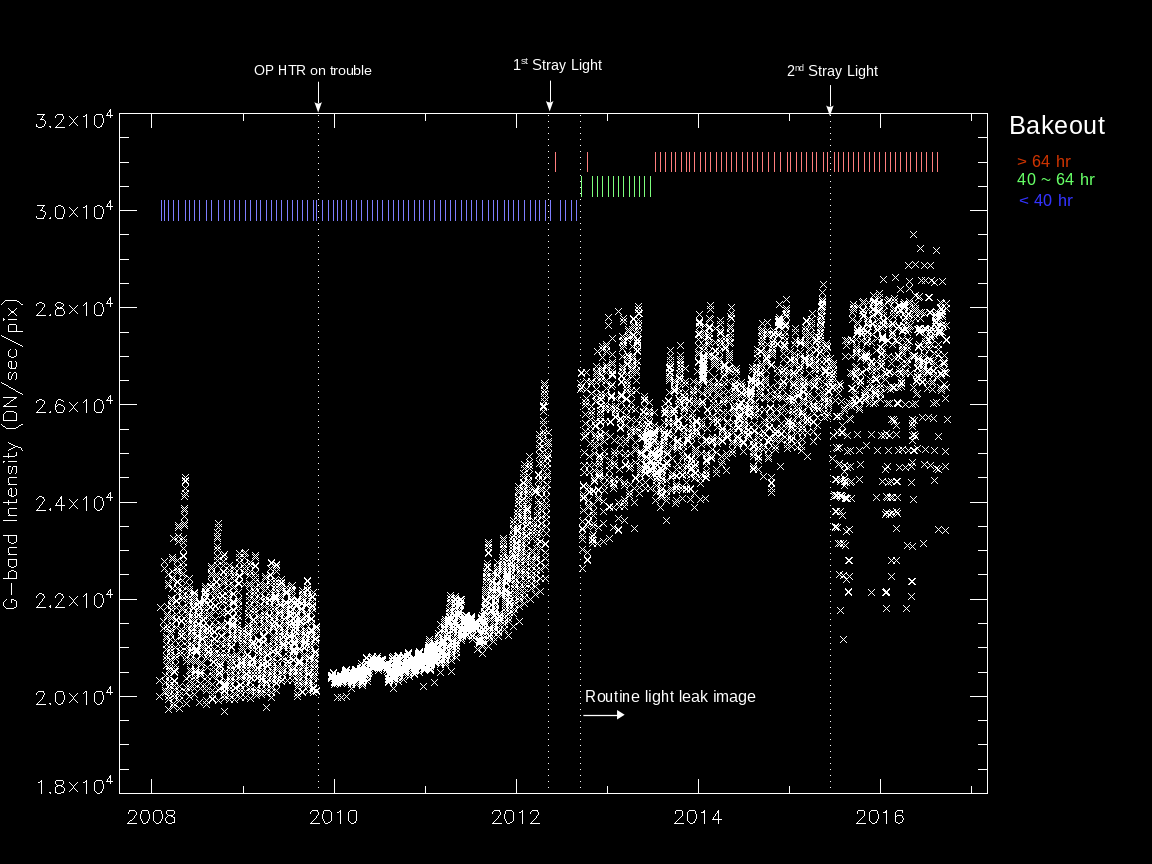
In order to determine the baseline increase of the G-band intensity
due to CCD contaminant, you need to eliminate the effect of
the stray light, which also increase the G-band intensity.
Fig. 4.2.1 shows the G-band intensities after subtracting the stray light
contribution.
| Fig.4.2.1 (click to enlarge) |
|
- Note for Fig. 4.2.1
- The data values after the 1st stray-light increase
(9-May-2012) are calculated with
[G-band(VLS open)]-[G-band(VLS close)].
- A possible explanation of a large scattering of the
data points after the 2nd stray-light increase (14-Jun-2014)
is the mechanical uncertainty of the short exposure time
(3 ms : close to the minimum value of 1 ms).
Even with the scattered data points after the 2nd stray-light event,
we can define the baseline of the G-band intensities, which keep
increasing since 2008 (not quantified yet).
According to this curve, the current value of the baseline
is approximately 2.6x10^4 (DN/sec/pix), which is ~30% increase from
the value in 2008 (~2.0x10^4 DN/sec/pix).
This amount of increase is converted to the contaminant layer thickness
of 400 to 500 Å. As the contaminant layer grows after the CCD
bakeout operation, the G-band intensities reach up to 2.9 x10^4
(45% increase from 2008). This value is just around the top of
the first maximum of the
model relation curve (corresponds to contaminant layer thickness
of 700 Å).
As of Oct-2016, the thickness of the contaminant layer (around the
mid point of the 2 consecutive bakeouts) is estimated as
600 to 700 Å.
Once Fig. 4.2.1 (i.e., the G-band intensity variation solely due to
contamination accumulation without stray light contribution) is obtained,
we can convert each data point to the contaminant thickness using the
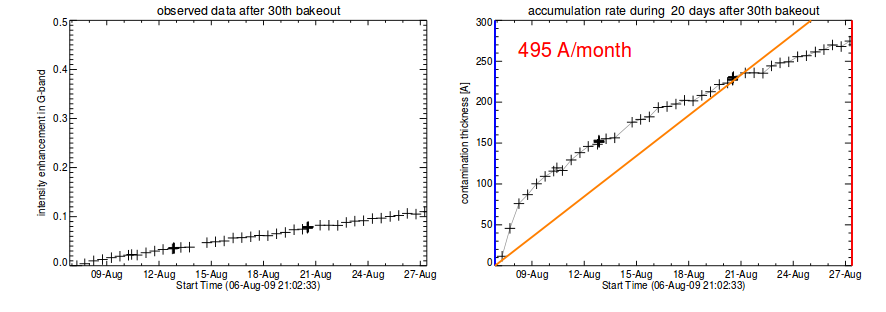
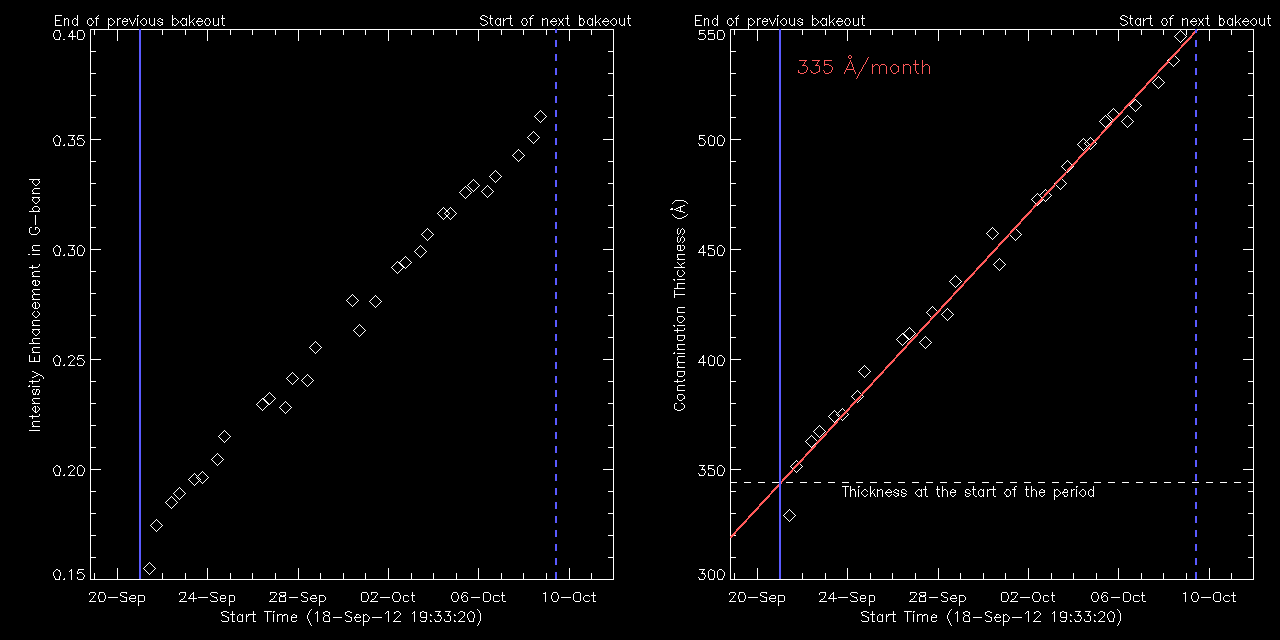
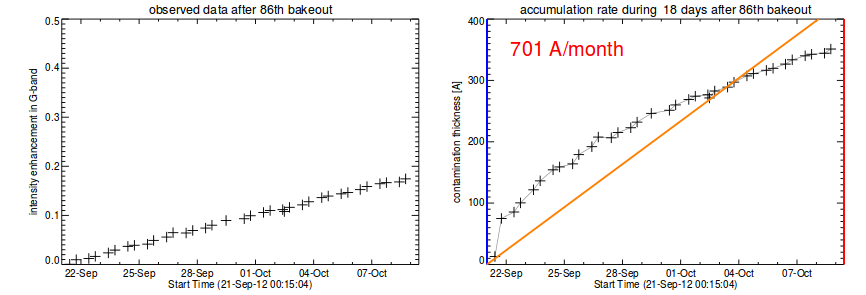
model curve (Fig. 2). Figure 4.3.1 shows an example of the conversion
of the G-band intensities between the two CCD bakeouts, performed on
21-Sep-2012 and 9-Oct-2012. The new analysis shows that the initial
value of the contaminant layer thickness and the growth rate
are 344 Å and 335 Å/month, respectively, while in the old
analysis, the initial thickness was always set to zero and the growth
rate was calculated as 701 Å/month for the same period
(see Fig. 4.3.2, below).
Figure 4.3.1 (click image to enlarge) :
The reference value of the relative intensity increase (the left plot)
is chosen to 1.96x10^4 (DN/sec/pix), which is roughly the lowest values
of the G-band intensity in 2008. The relative increase is converted
to the contaminant layer thickness through the model (the right plot),
then linear fitting is applied (red line). The slope of the linear fit
and its extrapolation to the end time of the previous bakeout provide the
growth rate and the initial thickness of this sample period.
|
|
| Figure 4.3.2 (click image to enlarge) : The corresponding plots
from the current official DB. |
|
The derivation of the initial thickness and the growth rate for the
periods after the 2nd stray light increase is more difficult, because of
the following reasons.
- the data dispersion is large (see Fig. 4.2.1, after 14-Jun-2015).
- the range of model curve includes its first maximal (where the
conversion function becomes to have two-values).
The above two difficulties in converting G-band intensities to contaminant
layer thickness were handled with the following measures:
- instead of fitting the subtracted values,
[G-band(VLS open)]-[G-band(VLS close)], simply use the values of
[G-band(VLS close)], i.e., the stray light component. This is reasonable
because the behavior of the two quantities are quite similar, and that
it is the relative increase (and not an absolute values) that is used
for the conversion.
- the two-valued nature of the model curve was avoided by applying a
separate single-valued model curve depending on which side of
(before/after) the time of the intensity reversal the data point falls on.
The contaminant layer thickness (on CCD) was thereby obtained for the period
from early 2008 through the recent CCD bakeout ended 9-November-2016.
The updated version of the data base file (xrt_contam_on_ccd.geny) was
created and ready for submission to SAO.
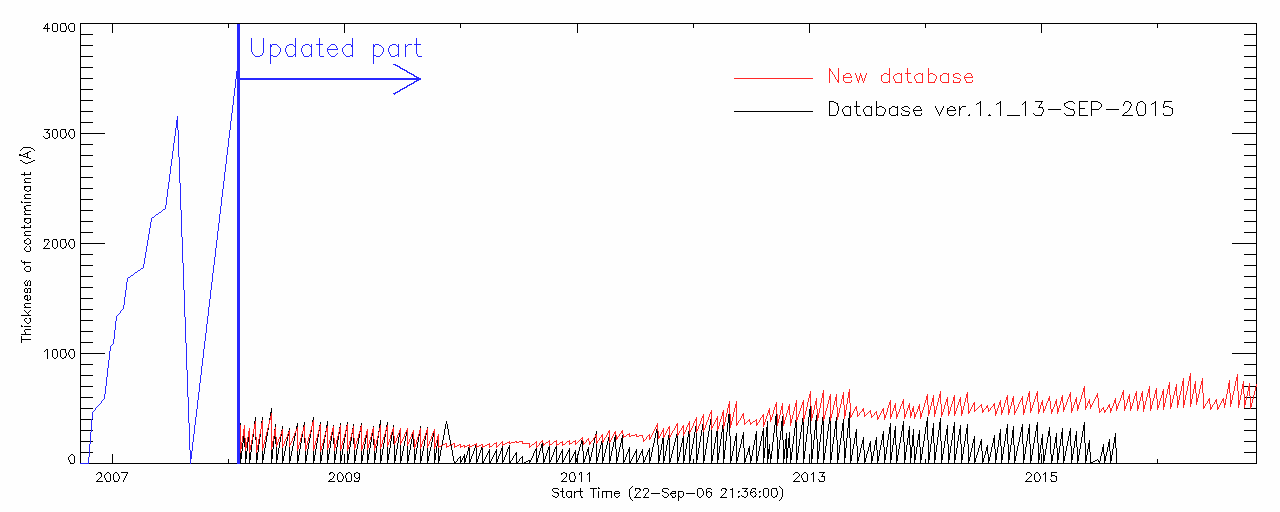
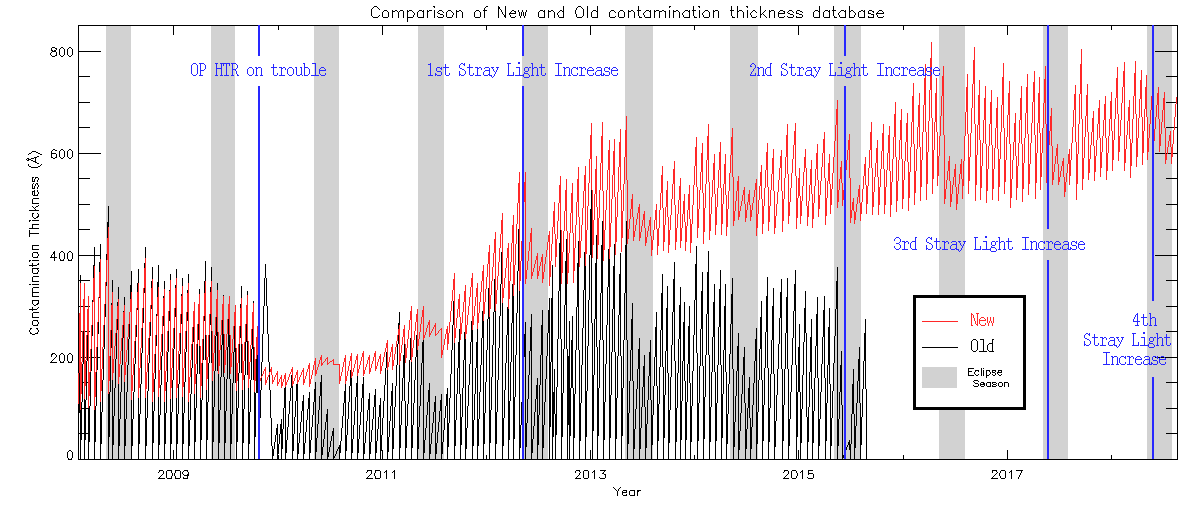
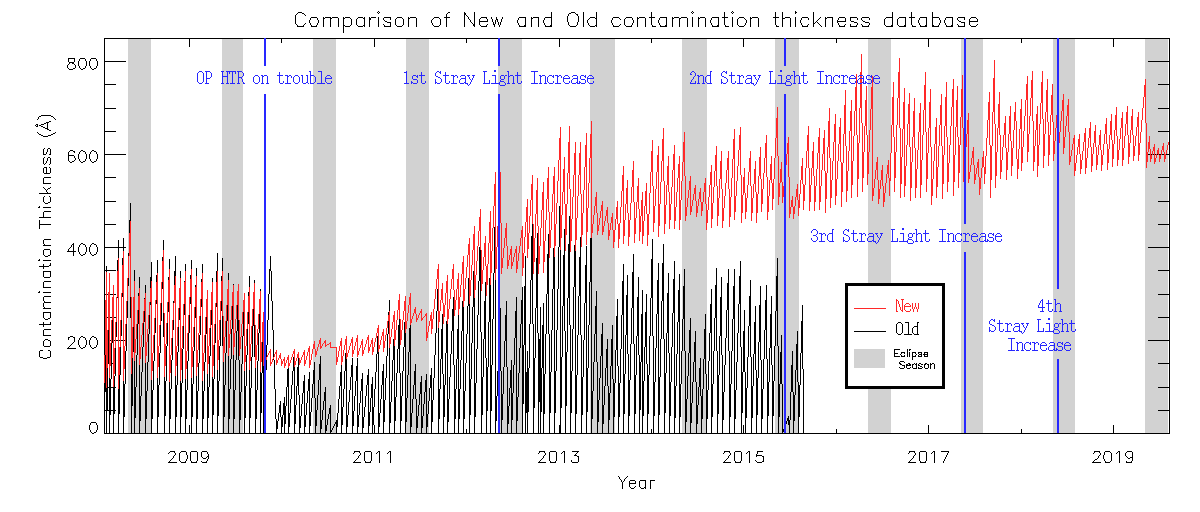
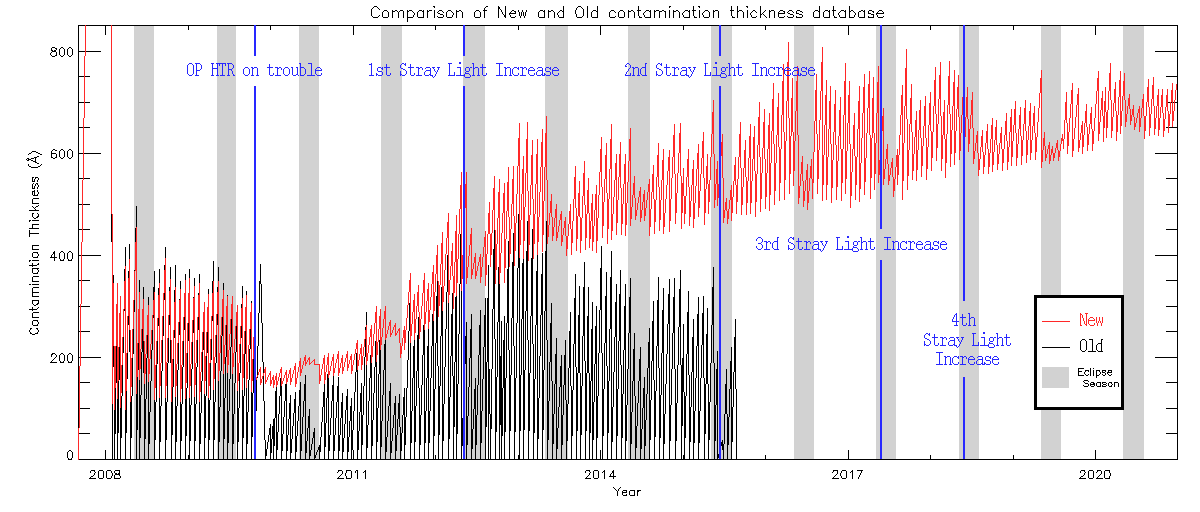
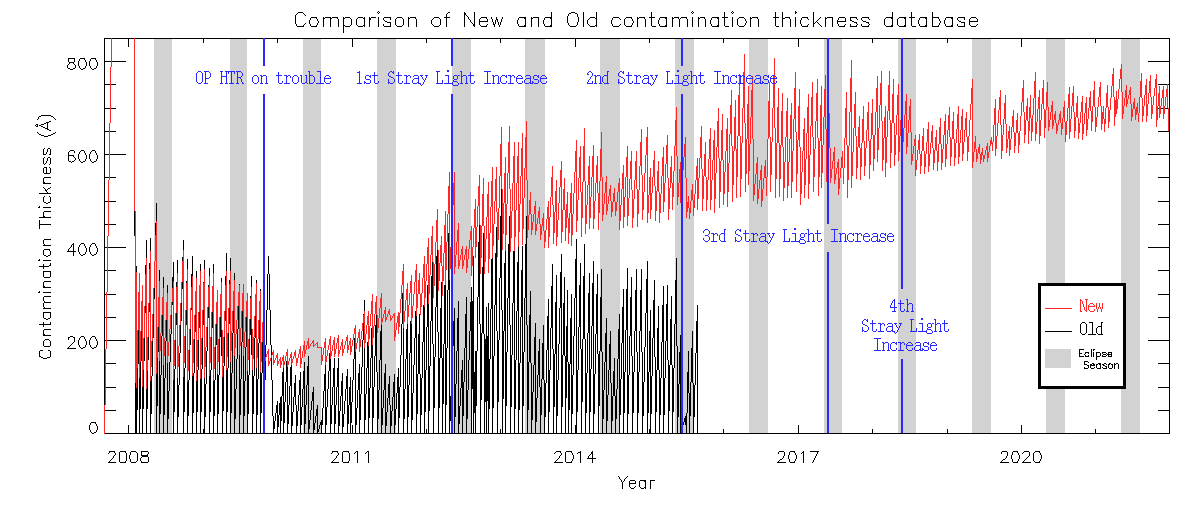
Figure 4.4.1 shows the comparison plot of the old/new values of the
contaminant layer thickness.
| Figure 4.4.1 (click image to enlarge) |
|
Now MSU is ready to update the database file as soon as the level0
data become available for the G-band VLS-closed synoptic images obtained
until the start of the most recent CCD bakeout.
The next step is to discuss the method to transfer the updated file to SAO.
A separate web page
was developed to show a series of plots of the variation of G-band
intensities and their conversion to the contaminant layer thickness
(e.g., Fig. 4.3.1) for all the periods between two consecutive
CCD bakeouts performed since 2008.
The above web page will be updated after every CCD bakeout
(i.e., as soon as the level0 data of the relevant period become available).
Compared with the plots from the previous database (by N. Narukage),
the data points of the contaminant layer thickness spread more linearly,
and thus the linear fitting works better (as found in the right-hand plot
of each pair).
This indicates that the conversion of G-band intensity to contaminant
layer thickness was performed properly (using the adequate part of the
model curve).
In the previous cases, the G-band base intensity was always set to zero,
and only the initial part of the model curve has been used.
A special telecon was held among MSU and the XRT managers on 9-Jan-2017.
Yoshimura reported summary of his work and the technical issue
(i.e., the way to regularly update the SSW master database at SAO)
was discussed.
Summary PDF and
Appendix prepared by Keiji Yoshimura for the telecon and
future reference.
| Figure 4.6.1 (click image to enlarge) |
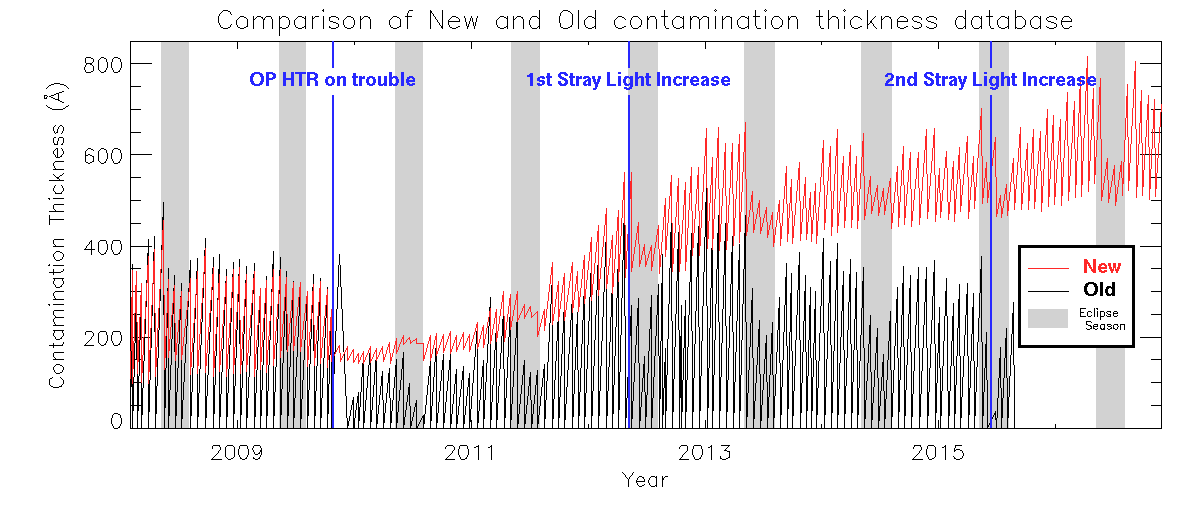
|
[Update_2: data added after the 3rd stray light increase on 27-May-2017]
Contamination thickness is estimated properly after the 3rd stray light
incfrease event.
(The current method will work until G-band VLS=close full-res 1-msec exposure
images start to saturate in the future ...)
[Update_3: plot updated using the data until 14-Apr-2018.]
| Figure 4.6.2 (click image to enlarge) |
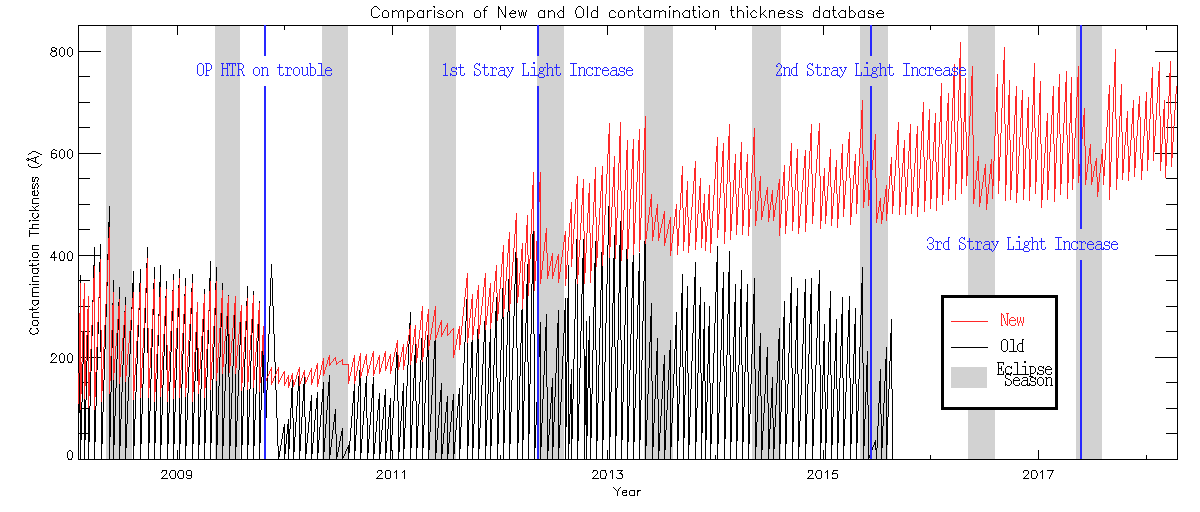
|
[Update_4: plot updated using the data until 19-Aug-2018.]
| Figure 4.6.3 (click image to enlarge) |
|
[Update_5: plot updated using the data until 8-Aug-2019.]
| Figure 4.6.4 (click image to enlarge) |
|
[Update_6: plot updated using the data until 27-Dec-2020.]
| Figure 4.6.5 (click image to enlarge) |
|
[Update_7: plot updated using the data until 27-Dec-2021.]
| Figure 4.6.6 (click image to enlarge) |
|
The impact of the improved contaminant database on XRT response function
is non-significant (see pages 2-3 of the summary PDF).
However, understanding the true status of the contaminant accumulation
on CCD is important to support the reliability
of our current method of calibration.
The CCD bakeout performed in December 2017 was longer than usual
(it was caused by mis-operation). The CCD heater was kept on for a
little over 120 hours (12/10 06:27UT --- 12/15 08UT).
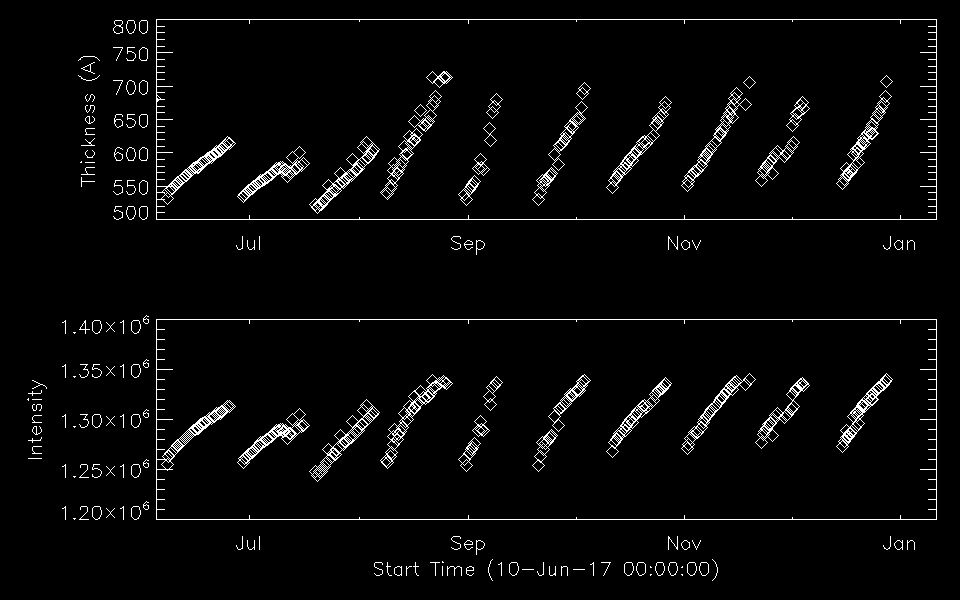
The plot below (created by K. Yoshimura) shows the variations of
G-band intensity and contamination thickness throughout 2017.
It turned out that no significant improvement in the level of
contamination was observed by this extra-long bakeout.
| Figure 4.7.1 (click image to enlarge) |
|
For the period 2021/12/27 thgouth 2022/02/09, XRT had been powered off
because of Hinode satellite's attitude control system failure.
XRT power turned back on was followed by the CCD bakeout about 2 weeks until
n on 2/22. Checking the data after bakeout indicates no significant
increase of the CCD contamination layer thickness. (checked by K. Yoshimura
in March, 2022).
Since slightly before the 5th stray light increase event on 2022/06/08,
the G-band intensity experienced unexpected increase. This means
we are unable to determine the contamination thickness
using the current method (using the theoretical curve of Fig.2).
K. Yoshimura devised the method to estimate the contamination layer thickness
in 2022.
For details, go to
K. Yoshimura's presentation file
at XRT calibration meeting, 2023/02/16 .
Also see
Summary page
(G-band intensity increase since May 2022)


