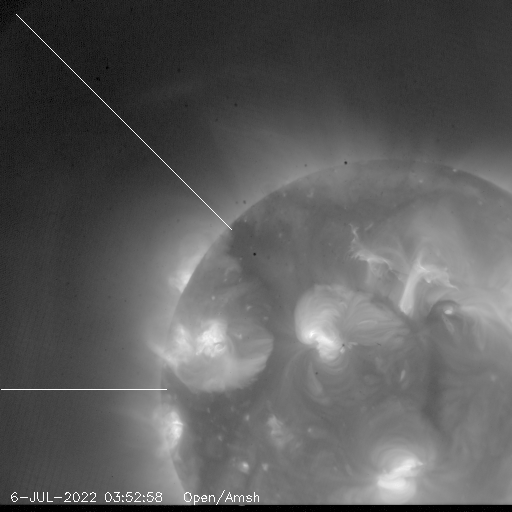
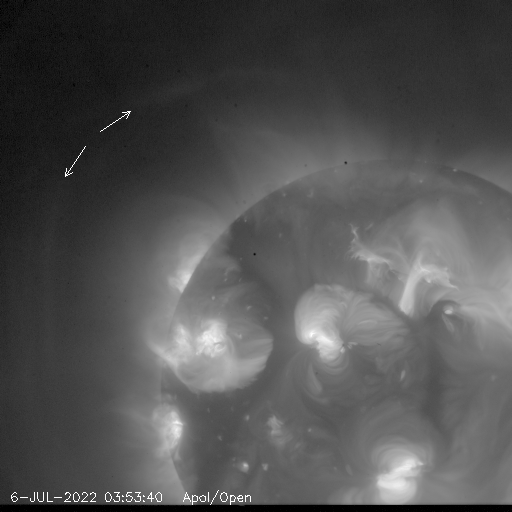
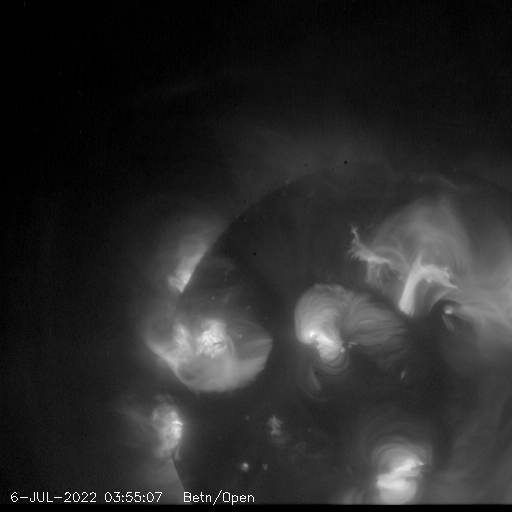
[Table 1] XRT images used for the study of the active corona.
----------- Al-mesh --------------
  date       time    exposure time
                        (sec)
----------------------------------
16-JUL-2022 03:48:29   0.0020
16-JUL-2022 03:48:41   0.1280
16-JUL-2022 03:48:47   0.7255
16-JUL-2022 03:48:53   0.7251
16-JUL-2022 03:48:59   0.7255
16-JUL-2022 03:49:11   0.7240
16-JUL-2022 03:52:22   0.0020
16-JUL-2022 03:52:28   0.1280
16-JUL-2022 03:52:33   0.7255
16-JUL-2022 03:52:39   0.7250
16-JUL-2022 03:52:52   0.7239
16-JUL-2022 03:52:58   0.7255

19-JUL-2022 19:09:02   (*)
----------------------------------
(*) stray light image
|
----------- Al-poly --------------
  date       time    exposure time
                        (sec)
----------------------------------
16-JUL-2022 03:49:19   0.0123
16-JUL-2022 03:49:25   0.1812
16-JUL-2022 03:49:31   1.4454
16-JUL-2022 03:49:39   1.4438
16-JUL-2022 03:49:46   1.4453
16-JUL-2022 03:49:52   1.4449
16-JUL-2022 03:53:06   0.0123
16-JUL-2022 03:53:12   0.1812
16-JUL-2022 03:53:20   1.4438
16-JUL-2022 03:53:27   1.4453
16-JUL-2022 03:53:33   1.4449
16-JUL-2022 03:53:40   1.4453

19-JUL-2022 19:09:11   (*)
----------------------------------
(*) stray light image
|
----------- thin-Be --------------
  date       time    exposure time
                        (sec)
----------------------------------
16-JUL-2022 03:50:01   0.0163
16-JUL-2022 03:50:06   0.5127
16-JUL-2022 03:50:18   2.8977
16-JUL-2022 03:50:26   2.8995
16-JUL-2022 03:50:34   2.8989
16-JUL-2022 03:50:48   2.8977
16-JUL-2022 03:50:56   2.8992
16-JUL-2022 03:51:04   2.8989
16-JUL-2022 03:53:48   0.0163
16-JUL-2022 03:54:00   0.5120
16-JUL-2022 03:54:06   2.8992
16-JUL-2022 03:54:14   2.8989
16-JUL-2022 03:54:22   2.8992
16-JUL-2022 03:54:36   2.8977
16-JUL-2022 03:54:47   2.8992
16-JUL-2022 03:55:07   2.8977
----------------------------------
|
[Figure 1] prepared by hicorona/hicorona_syn4paper.pro,
hicorona_syn_eps.pro
XRT composite images of the active corona processed
from the images listed in Table 1 (see text for detail). Left: image
processed for the Al-mesh filter. Middle: for the Al-poly filter.
Right: for the thin-Be filter. Two arrows in the Al-poly image indicate
the location of ghost pattern of XRT. Two lines appeared in the Al-mesh
image is the location of the intensity profile shown in Figure 12.

|

|

|
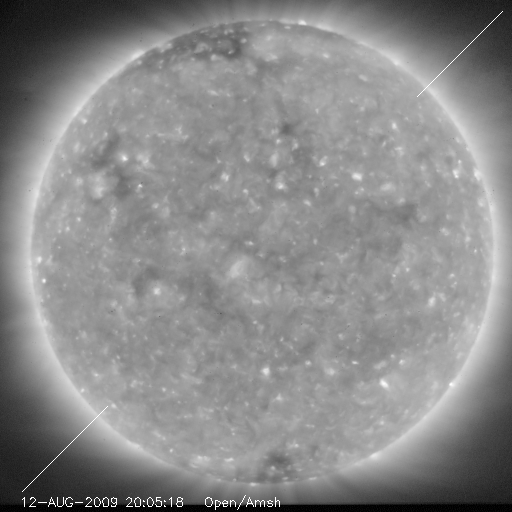
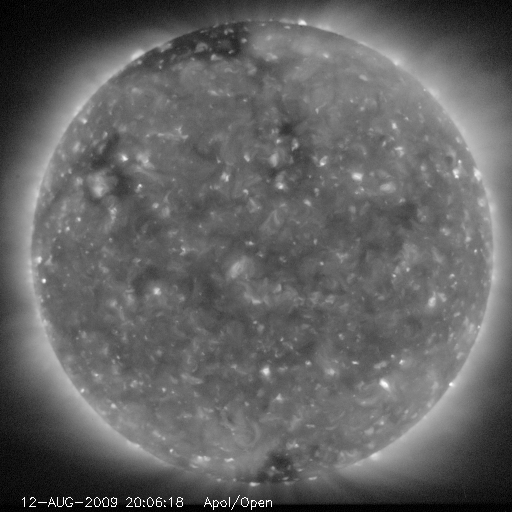
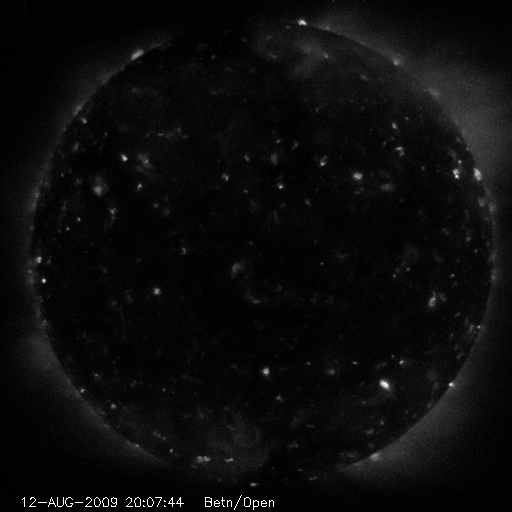
[Table 2] XRT images used for the study of the minimum corona.
----------- Al-mesh --------------
  date       time    exposure time
                        (sec)
----------------------------------
12-AUG-2009 20:05:12   0.5121
12-AUG-2009 20:05:18   5.7971
12-AUG-2009 20:14:12   0.5121
12-AUG-2009 20:14:18   5.7971
----------------------------------
|
----------- Al-poly --------------
  date       time    exposure time
                        (sec)
----------------------------------
12-AUG-2009 20:06:13n   0.5128
12-AUG-2009 20:06:18n   5.7971
12-AUG-2009 20:15:13n   0.5128
12-AUG-2009 20:15:18n   5.7971
----------------------------------
|
----------- thin-Be --------------
  date       time    exposure time
                        (sec)
----------------------------------
12-AUG-2009 20:07:44   32.7680
12-AUG-2009 20:16:44   32.7680
----------------------------------
|
[Figure 2] prepared by hicorona/get_disksig_20090812_paper.pro
|
|
|
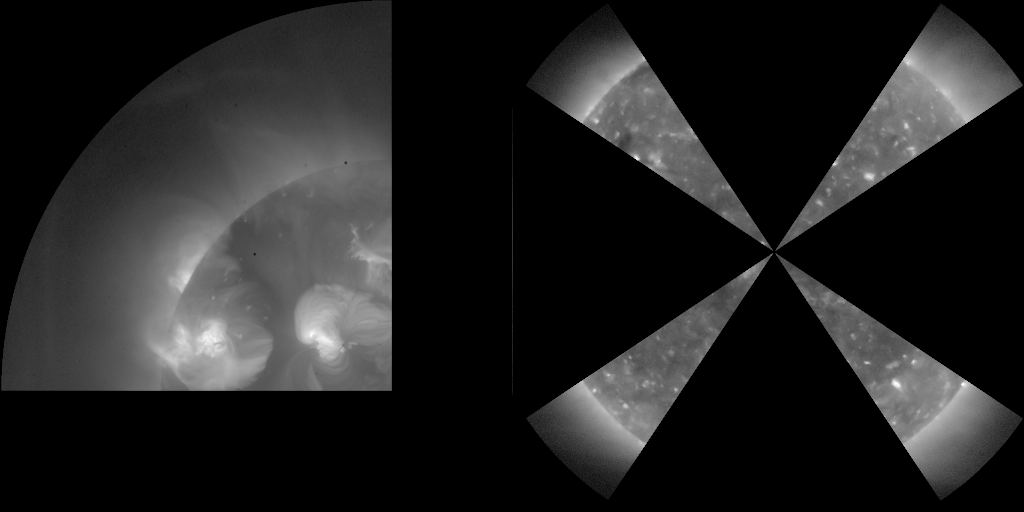
[Figure 3] prepared by hicorona/maskimg_figs.pro
 |
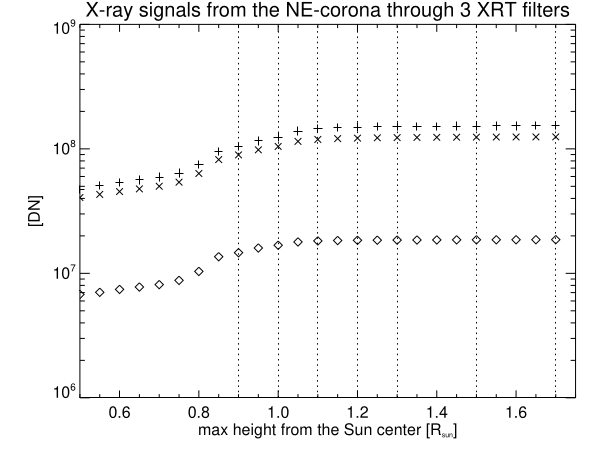
[Figure 4] prepared by hicorona/get_disksig_hic4paper.pro
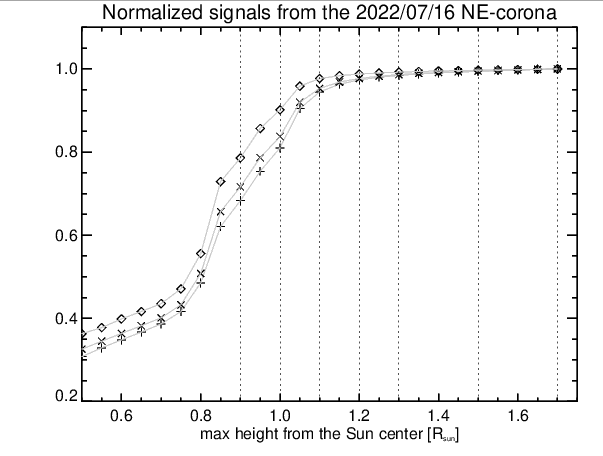
Left: Total XRT signals from the NE-region of the 2022/07/16 corona
included in the different sizes of open area of the masking image
shown in the Figure 3. The plus/cross/diamond symbols indicates the
observed signals with XRT's Al_mesh/Al_poly/thin_Be analysis filters,
respectively. Right: Same as the left plot but signals are normalized
with respect to the value at 1.7Rs for each filter. The vertical dotted
lines indicate the positions where the DN and its normalized value are
listed in Table 3.
[click image to enlarge]
 |
 |
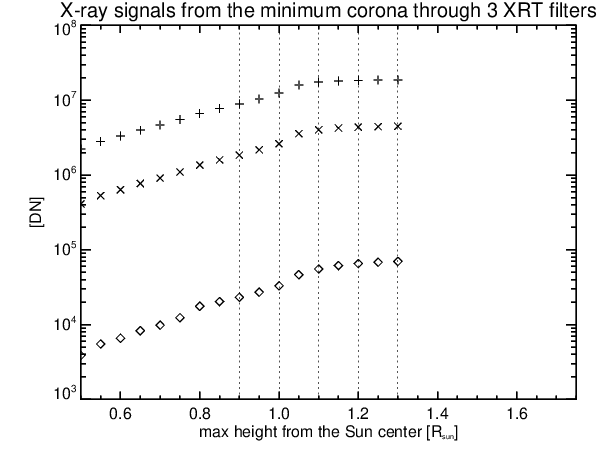
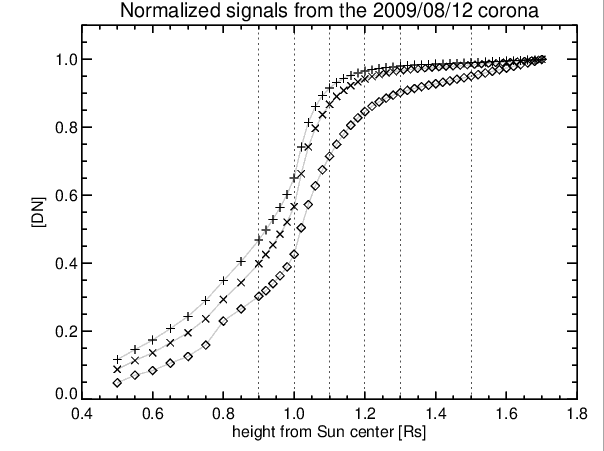
[Figure 5] prepared by hicorona/get_disksig_20090812_epsplot.pro
Total XRT signals from the 2009/08/12 corona included in the different
sizes of open area of the masking image shown in the Figure 3.
The plus/cross/diamond/square symbols indicates the observed signals
with XRT's Al_mesh/Al_poly/thin_Be analysis filters, respectively.
Right: Same as the left plot but signals are normalized with respect
to the value at 1.3Rs for each filter. The vertical dotted lines
indicate the positions where the DN and its normalized value are
listed in Table 4.
[click image to enlarge]
 |
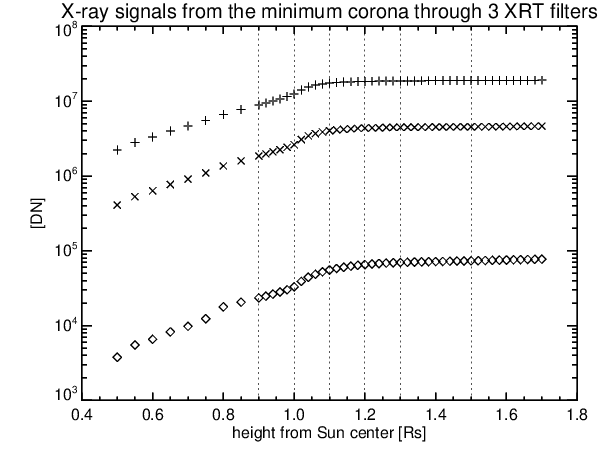
[Figure 6] prepared by hicorona/gen_hialtsig_20090812_eps.pro
[click image to enlarge]
 |
 |
[Table 3]
XRT signals of the active corona observed with 3 X-ray filters.
Readings of the plot in Fig. 4 for selected heights of the FOV.
Signals are in the unit of 108 DN. Normalization was made
relative to the value at 1.7Rs for each filter.
-------------------------------------------------------------
FOV height   Al_mesh        Al_poly         thin_Be
 [Rs]    [10^8 DN](rel.) [10^8 DN](rel.)  [10^8 DN](rel.)
-------------------------------------------------------------
 0.9      1.06  0.685     0.896 0.717      0.145  0.785
 1.0      1.25  0.812     1.05  0.838      0.166  0.901
 1.1      1.46  0.945     1.19  0.954      0.180  0.977
 1.2      1.50  0.974     1.22  0.977      0.182  0.988
 1.3      1.52  0.985     1.23  0.987      0.183  0.993
 1.5      1.53  0.994     1.24  0.995      0.184  0.997
 1.7      1.54  1.00      1.25  1.00       0.185  1.00
-------------------------------------------------------------
[Table 4]
Same as Table 3, but for the minimum corona.
--------------------------------------------------------
FOV height  Al_mesh        Al_poly         thin_Be
 [Rs]  [10^6 DN](rel.) [10^6 DN](rel.) [10^6 DN](rel.)
--------------------------------------------------------
 0.9     8.94  0.469     1.85  0.399     0.0234  0.303
 1.0    12.4   0.652     2.63  0.567     0.0330  0.427
 1.1    17.5   0.916     4.02  0.868     0.0553  0.715
 1.2    18.4   0.965     4.36  0.943     0.0655  0.847
 1.3    18.7   0.980     4.48  0.967     0.0698  0.903
 1.5    18.9   0.991     4.55  0.984     0.0735  0.951
 1.7    19.1   1.00      4.63  1.00      0.0773  1.00
--------------------------------------------------------
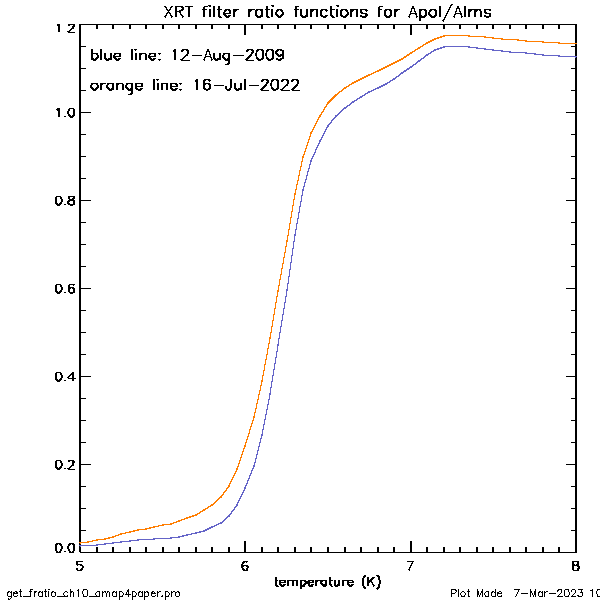
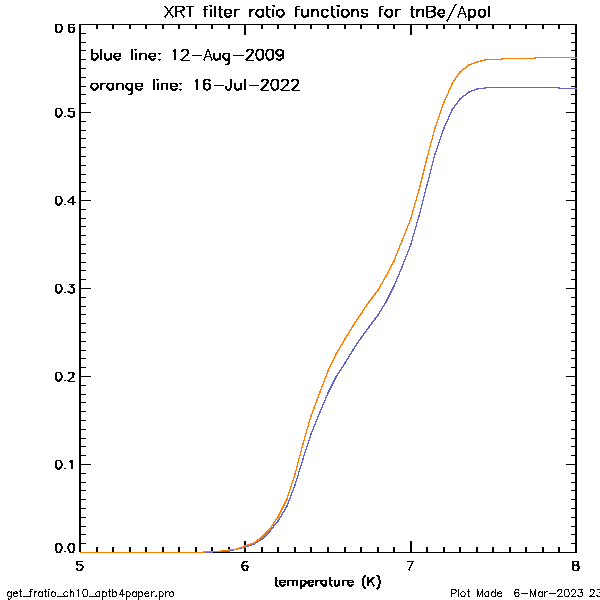
[Figure 7] prepared by xrt_resp/get_fratio_ch10_aptb_eps.pro and
get_fratio_ch10_aptb_eps.pro
The ratios of the temperature response functions used for this analysis.
The left plot is for the Al_poly/Al_mesh filter ratio. The blue(orange)
line are used for the analysis of 12-Aug-2009(16-Jul-2022) data,
respectively. The right plot is the corresponding ratio curves from
the thin_Be/Al_poly filter ratio.
[click image to enlarge]
 |
 |
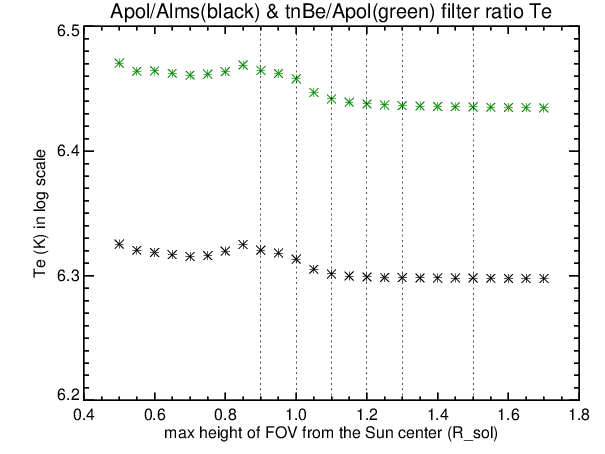
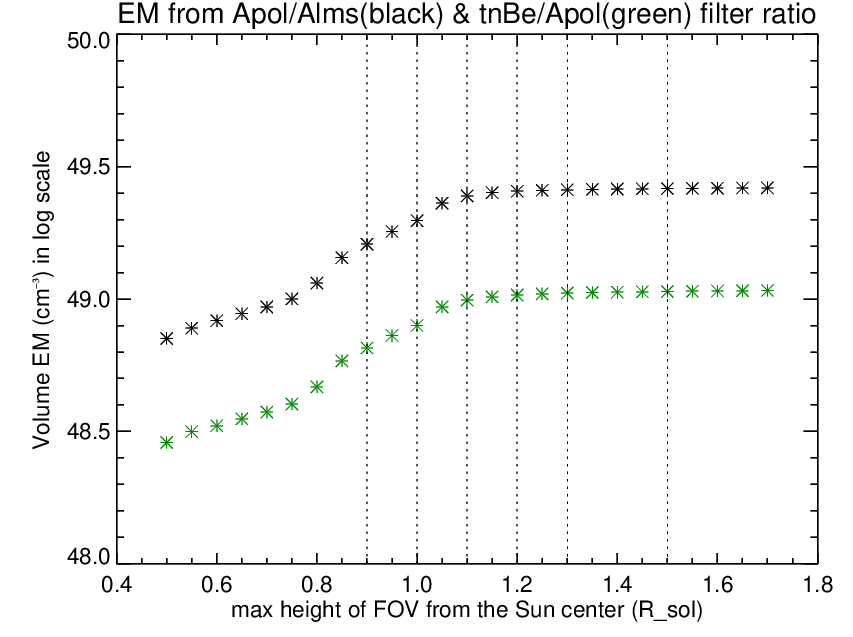
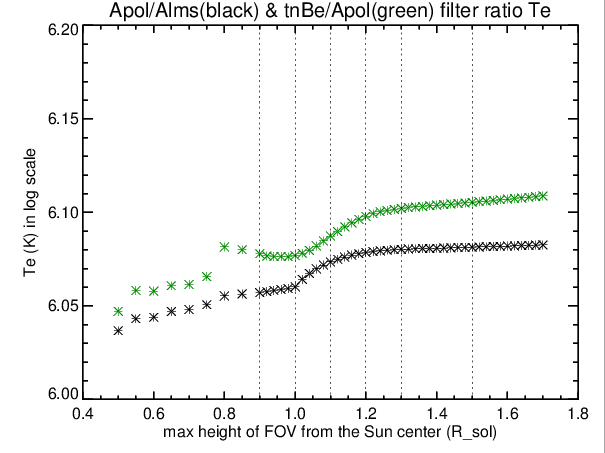
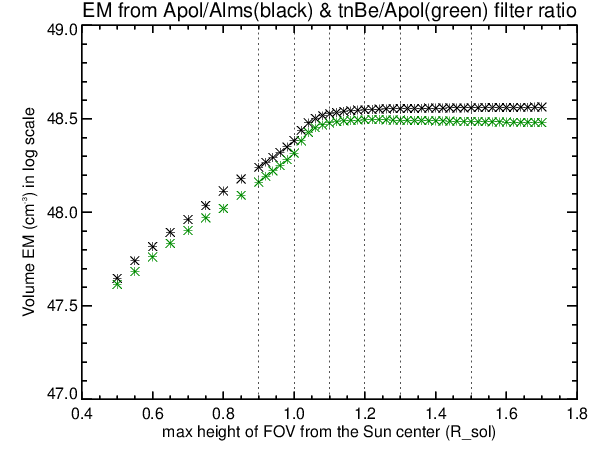
[Figure 8] prepared by hicorona/sig2teem7_hicorona_eps.pro
Filter ratio temperatures and emission measures calculated for the active
corona for the FOVs of varying size. The symbols in black are derived
from the Al_poly/Al_mesh filter ratio, while those in green are from
thin_Be/Al_poly filter ratio.
[click image to enlarge]
 |
 |
[Figure 9] prepared by hicorona/sig2teem7_20090812_ext_eps.pro
Same as Fig.8, but for the minimum corona calculated from the extended
Te and EM plotted in Fig.6.
[click image to enlarge]
 |
 |
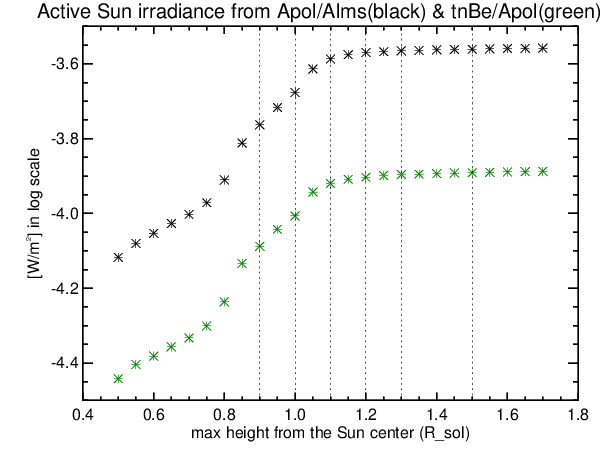
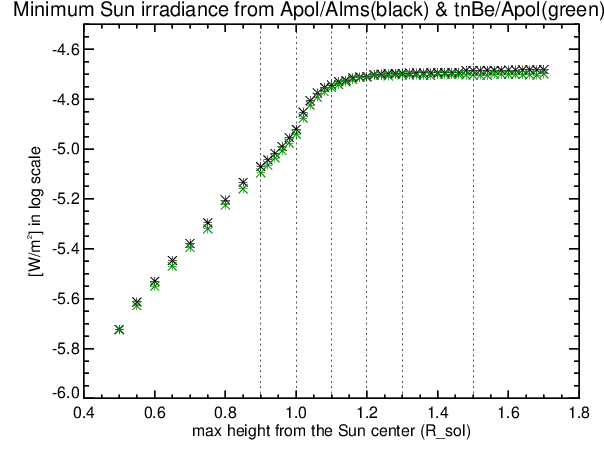
Soft X-ray irradiance calculatded for the varying size of FOV.
[Figure 10] prepared by hicorona/teem2irr7_hic4paper.pro &
teem2irr_20090812_4paper.pro
XRT irradiance (5-60A) obtained as a function of the size of FOV.
Left : plot for active corona observed on 2022/07/16. Black symbols
are data obtained from the Al_pol/Al_mesh filter ratio, while green
symbols are from thin_Be/Al_poly filter ratio. The vertical dotted
lines indicate the positions where the irradiance and its normalized
value are listed in Table 5. Right : corresponding plot for the
minumum corona observed on 2009/08/12.
[click image to enlarge]
 |
 |
[Table 5]
XRT irradiance for the active corona calculated from
Al_poly/Al_mesh and thin_Be/Al_poly filter ratios. Readings of
Fig. 10 for selected heights of FOVs were converted to a linear scale
and listed in the unit of 10-4 W/m2.
The third and sixth columns are relative values to those at 1.7Rs.
The forth and seventh columns are exclusion fraction expressed in percentage.
Note that these irradiance values are for a quarter area of the Sun.
The full-Sun irradiance is estimated as roughly 4 times larger than
the values listed here.
---------------------------------------------------------------------------------
FOV height          Apol/Alms irrad.                    tnBe/Apol irrad.
 [Rs]     [10^(-4) W/m^2] (rel.) excl.frac.[%] [10^(-4) W/m^2] (rel.) excl.frac. [%]
---------------------------------------------------------------------------------
 0.9            1.72      0.623     37.7         0.816       0.630     37.0
 1.0            2.14      0.761     23.9         0.985       0.760     24.0
 1.1            2.56      0.936      6.4         1.20        0.929      7.1
 1.2            2.69      0.973      2.7         1.25        0.964      3.6
 1.3            2.72      0.983      1.7         1.27        0.981      1.9
 1.5            2.75      0.993      0.7         1.29        0.992      0.8
 1.7            2.77      1.00       0.0         1.30        1.00       0.0
---------------------------------------------------------------------------------
[Table 6]
Same as Table 5, but for the minimum corona. Irradiances are in
the unit of 10-5 W/m2.
---------------------------------------------------------------------------------
FOV height          Apol/Alms irrad.                    tnBe/Apol irrad.
 [Rs]     [10^(-5) W/m^2] (rel.) excl.frac.[%] [10^(-5) W/m^2] (rel.) excl.frac.[%]
---------------------------------------------------------------------------------
 0.9          0.851      0.409    59.1            0.803     0.400     60.0
 1.0          1.20       0.576    42.4            1.15      0.572     42.8
 1.1          1.81       0.867    13.3            1.76      0.880     12.0
 1.2          1.96       0.939     6.1            1.94      0.969      3.1
 1.3          2.01       0.967     3.3            1.98      0.990      1.0
 1.5          2.06       0.991     0.9            1.98      0.988      1.2
 1.7          2.08       1.00      0.0            2.00      1.00       0.0
---------------------------------------------------------------------------------
[Table 7] calculated by calc_phnoise_20220716.pro, calc_phnoise_20090812.pro, hicorona_syn4unc_alms.pro, hic20090812_syn4unc_apol.pro, etc.
Statistical and non-statistial uncertainties calculated for the
total XRT signals within FOVs.
---------------------------------------------------------------------------------
FOV height         Al_mesh               Al_poly               thin_Be
             stat[%]  non-stat[%]   stat[%]  non-stat[%]   stat[%]  non-stat[%]
---------------------------------------------------------------------------------
2022/07/16 active corona images
---------------------------------------------------------------------------------
1.1          0.014      0.0114      0.016      0.0039        0.051    0.0080
1.3          0.013      0.0110      0.016      0.0038        0.050    0.0079
1.5          0.013      0.0109      0.015      0.0038        0.050    0.0079
1.7          0.013      0.0109      0.015      0.0038        0.050    0.0079
---------------------------------------------------------------------------------
2009/08/12 minimum corona images
---------------------------------------------------------------------------------
1.1          0.022     0.0078       0.070      0.0105        0.855    0.1674
1.3          0.021     0.0083       0.067      0.0110        0.766    0.1634
---------------------------------------------------------------------------------
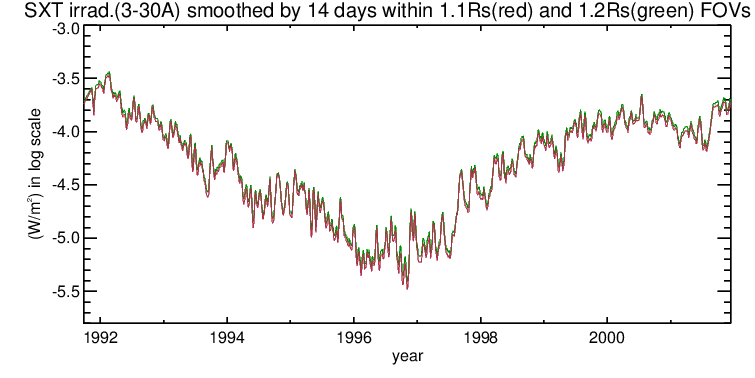 |
|
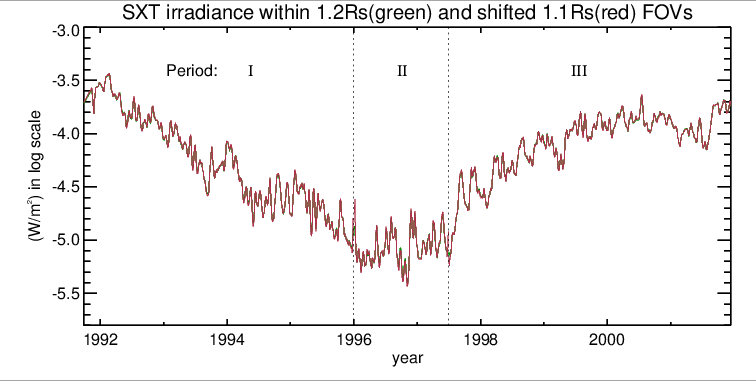 |
[Table 8]
------------------------------------------------------------------------
Period           SXT 1.1/1.2  (AlMg/Al.1)                 XRT 1.1/1.2
           a     sigma   10^(-a) 10^(-a-s) 10^(-a+s)  Apol/Alms thBe/Apol
------------------------------------------------------------------------
  I      0.0320  0.0189   0.929    0.889    0.970         ---    ---
  II     0.0460  0.0257   0.899    0.848    0.954        0.923  0.907
 III     0.0335  0.0161   0.926    0.892    0.961        0.952  0.960
------------------------------------------------------------------------
[Figure 12] prepared by y_legacy/irrad4/connect_dailyirrad_330b_4paper.pro
[click image to enlarge]
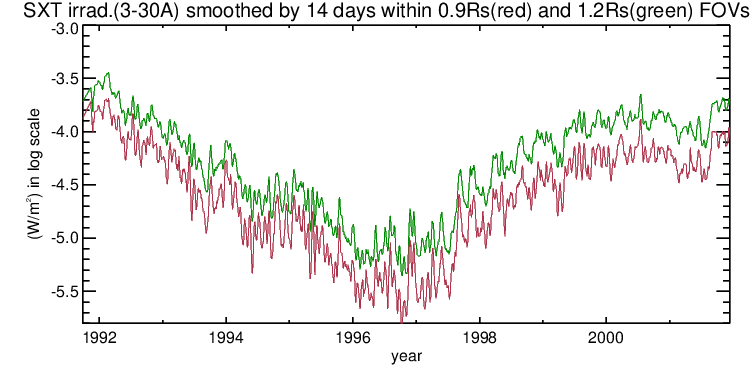 |
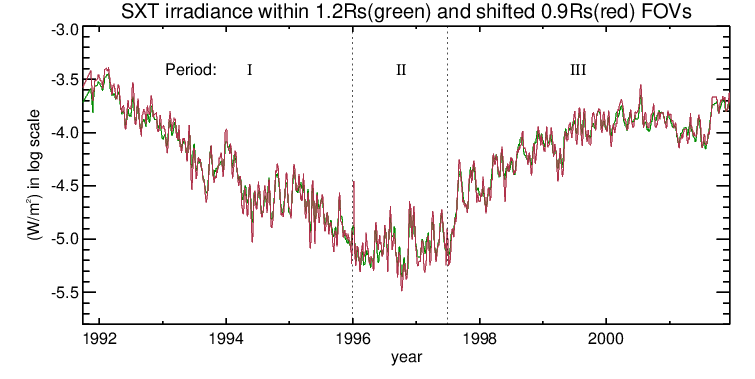 |
[Table 9]
Same as Table 8, but for the comparison of 0.9Rs vs 1.2Rs.
------------------------------------------------------------------------
Period           SXT 0.9/1.2  (AlMg/Al.1)                 XRT 0.9/1.2
           a     sigma   10^(-a) 10^(-a-s) 10^(-a+s)  Apol/Alms thBe/Apol
------------------------------------------------------------------------
  I      0.300   0.167     0.501   0.342   0.735       ---      ---
  II     0.354   0.200     0.443   0.279   0.701      0.434     0.414
 III     0.336   0.161     0.461   0.318   0.668      0.639     0.653
------------------------------------------------------------------------
[Figure 13] prepared by hicorona/disksig2rad_20220716_4paper.pro
and rad_prof_20220716_4paper.pro
[click image to enlarge]
 |
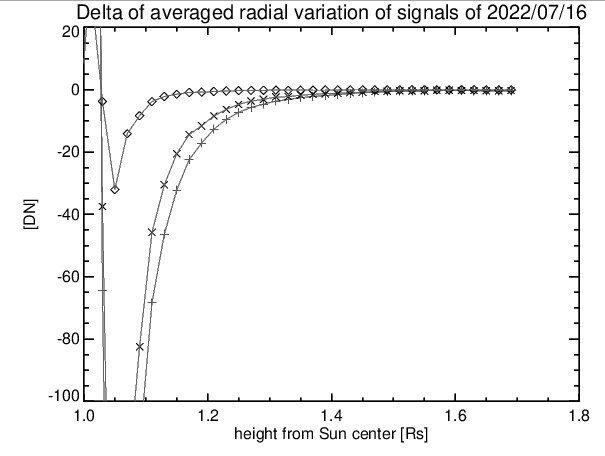 |
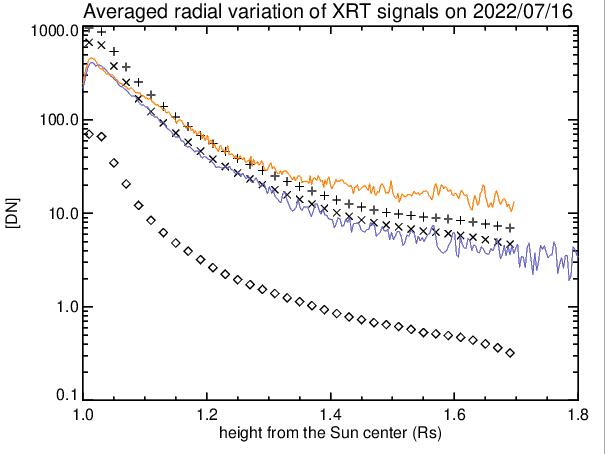
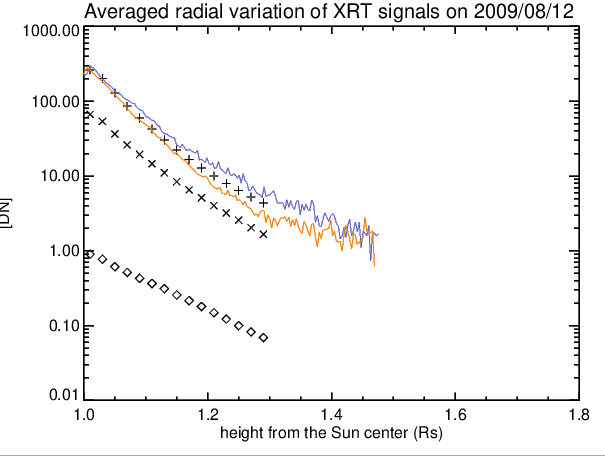
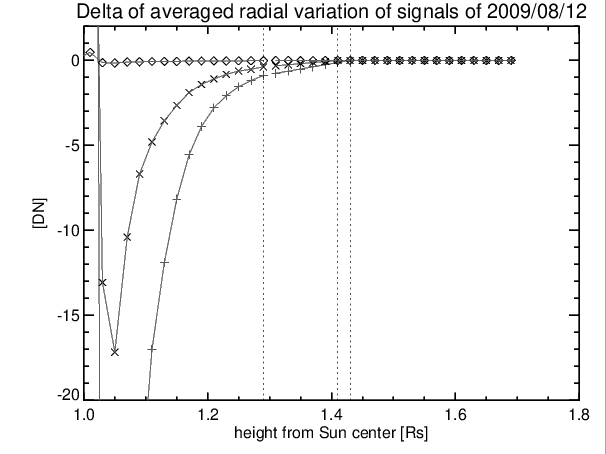
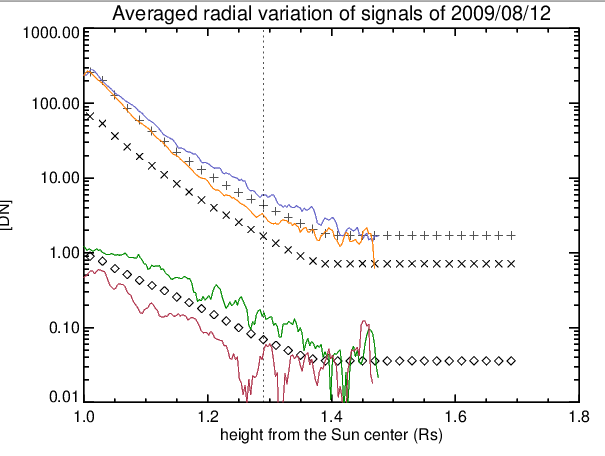
[Figure 14] hicorona/disksig2rad_20090812_4paper.pro and
rad_prof_20220716_4paper.pro
[click image to enlarge]
 |
 |
[Figure 15] prepared by hicorona/rad_prof_20220716_4paper.pro
[click image to enlarge]
 |