Week 7
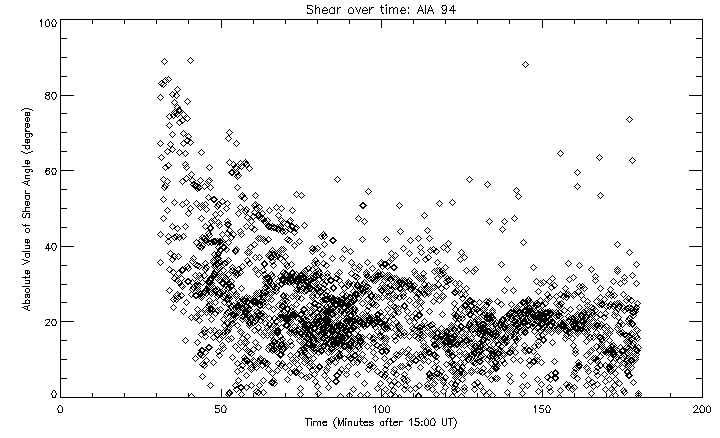
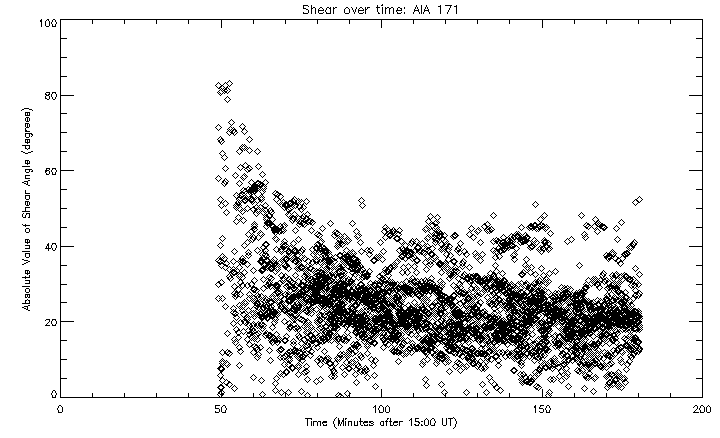
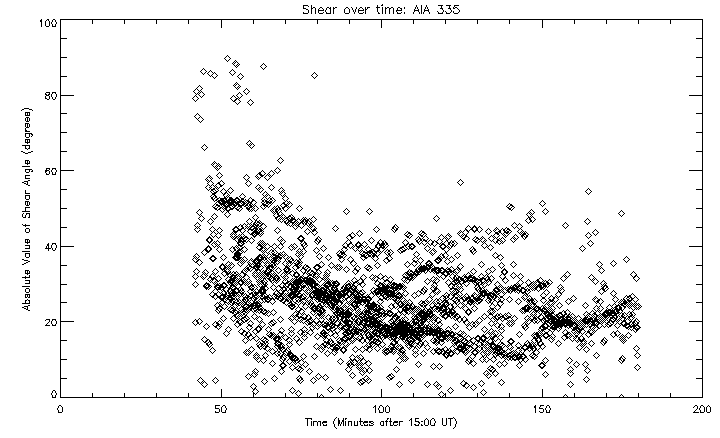
I built a program that would plot the shear over time. This was a bit difficult because the array for time and the array for the angles of the loops were not the same sizes. However, I solved the issue by adjustign the lengths of the arrays so that the time array aligned with each individual flare loop angle. I produced these time v. shear graphs for 171A and 335A. Both were very scattered, but a clear trend of strong to weak shear is visable in both. The shear evolution occurs in about 30 minutes from when the loops are first visable. The loops only appear after the start of the flare because the loops need time to cool and become visable in the wavelengths that AIA is looking at.
While working on this, I discovered a float vs integer problem in IDL. I multiplied 15*3600 and got -11536. This was a lesson in why decimal points are important when using IDL. There was also some question about the shear being both positive and negative, so the absolute value of the shear was taken rather than the angle from the direct output. I am unsure if this skewed my perception of the results.
I also counted the total number of loops. For 171, there were 10141 loops, for 335, 7163. Not all of these were loops that crossed the PIL and so not all of these have an associated shear.
On Friday, we gave our midterm presentations.
On Saturday, I traveled with Kelvin, Philip, and Micheal to Sacajawea Mountain. It is the highest in the range. Philip is a very fast hiker and I got dizzy with the speed at which they ascended. I guess I am not that adjusted to the altitude afterall. I did not puke, which is a plus. We also saw two herds of white mountain goats. They were upset at us for stealing the trail. I found a hnadful of fossils and crystals on the peak.
Week 8
My abstract for the Hinode confrence was due on Teusday. I spent much of Monday and the weekend revising it. A copy of it is listed as my project description on the 2024 REU home page.
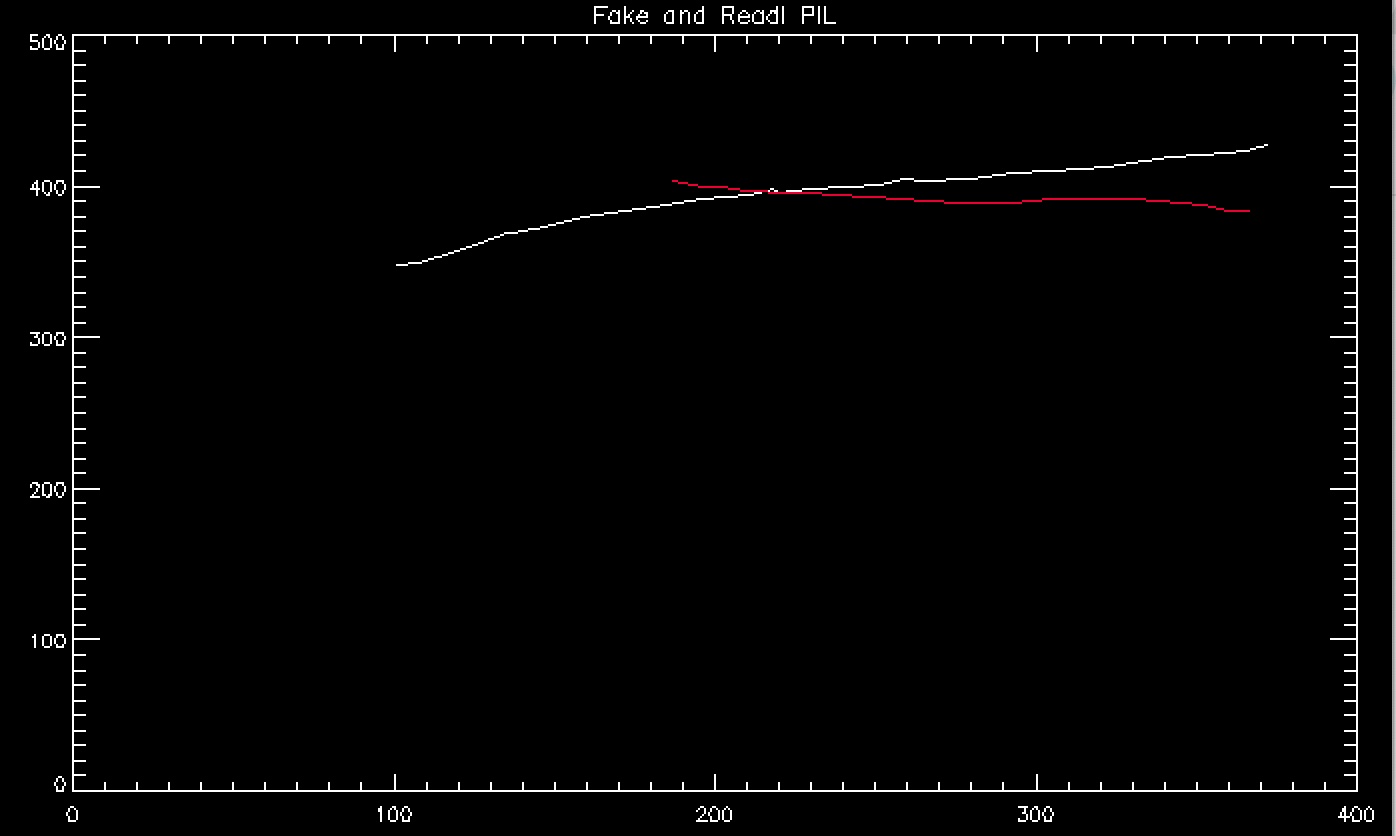
I noticed that most of the loops were not being added to the list of angles. I woundered if that was a factor of not having the PIL and the loops align. An investigation showed that the real and the loop tracing line did not align. This is because the HMI map that the PIL comes from is different from the flare ribbons and the loops that actually occur. According to Aki Takeda, the HMI maps and PILs of the more powerful flares such as the one I am studying this summer have a much more complecated PIL. If this research had more time, or if this issue of the over simplified PIL had been noticed earlier, the shear would likely have been calculated differently. At this point, I make the assumption that the shear I have measured is valid because I am only taking the loops that cross the known segment of the PIL in order to measure the shear.
I have also added the measure of shear for the 94A loops. These appear even earlier than the 335 loops in time. This is the hottest temperature of loops that I measured. Initially, there was a gap in the loops that I measured. This is because I mislabled a file and the program that fits all of the loop structures together could not process it. I had to re-run the tracing program for two sections.
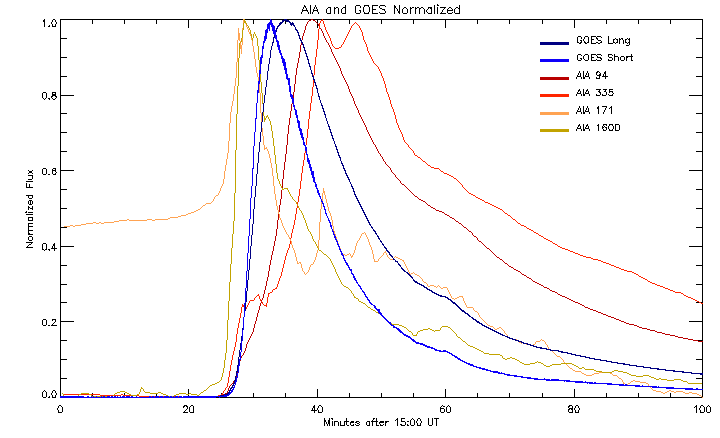
Because Hinode is the next week, I spent most of my time working on my poster. However, I finally got a light curve plot that I liked. Although, I do not know why the 171 wavelength behaves off.
