These were my last two weeks in Bozeman! I am very sad to be leaving because I have made such good friends and have loved living here. My observing has moved to the middle of the night, but the moon has been rising above the haze, so I have been able to record good data. One of the changes we made in week 8 was to up the exposure time on the camera to recieve more light at the 800 and 900 nm filter wavelengths. It has greatly increased the amount of signal we have been recieving, and we think it will account for the noisyness in the DoLP plots at the 800 and 900 nm filter levels. My plan these two weeks is the get all of the polarimetric calibrations that I am missing for different gain and filter times. This will allow me to finalize my DoLP plot for the data I collected this summer! I am working on finishing my presentation and poster for the week 10 poster and presentation days, and I will insert them below when they are finished!
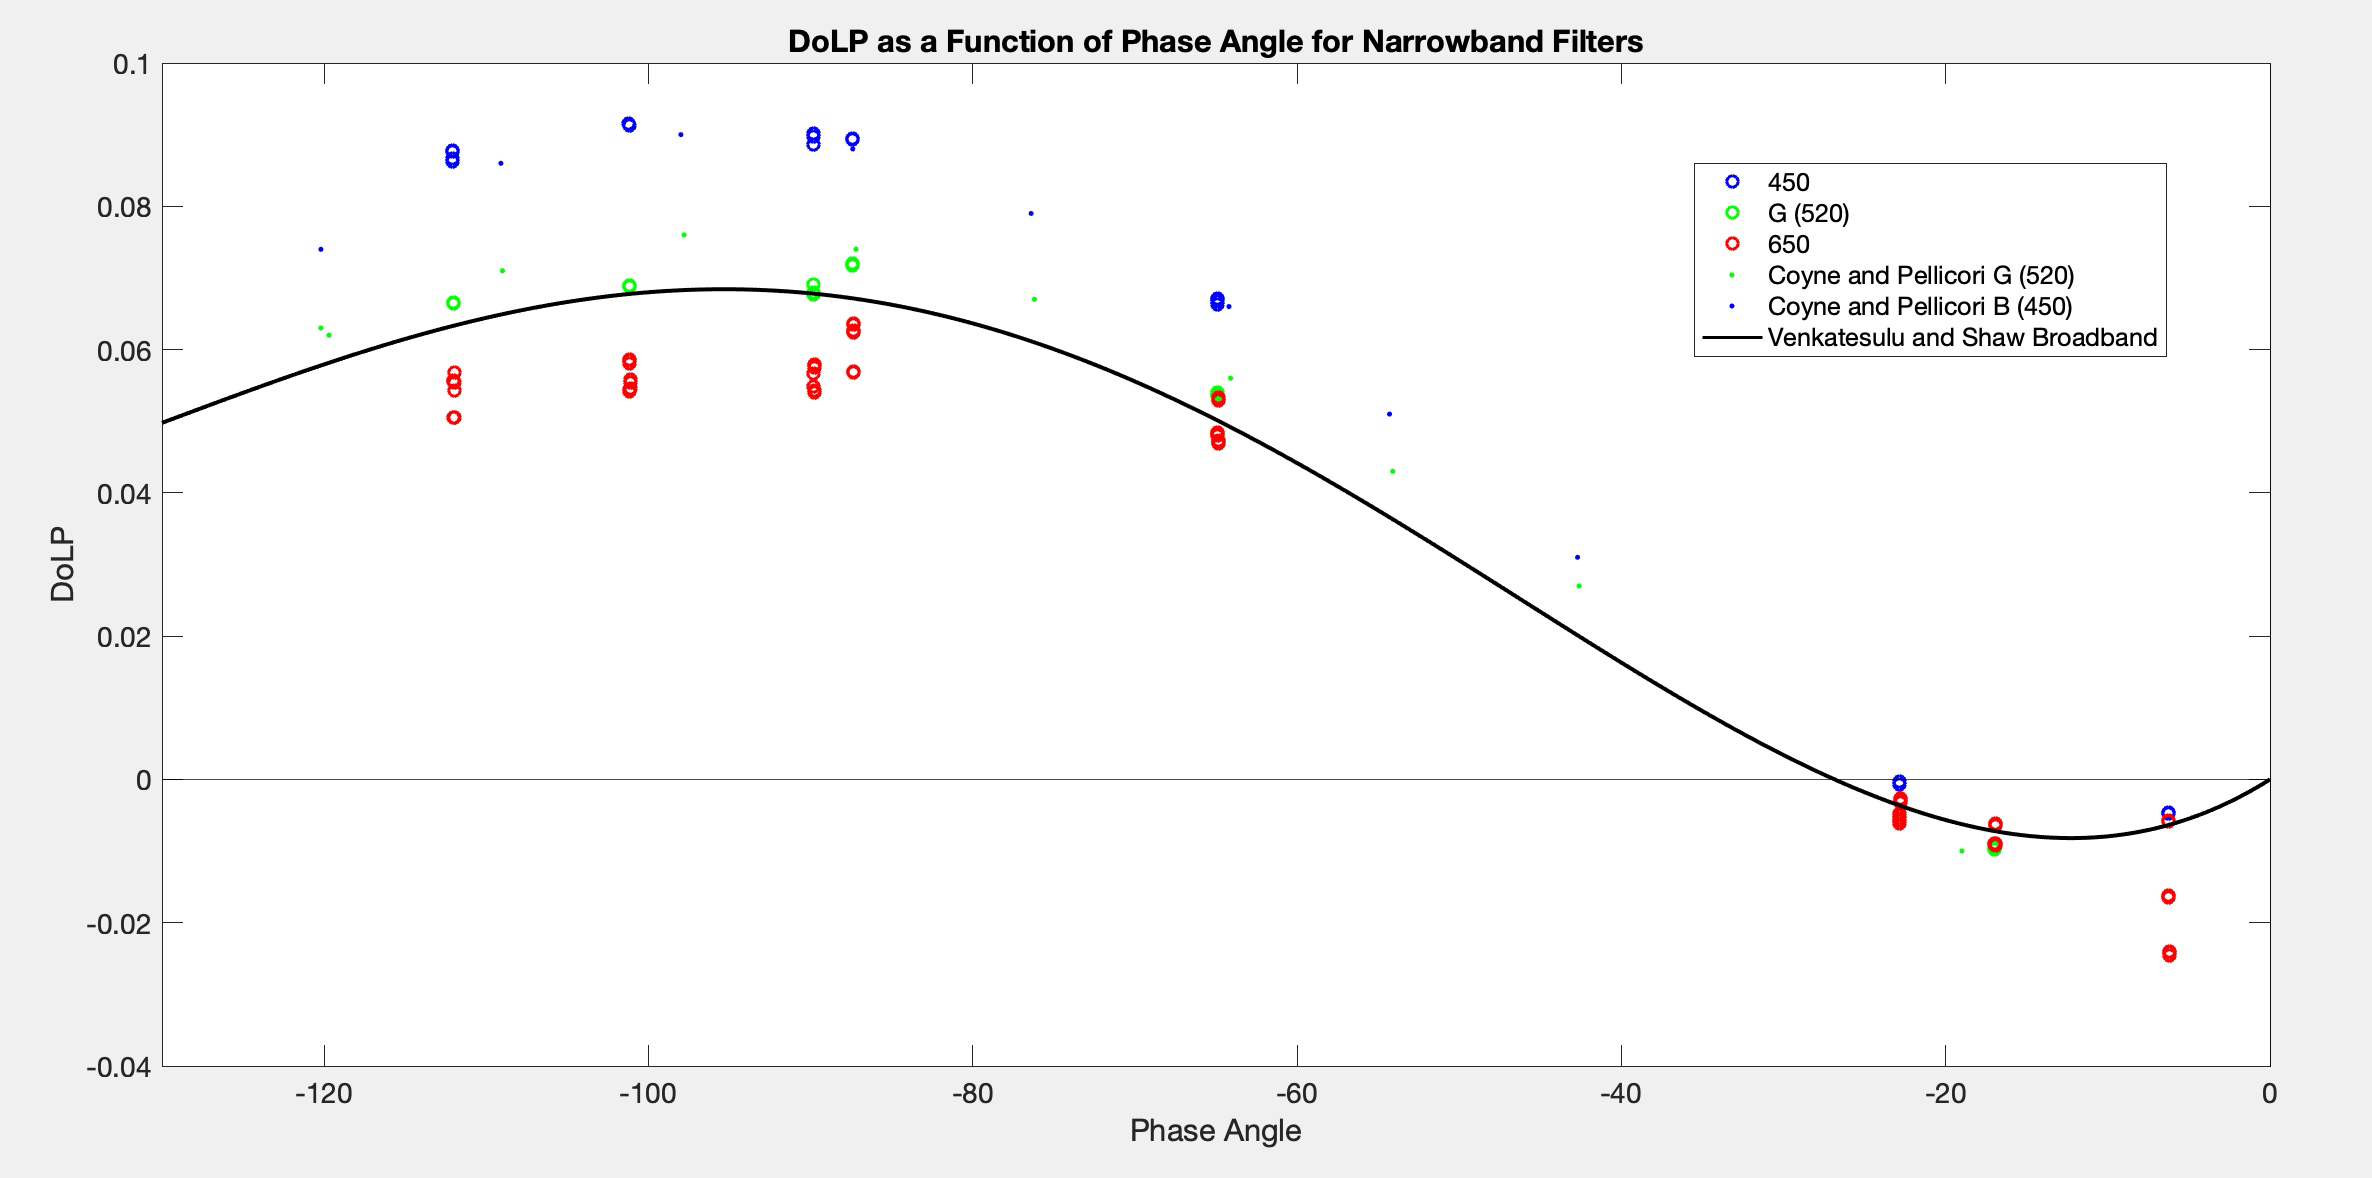
The curve below is my final DoLP Plot! This shows us that with the data I have collected now that DoLP changes as a function of both phase angle as well as wavelength. It follows the same S shaped curve that the broadband paper data follows (which is really promising), and as wavelength increases, the DoLP decreases, which is what we were expecting experimentally!

The curve below is my final DoLP Plot in strictly blue, green, and red filters. This removed some of the noise I was getting from the 800 and 900 nm filters to see a correlation between DoLP and wavelength more clearly. It also excludes the waning smokey data, so it is only for negative phase angles.

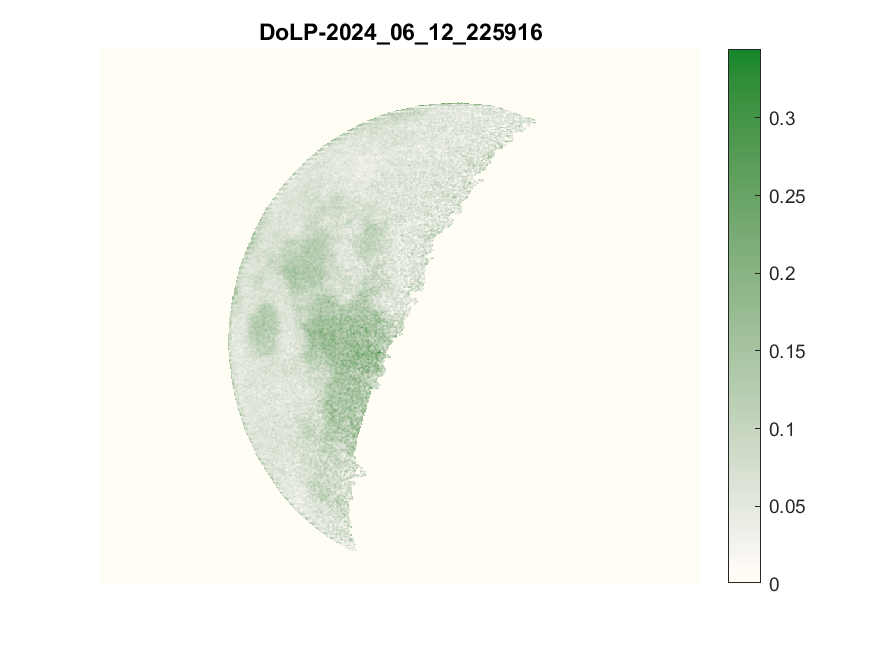
Below I am inserting some of my processed photos that I chose to make paper-worthy! These include S0, AoP, and DoLP parameters for a cresent moon, a half moon, and a full moon. As we can see, the DoLP changes as the phase of the moon changes and corresponds to the DoLP levels shown in the DoLP curve above.


There is no next week this week, but some things that can be done in the future include: adding to the DoLP plot with newly observed data to fill in all the phase angles, more observing, seeing how much the smoke affected the DoLP in general (and if it did doing science on that), and continuing to process images as well as write a paper on the findings
This is a list of all the nights I was able to record data and take polarization images.
My poster and presentation can be found below!
This is my final poster:
This is my final presentation: