 |
| Home (Contact Info) |
|---|
| Schedule |
| Current Events Blog |
| Research |
| Solar Physics |
| Gamma Ray Bursts |
| Resumé |
| Brief Bio |
| The Novel |
| Pictures |
| Movies |
| Links & Extras |
| "By the time you've sorted out a complicated idea into little steps that even a stupid machine can deal with, you've learned something about it yourself." *** |
 |
| "There is a theory which states that if ever anybody discovers exactly what the Universe is for and why it is here, it will instantly disappear and be replaced by something even more bizarre and inexplicable. There is another theory which states that this has already happened." *** |
 |
Sabrina L. Savage, Ph.D.Last Updated: 06/29/10 |
"A child of five would understand this. Someone fetch a child of five." -- Anonymous
XRT Flare 080409
If your browser does not support embedding the movies below will not play on this page.
Open them to view.
Return to the main Cartwheel Flare page
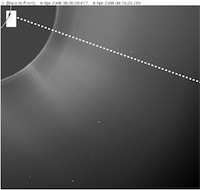
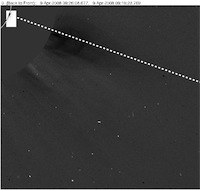
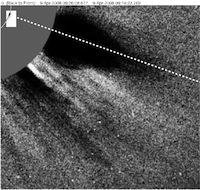
Cutting to the chase here ... more explanation below. However, the CME front is tracked as the first outflow within the XRT FOV which is
not explained below.
| Final Extrapolated XRT flow paths with CME | ||
| Byte-scaled only | C2: Run-mean-diffed, diff-scaled, byte-scaled | C2: Run-mean-diffed, hist-equaled, smoothed |
|
|
|
|
Open this movie: (Quicktime .mov) |
Open this movie: (Quicktime .mov) |
Open this movie: (Quicktime .mov) |
CME front association! Woo ... it really works!
(Note that the CME is "deflected" northward.)

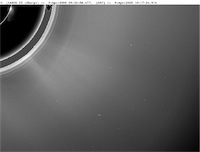
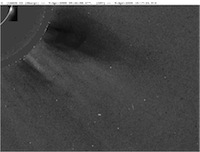
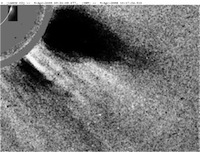
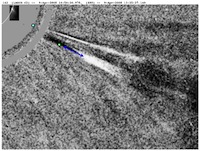
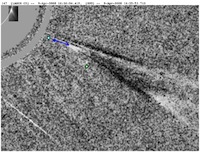
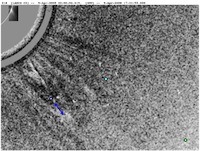
Step 1. In the following movie sets, the upflow positions were extrapolated into the LASCO FOV by using the average speed of the upflows as manually measured within the XRT FOV. A constant flow speed is unrealistic, but this was done as a simple first step to get a feel for any possible LASCO flow correlations. Surprisingly, there appeared to be 3 prominent LASCO flows in the vicinity of the 3 extrapolated XRT upflows. Nothing definitive but certainly suggestive which prompted further exploration...
| Step 1. Extrapolated XRT flow paths (average speed) | ||
| Byte-scaled only | C2: Run-mean-diffed, diff-scaled, byte-scaled | C2: Run-mean-diffed, hist-equaled, smoothed |
|
|
|
|
Open this movie: (Quicktime .mov) |
Open this movie: (Quicktime .mov) |
Open this movie: (Quicktime .mov) |
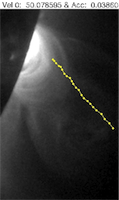
*** Note: I extrapolated distances with respect to sun center and kept the flows going in the same average
direction as their manually-tracked path, but it should be noted by the path angles in the following figures
that the plane-of-sky CME path is not straight. The table of figures below shows the discrepant CME path angles between XRT and
LASCO. (They are not to scale of course.) STEREO images show in more detail that the CME is affected by the open
field of a neighboring coronal hole which therein affects the path of the CME. I note this because the extrapolated XRT
flows veer off slightly from the path of the LASCO flows probably because I do not add any shift to the extrapolated path.
| CME Path | |
| XRT | LASCO C2 |
 |
 |
**** Note: The correspondences indicated below are based on the earliest frames of simultaneous detections because I would expect the paths to become increasingly more discrepant with the extrapolation scheme used for this step.
| Possible Flow Associations (Using Average Speeds) | ||
 |
 |
 |
Step 2. The manually-tracked XRT flow trajectories were fitted with 2nd degree polynomial. The second step in the process of comparing
the XRT flows to the LASCO images was to use that trajectory fit information by simply extrapolating the position of the XRT flows using
the final speed as the initial speed in the extrapolations but with zero acceleration. Again, this is unrealistic, but it was the
obvious next step. The results were very similar to using the average speed; therefore, I will not add them to this page unless
requested. (But feel free to request!)
Step 3. The next step was to get a better idea of the acceleration of the flows in the outer corona. (The XRT FOV is too small to get
a proper acceleration profile for the upflows.) So for kicks, I identified the obvious potential LASCO counterparts, manually tracked
them in multiple data sets, fitted their trajectories with a 2nd degree polynomial, and approximated their accelerations across the LASCO
C2 FOV using all of the fits. I then
extrapolated the positions of the XRT flows by using the final fit speed (see Step 2) as the initial speed and then applying the
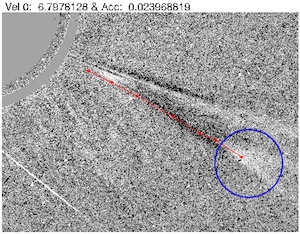
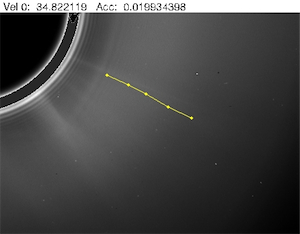
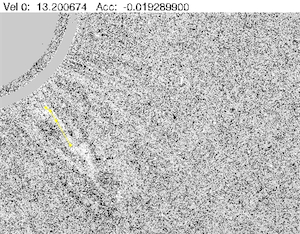
approximate acceleration from the corresponding LASCO flow (0.025, 0.02, 0. km/s^2 respectively -- I used 0 for the last one because
it is too difficult to consistently track in the LASCO images). This is more realistic while remaining relatively simple in order to
avoid introducing too many biases. Still I did not expect the results to be as remarkably close as they are!
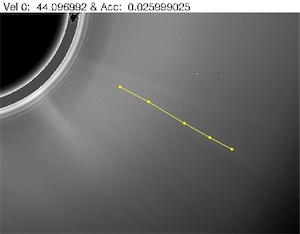
The following table of images indicates the path of the LASCO flows that I tracked to derive accelerations. The path was taken from several images; however, the path is overlayed onto the final image of the path. The flow in question has been circled. I have only circled it in the enhanced images simply because it shows up best. Flow 3 is too difficult to track in the LASCO images to derive a consistent fit, so I am using 0. km/s^2 as the extrapolation for XRT Flow 3.
| LASCO Upflow Paths (for deriving accelerations) | ||
| Flow # | ||
| 1 |
 |
 |
| 2 |
 |
 |
| 3 |
 |
 |
| Step 3. Extrapolated XRT flow paths (LASCO flow accelerations) | ||
| Byte-scaled only | C2: Run-mean-diffed, diff-scaled, byte-scaled | C2: Run-mean-diffed, hist-equaled, smoothed |

|

|

|
|
Open this movie: (Quicktime .mov) |
Open this movie: (Quicktime .mov) |
Open this movie: (Quicktime .mov) |
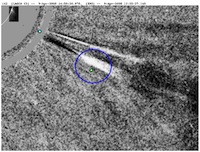
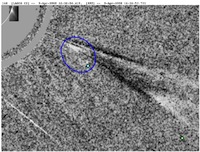
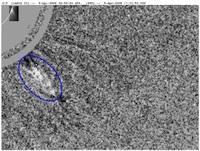
| Possible Flow Associations (Using Accelerations) | ||
 |
 |
 |
Brief Discussion
CME: The CME shows up at 09:16 in XRT. It shows up in LASCO at 11:10.
Flow 1: The first bright XRT upflow corresponds well with a bright streamer blob that is visible in the LASCO images following the CME. It is first tracked in XRT at 12:06. The streamer blob shows up in LASCO at 13:25.
Flow 2: The second bright XRT upflow is actually the upflow portion of a disconnection event that I have excitedly pointed out several times in the sharpened XRT images (watch this movie on back and forth loop between 13:02 and 13:26 for reference). The reconnection point is located near 170 Mm above the chosen footpoint within the active region. The corresponding feature in the LASCO images is none other than the concave upward feature following the CME and described in the Webb et al '03 paper as the CDE (candidate disconnection event) -- or as I like to the think of it -- the CME caboose!!! Isn't that cute? Disconnection event corresponding to disconnection event? Now presumably they are all disconnection events. This one is just the only obvious one in XRT although the first upflow may have a corresponding downflow as well -- just without a "visible" X-point.
Flow 3: The third upflow in the South shows up at 16:50 in XRT and the corresponding LASCO flow shows up at 20:06. This one is the most difficult to detect and track, yet it corresponds very well with some outflowing action in the South of the LASCO images. I think this flow is valuable in helping us understand the orientation of the current sheet (more on that later...).
XRT-Specific Information: Here
Manual Flow Tracking: Here