
I. Backround
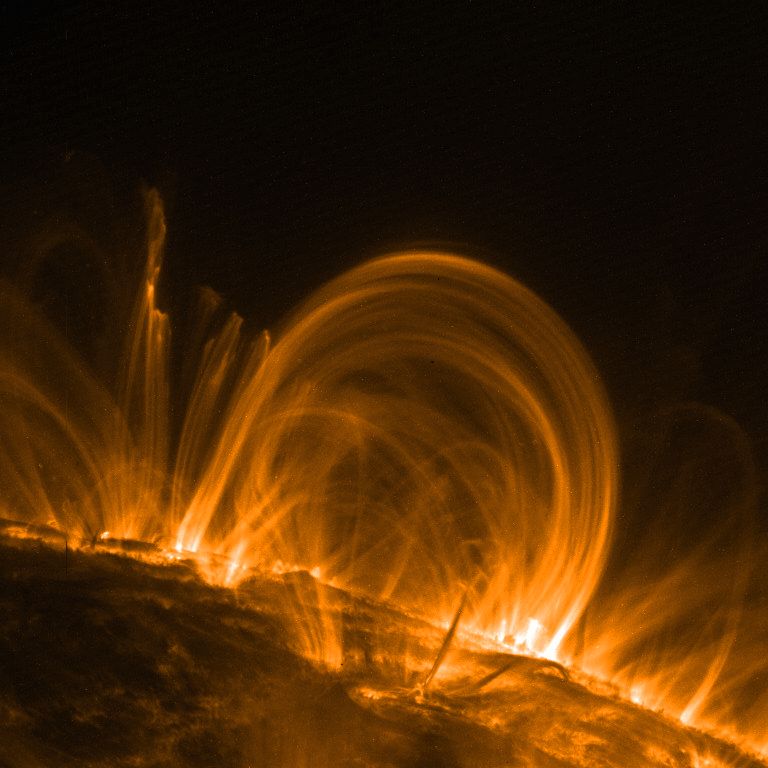
*Corona
~Temperature around 10 million K
~Chromosphere is about 4500-6000K
*Properties
of Corona
~Origin of High Temperature
~Diffuse region
~Stores energy?
*Solar Flares
~Abrupt release of energy
*LDE
*Impulsive flares
*Properties
of Solar Flares
~Zeeman effect - X-rays and EUV
~Energy source
*Magnetic
Fields, CME's, Magnetic Flux
*Magnetic
Reconnection theory
~evidence of reconnection
~ionized particles and magnetic field
~length scale as very small is most probable
~properties and characteristics
-cause: magnetic field lines stretched above a magnetic flux tube that
becomes disturbed. The disturbance causes a CME, which rises
over the field lines and causes the field lines to rise upward.
-magnetic field lines grow until they break and reconnect and then proceed
to collapse down to a "rest" position. This happens with many field lines
in the same flare so they collapse down on one another and as a result
cause different temperatures to be present within the flare.
*Structure
of Flares
~Cusp-shaped loop
~ribbon-like stucture at base
~CSHKP model
*What was
looked at in flares for this project
~Center column of flare through what would be close to the reconnection
point. Only the part below this point can be seen well in the flares.
~Studied the temperature in this region in hope to see evidence of different
temperature layers and effects of increase or decrease in a certain area
over time in temperature.
II. Info
III. My Project
*Images created
from raw data as .gif files
*Movies created
in .mpg files of raw data
*Images prepped
of raw data
~Decompression
~Dark current
~Leak data
~Normalization of exposure duration
~Alignment
*Frames selected
for prepped array
*Separation
of prepped data into filters
*Rotated data
*Differencing
of data
*Stackplots
made
*Temperature
and Emission Measure movies created
*More Stackplots
of previous movies
*Stackplots
of wide pixels
*Stackplots
with time ticks
*Output stackplot
with time ticks to view
IV. Programs
V. Results
VI. Acknowledgements