Results:
The results
of this project are those that I have recognized from my data analysis.
The final conclusions and final data analysis of this project are not complete
yet. This project will continue to be analyzed in the future.
In all four
flares there is a prominent representation of an increasing flare in height
over time. Furthermore, there are some stackplots of the flares also
show a downward trend over time in mainly the lower parts of the flare,
which are of our interest. There are also a few particular images
of stackplots from specific flares that are of interest in their pattern
and temperature scales.
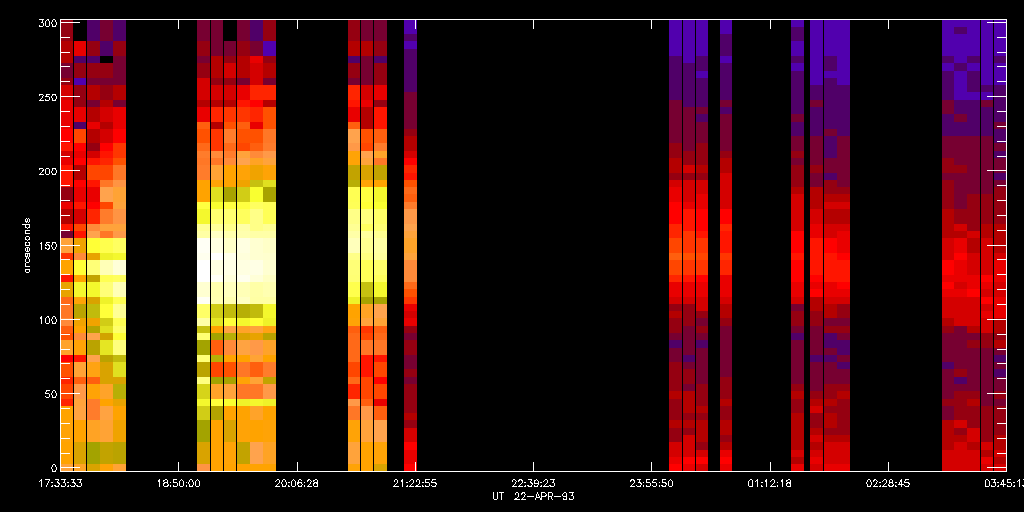
Below is the April 22 stack of one pixel wide with tick
marks for the regular data. N.B. the downward lower trend.
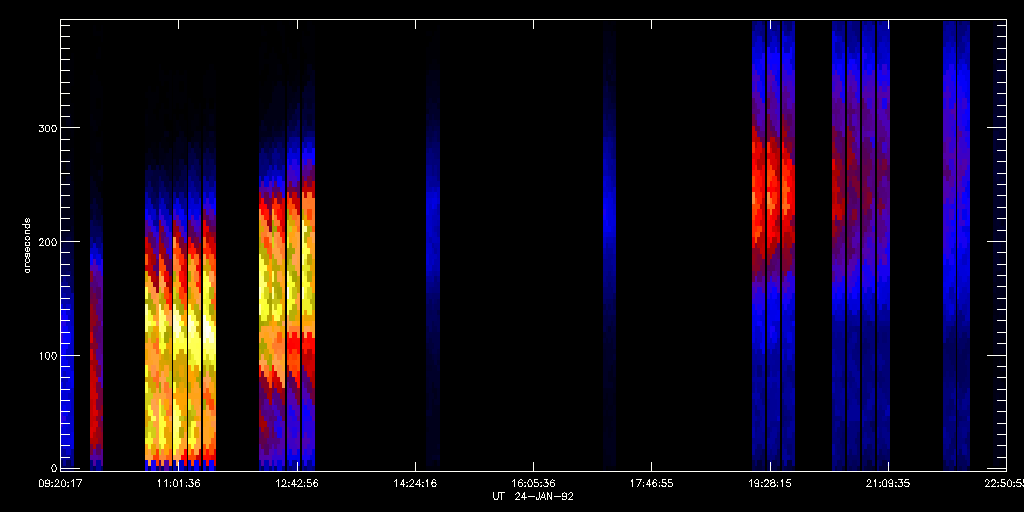
Below is the stack plot with tick marks, five pixels
wide, for the January 24 flare in the regular data. N.B. the early downward
trend in the lower part.
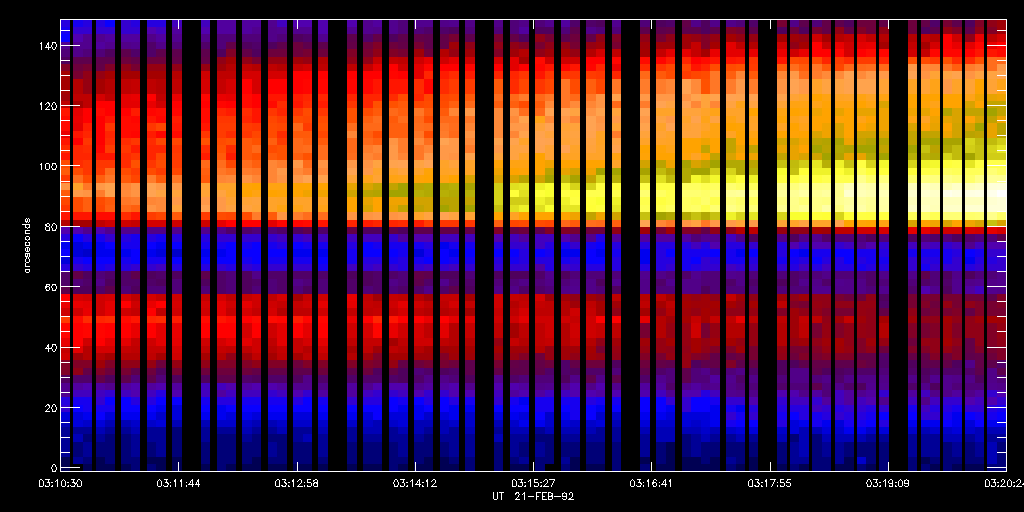
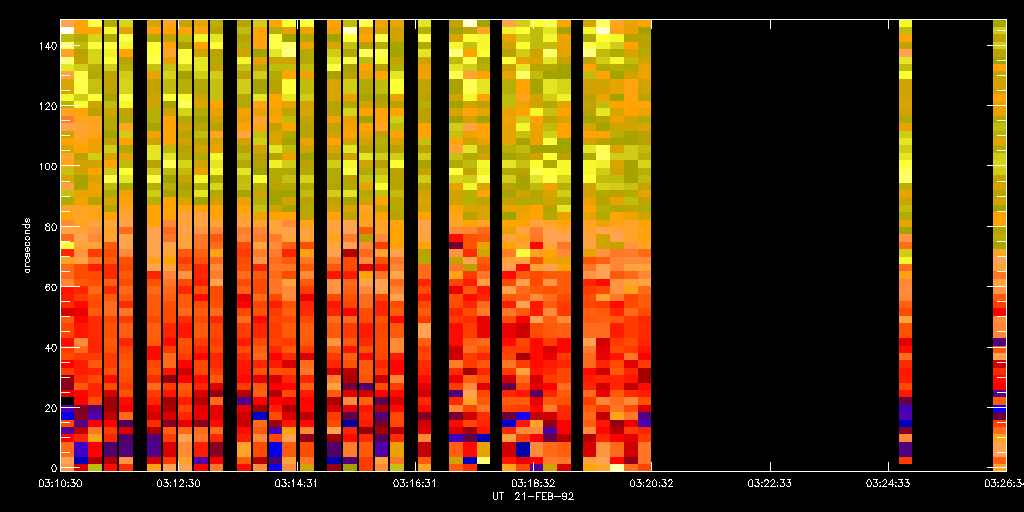
Below is the February 21 flare regular data in a stack
plot of one pixel wide. N.B. the lower decreasing trend over time.
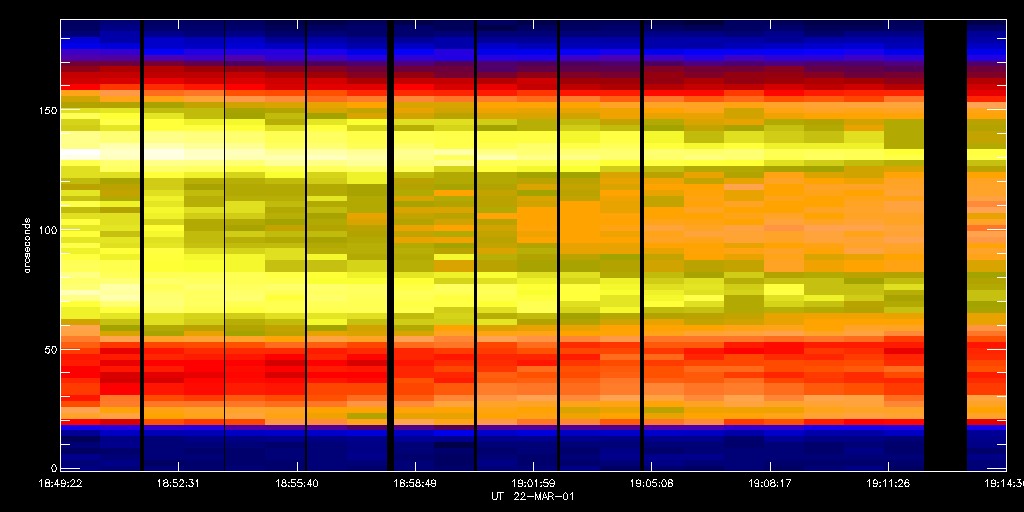
Below is the stack plot of the flare from the March 22
regular data in one pixel width. N.B. the lower decreasing trend.
Below is a stack plot of the subtracted data from the
March 22 flare in a pixel width of five.
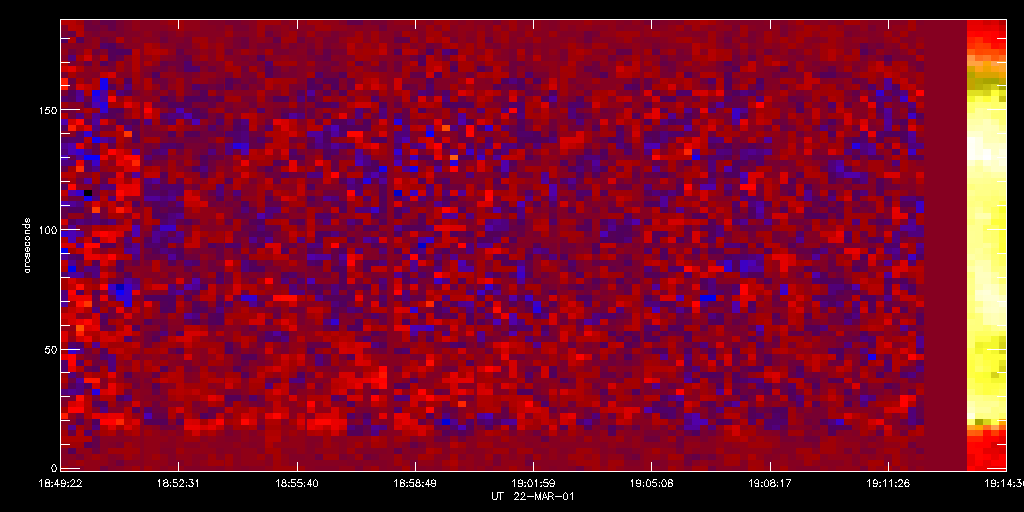
The February
21 flare shows a pattern of hot regions in the upper part of the flare.
This was noticed in the firsttemperature movie made of this flare in filters
2 and 5. This stack plot with tick marks of the regular data showed
two band like structures that looked about equal in temperature.
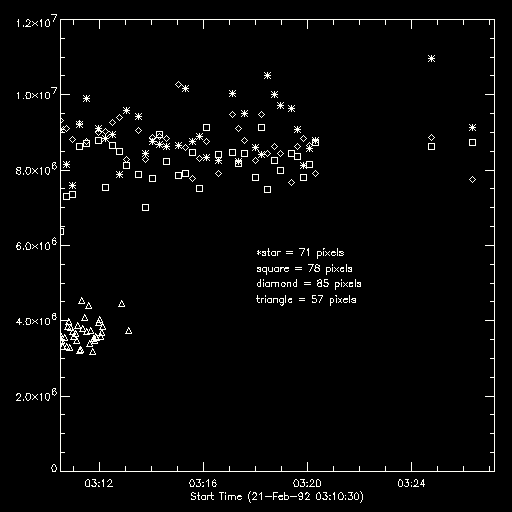
This stack was taken over a time span from 03:10:30 to 03:26:36.
It was found that at 71 pixels the temperature is higher than the other
points of interest up to about 10 million K. At 78 pixels, which
is the mid range, there is a temperature around 8 million K. Even
higher at 85 pixels, the temperature seems to be at about 9 million K.
At 57 pixels the temperature is at a low 4 million K. There could
be a slight downward trend beginning in one of these regions. It
looks as though the mid section at 78 pixels is slightly decreasing in
temperature.
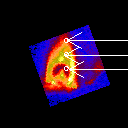
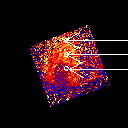
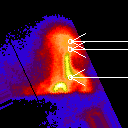
Below are two
images of the flare with points of where the 'hot spots' were found.
On the right is an image from the temperature movie and on the left is
an image from the regular data. The arrows point to the areas of
57, 71, and 85 pixels.
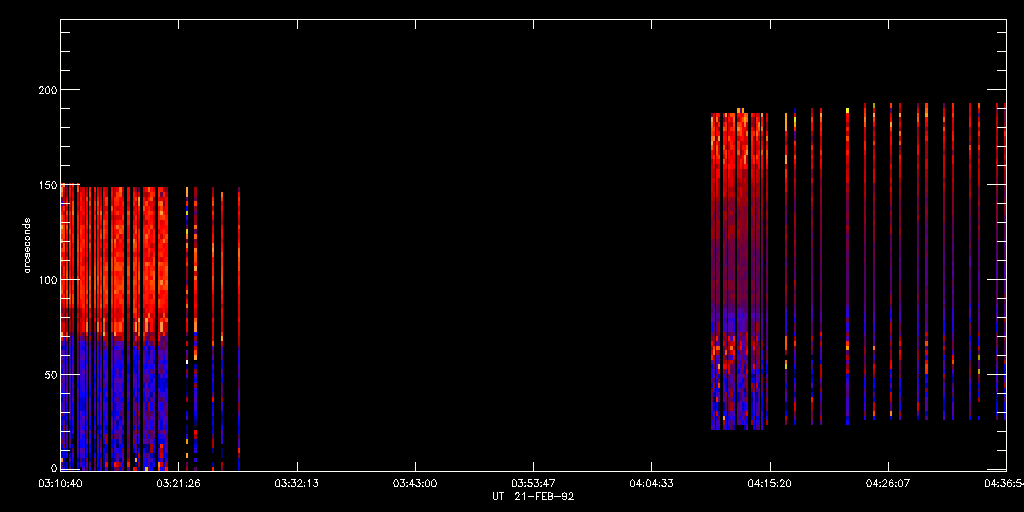
Below is the temperature stack in one pixel wide of the
February 21 flare with tick marks.
This is the plot of temperatures for this stack plot above.
71 pixels is 100 arc seconds, 78 pixels is 118 arc seconds, 85 pixels is
135 arc seconds, and 57 pixels is 65 arc seconds.
However, in
the February 21 temperature stack of filters 4 and 5 a different trend
is shown. This stack's time span runs from 03:10:32 to 04:36:44,
which overlaps some with the stack above. Notice in the graph the
trends of the temperatures. At 71 pixels, it begins as the highest
temperature around 14 million K. Then it lowers to about 7 million
K below the other trends. At 78 pixels the temperature begins at
around 12.5 million K, and then lowers to just above and close to the 71
pixel trend. At 85 pixels the temperature begins at roughly
11 million K, and then lowers to be slightly above the 71 pixel and 78
pixel temperatures near the end.
This is the graph of temperatures for the stack plot above.
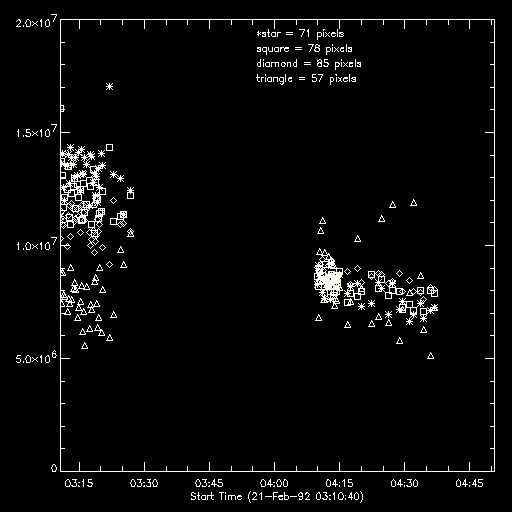
The main difference
between these two different graphs is that the time spans up to about 3:30:00
are comparable. However, the trend that sticks out is of the one
at 85 pixels (diamond). In the temperature stack of filters 2 and
5 the diamonds are seen as inbetween the temperatures of those in 71 (star)
and 78 (square) pixels. In the temperature stack of filters
4 and 5 the diamonds at 85 pixels are at a lower temperature than the stars
and squares. The 57 pixel (triangle) temperatures stay in relatively
the same place in the comparable parts of each graph. This is an
interesting find and will have to be analyzed more in the near future.
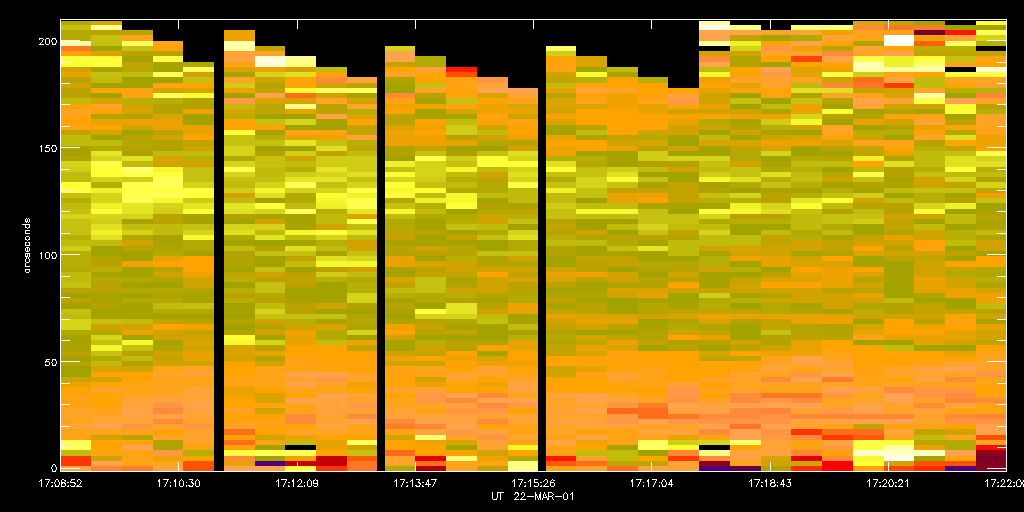
The March 22
flare shows some bands of different temperatures also. The stack
from the first temperature movie in filters 3 and 5 showed an upper trend
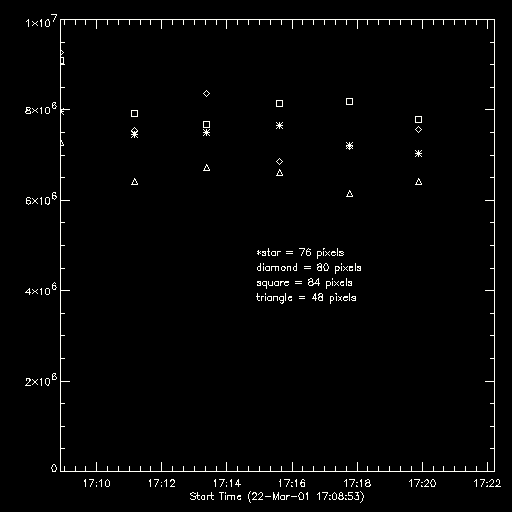
of hot temperatures in the upper region. In the graph of temperatures
a distinguishing of high and low temperature can be affiliated with these
trends. It is seen in the graph below that at 84 pixels it was a
higher temperature than most of the other pointed areas. This temperature
is about 8 million K. The lowest trend of temperatures is at 48 pixels,
which is about 7 million K. The one at 80 pixels is slightly higher
than the one at 76 pixels. They seem to overlap in the graph over
time showing an opposite trend to each other and to the one at 84 pixels.
This overlaping and such could be due to error and the uncertainty has
to be considered for these points. There is a decreasing trend seen
in the temperatures at 76 pixels. The one at 84 pixels seems
to start decreasing in temperature at the end also. This data will
be studied in greater detail.
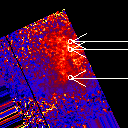
These images
below show the flare with marked areas of 48, 76, and 84 pixels. On the
left is an image from the regular data and on the right is an image from
the temperature movie
Top of Page
Back to Main Page
Background
Info
My Project
Previous - Programs
*Results
Acknowledgments


