Friday,
June 11
|
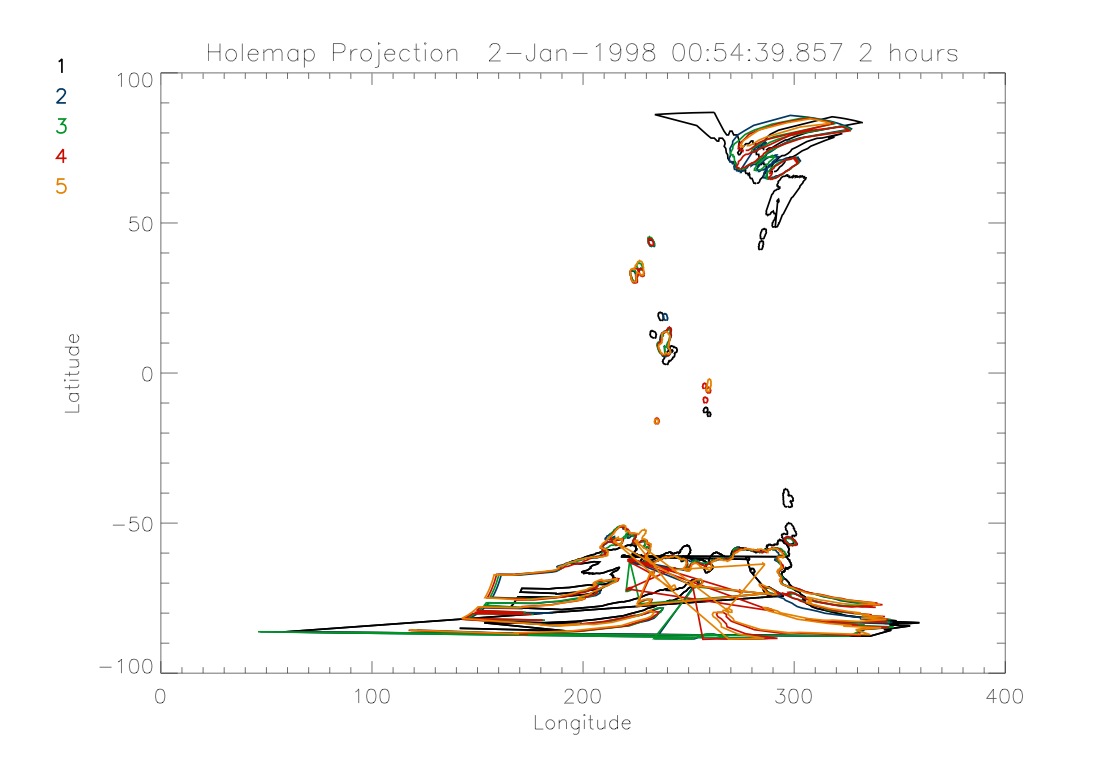
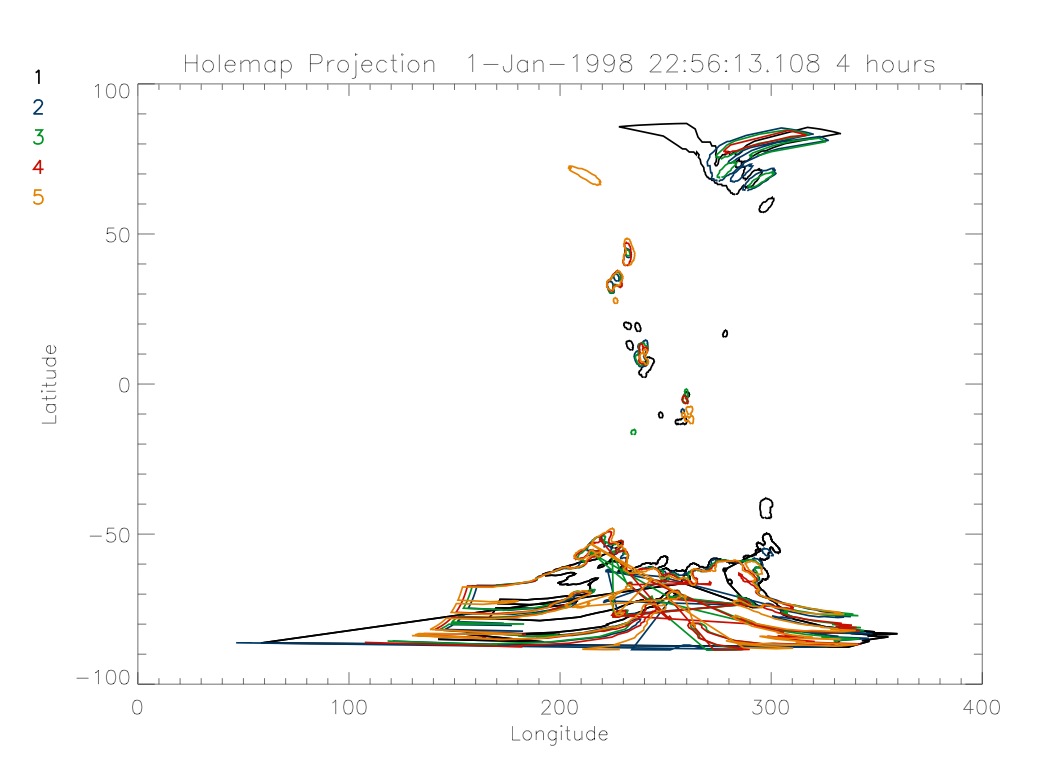
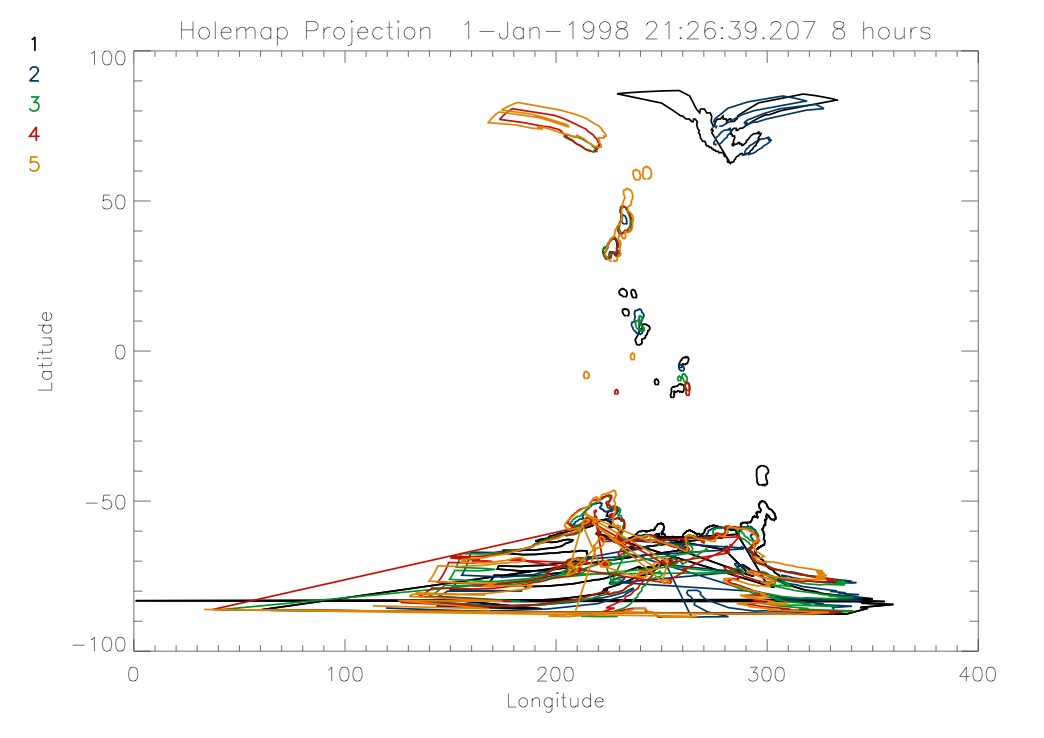
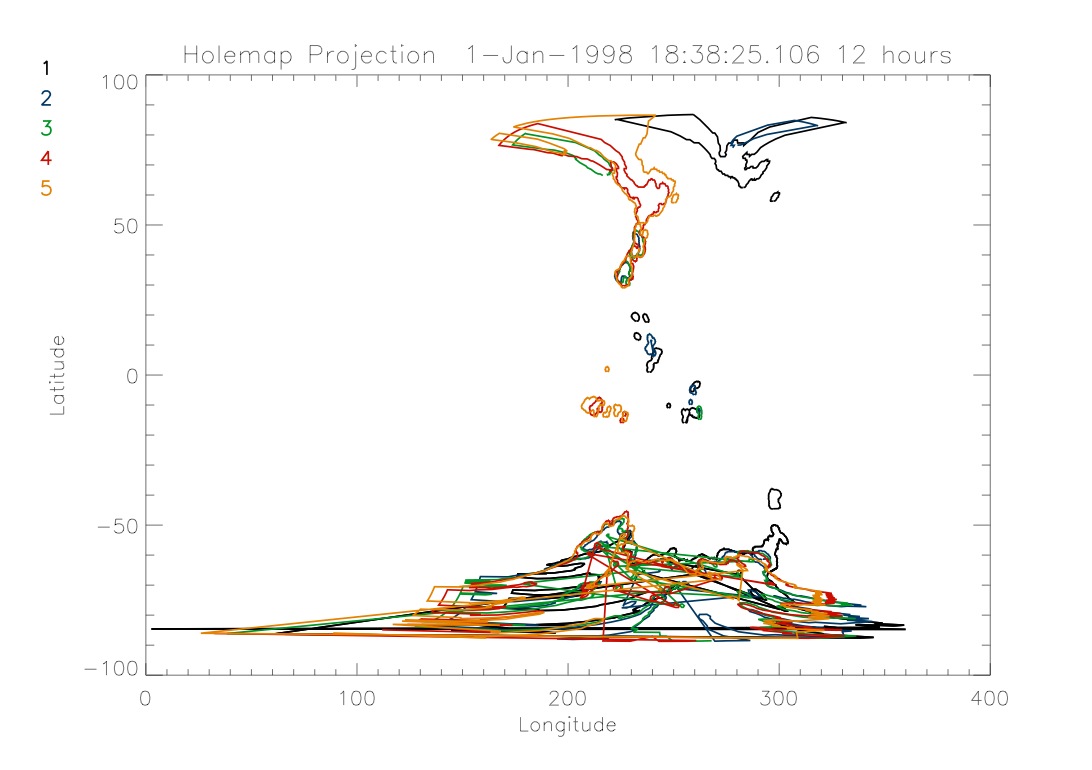
Today was spent working on the
code some more. I was unable to find the cause of an error that was
stopping me from getting data at the end of yesterday. I presented my
weeks work at the end of the week meeting. During this presentation I
realized that the plots I had created weren't correct. It turns out
that the coronal holes were moving much faster than they should have.
They should have been staying in the same place and changing shape and
maybe moving a small amount but these were moving significantly. It was
easy to find the problem but difficult to fix. I was mapping all the
images to the same time but they were rotated to different times. I had
to add an extra output to eit_grabh.pro, which is already a modified
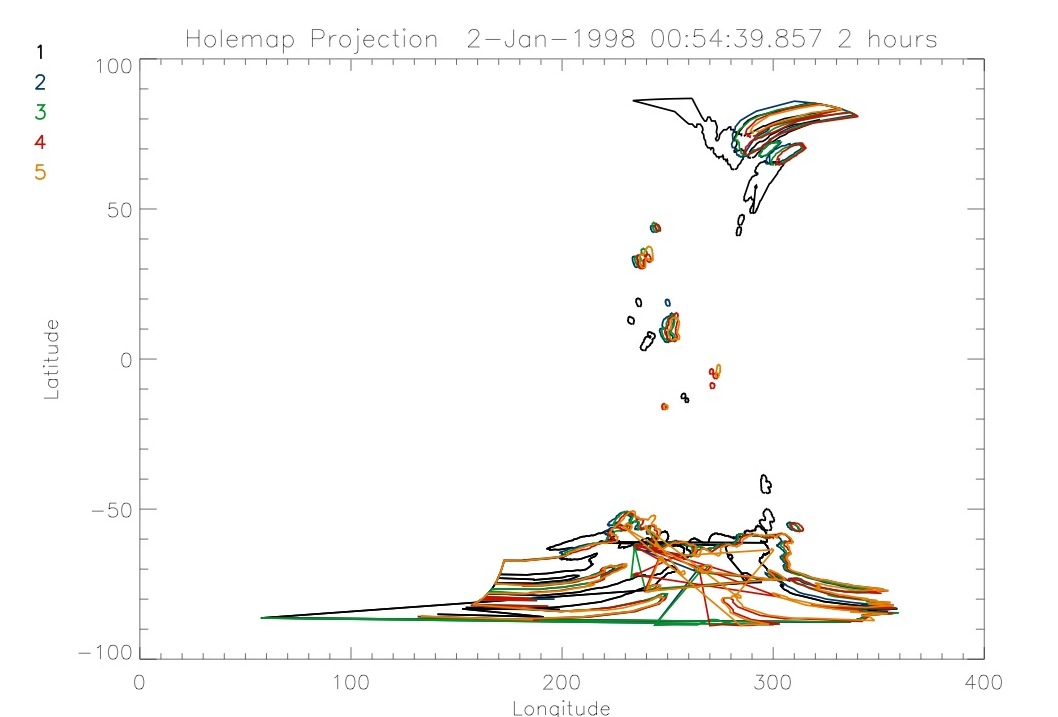
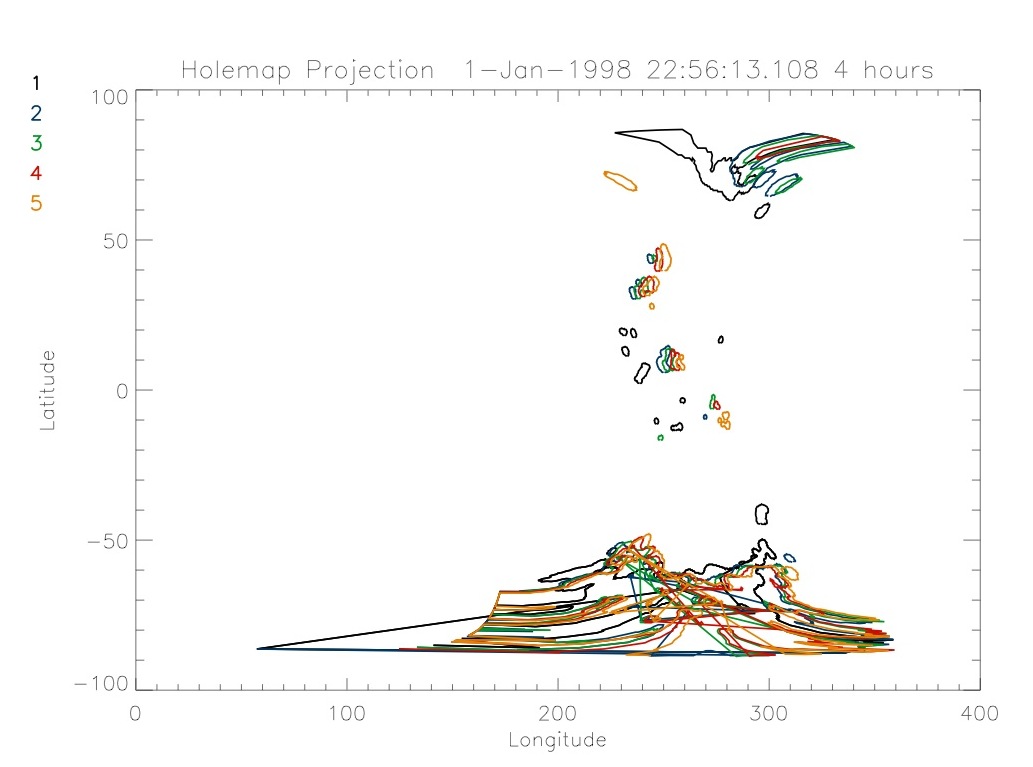
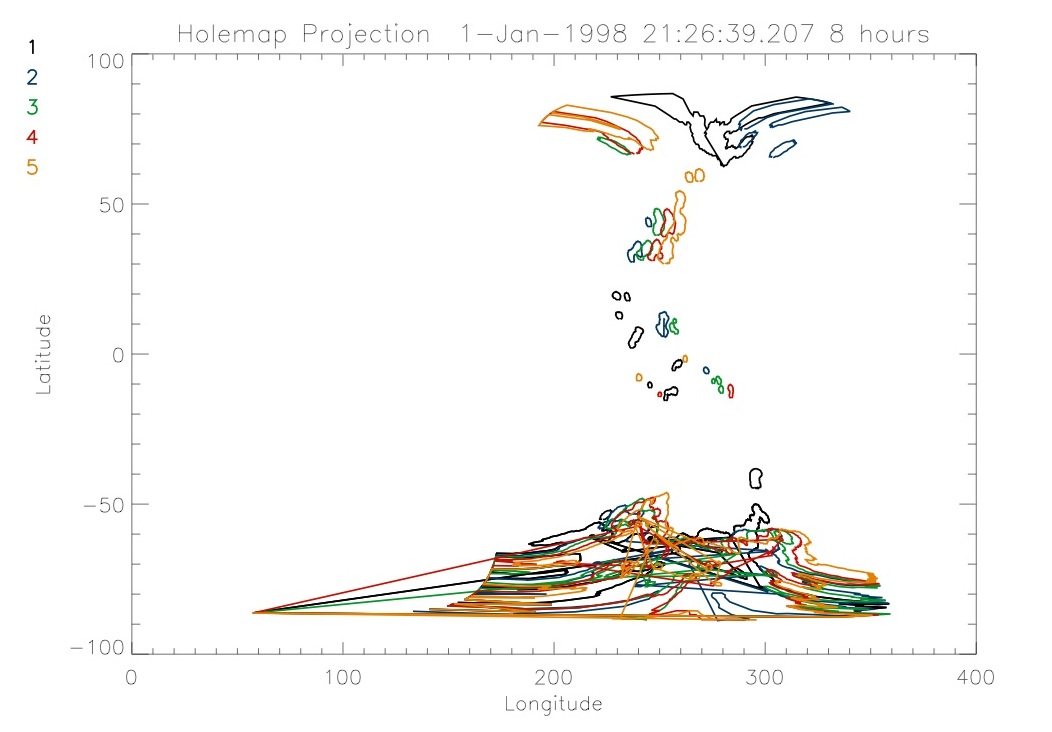
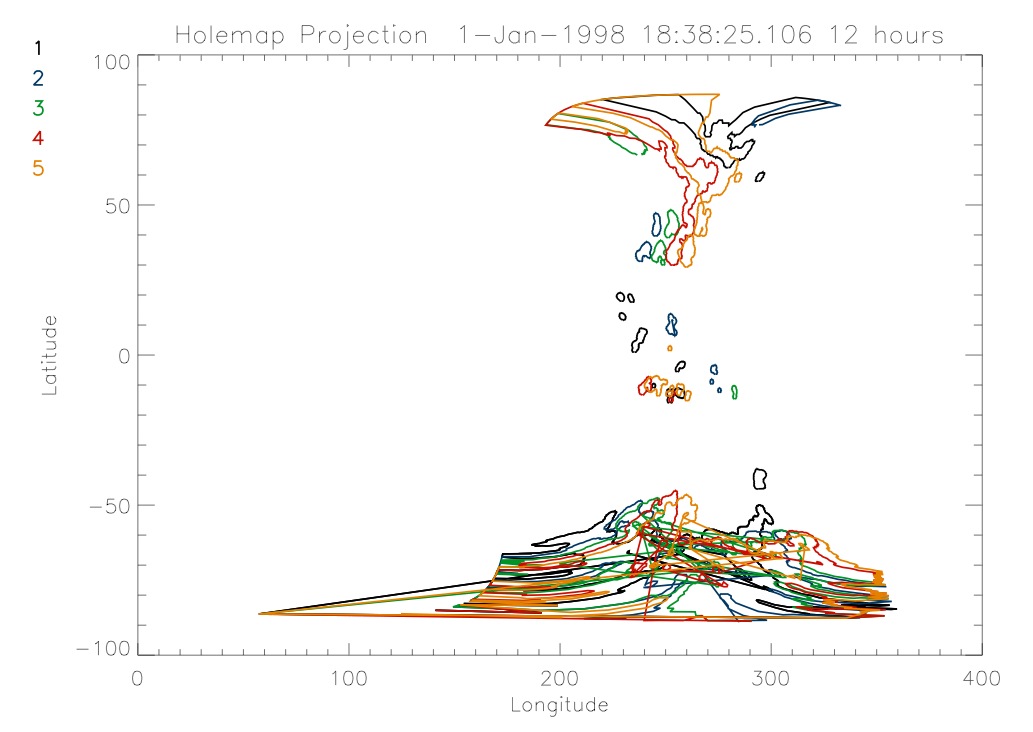
version of Chris Lowder's eit_grab.pro. The same graphs from Thursday
are posted below in their correct form.
|
|
|
|
|
|
|
|
|
|
Thursday,
June 10
|
|
The begining of today was spent
working out the kinks in my program so that it successfully creates
maps with multiple coronal hole projections from various times. Writing
my projection program into the holemap one was pretty straight forward
and wasn't too difficult. One of the trickier parts is dealing with the
fact that a time interval of say two hours won't have the same number
of eit files for different times. I had to make sure that there would
be any problems if there weren't many eit files in a given time frame
of if there were a lot. Once I had the program running successfully I
picked a time to try it out on to see how the coronal holes during this
time changed. I had to change it a lot to get it to produce plots that
were helpful to look at. The starting time that I looke at was the
beginning of the day of January 2, 1998. I created various plots for
time intervals ranging from 2 hours to 12 hours. Some examples of these
are below.
|
|
|
|
|
|
|
|
|
|
The program worked succesfully
until I tried to run it on long periods of time, as in times greater
than 12 hours. The problem is hidden deep inside of a program inside of
program inside of my program. I don't know what is causing it so
tomorrow will be spent trying to figure it out.
|
|
Wednesday,
June 9
|
|
Today I worked on creating
arrays of structures that will be used to create projections onto
longitude and latitude maps. I had to get the program to read in
multiple sets of eit images and create a holemap for each set. I
basically took the program that I was using and changed it so that it
was inside of a large for loop. I changed it so that I could specify
the length of time over which the hole maps would be created. I made it
so that the program takes as an input a specified amount of time in
hours, greater than one hour. The program then does a for loop five
times. For a specified time length of 2 hours it creates a 5 maps of
the coronal holes each of which is created over a two hour time span
and they are consecutive so that the total time looked at is 10
hours. The program saves these as an array of maps and then saved them
to the disk as a .sav file. With this successfully working my next step
was to take this array of maps and create longitude/latitude
projections from them. My goal is to overlay the five maps in order to
see how they change over time. I took the program I had used earlier
and wrote it into my ongoing program. By the end of today I had it
creating separate maps but there was a glitch where it got stuck after
the first couple.
|
|
Tuesday,
June 8
|
|
Getting Chris'
prgram to produce holemaps that I wanted proved to be more complicated
than I had originally anticipated. The program that he wrote was made
to do things that I didn't need it to do. There were many subtleties
within the program that were made to do specific tasks that Chris
needed done. I spent a lot of time going through the code and
understanding it. It made use of MDI files which I didn't need. I had
to cleanse the program of these things so that I could run it without
it getting hung up on stuff that I didn't need. I worked through the
program and I was able to succesfully get it to output a holemap from
data that I selected. Chris figured out how to fix my directory so that
eit_files would work. With that working I could use Chris' program
eit_grab to select the eit images. This program allows one to specify a
time and the amount of time around it to select images. With this
working it saved me some time when going through the program to figure
out what was woriking. I was testing it out on random sets of data in
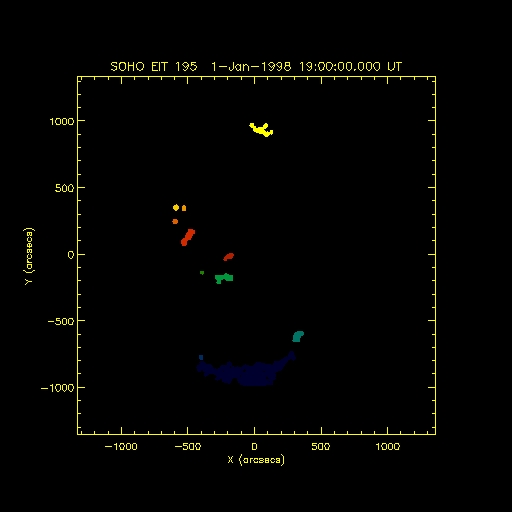
order to produce a holemap. The image below is an example of a holemap
that I created.
|
|
|
|
This image is drawn in color so
that the holes can be more easily seen. This program would just take
all of the images in the specified time and create one hole map from
all of them. What I want to do is to look at how these hole maps change
over time. My next task was to change the program so that it would
create multiple hole maps that look at a specific time interval of an
extended period of time. This was what I started to work on next.
|
|
| Monday,
June 7 |
|
| By last Friday I had finished my program
for the IDL presentation. This program was a simpler version of what I
am using now. It took an image of the coronal holes on the sun over a
certain time period, determined by a program written by Chris Lowder,
and projected them onto a Latitude and Longitude graph. This
program that I developed disregarded the fact the sun is tilted when
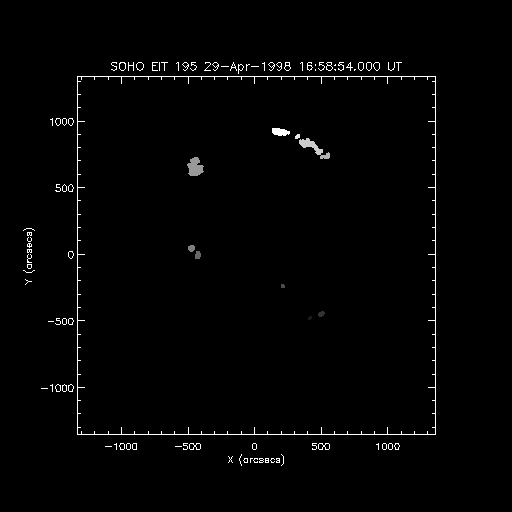
observed. It read in a map of the holes as shown below. |
|
|
 |
|
| The sun itself is not shown in this image. The map contains
data on
where the center of the sun is and the radius of the sun. The holes are
distinguished from one another by there color. They are each assigned a
value starting at one that goes up to the number of holes that there
are. I read in this image and used a command in IDL called contour that
draws contours of the holes and outputs the x and y position. From
there I was able to convert these positions into latitude and
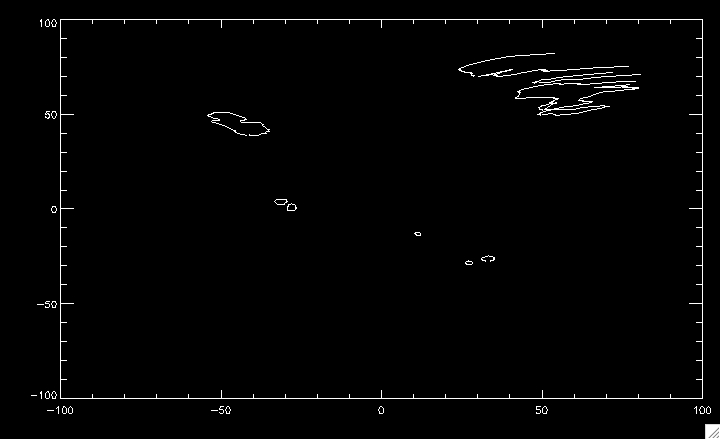
longitude. The graph below is the output of my program. |
|
 |
|
| In this image latitude is on the y axis and longitude is on
the x axis.
You can see that in the image the holes near the edges of the sun get
warped. When looking at an image of the sun there is the largest change
in longitude near the edges, thus there is most amount of distortion.
With this completed Dana Longcope provided me with the program that he
used that does the same thing except that it takes into account the
tilt of the sun. I spent friday and today wroking to put that program
into a form that is usuable with the maps of the holes that Chris
Lowder's program outputs. The two programs were not made to be
compatible with eachother so it took a little bit a of programming to
get the results that I was looking for. The latitude and longitude
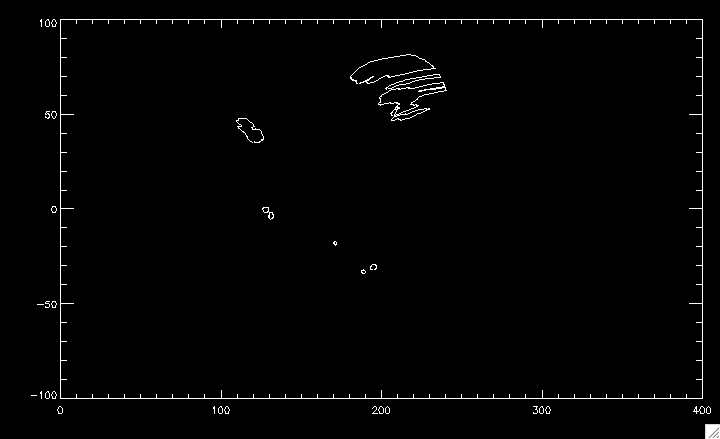
graph of the same image is shown below. |
|
 |
|
| Latitude is again on the y axis and ongitude is on the x
axis. In the
first projection the center of the sun in the image was taken to be at
zero longitude and latitude. In this projection the standard
coordinates for the sun are used and are graphed on the full longitude
of 0 to 360 instead of from -90 to 90 in the first graph. It can be
seen that there is less distortion in this projection. With this
program being done, my next step was to take Chris Lowder's program
that created the holemaps and adjust to do what I wanted it to do. He
provided me with copies of his code. My first step was to get it to
succesfully run in my directory which proved to be more difficult than
originally anticipated. It used a program that is part of the Solar
Software package for IDL called eit_files which didn't seem to run in
my directory. I created a temporary fix where I just selected images by
hand instead of searching for ones in the time frame that I specify in
the program. |
|