Friday,
June 18
|
|
Today I once again spent a lot
of time at the XRT conference talks. After those I created a new
version of my program that looks at even bigger gaps in time. Starting
next week I will be looking at spots of open magnetic field in
conjunction with the coronal holes. The spots of open magnetic field
are found by modeling the magnetic field lines. In order to do this it
requires data from an entire rotation of the sun. Thus the magnetic
field data is over an entire month. This led me to see if some of the
coronal holes persist over a time period comparable to the rotation of
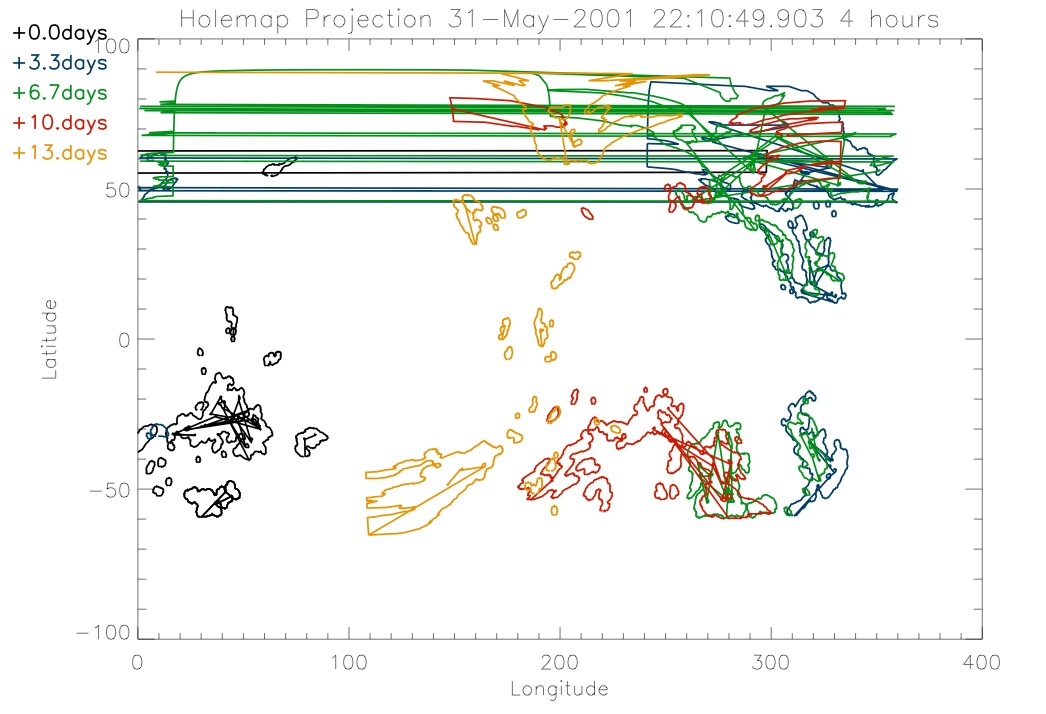
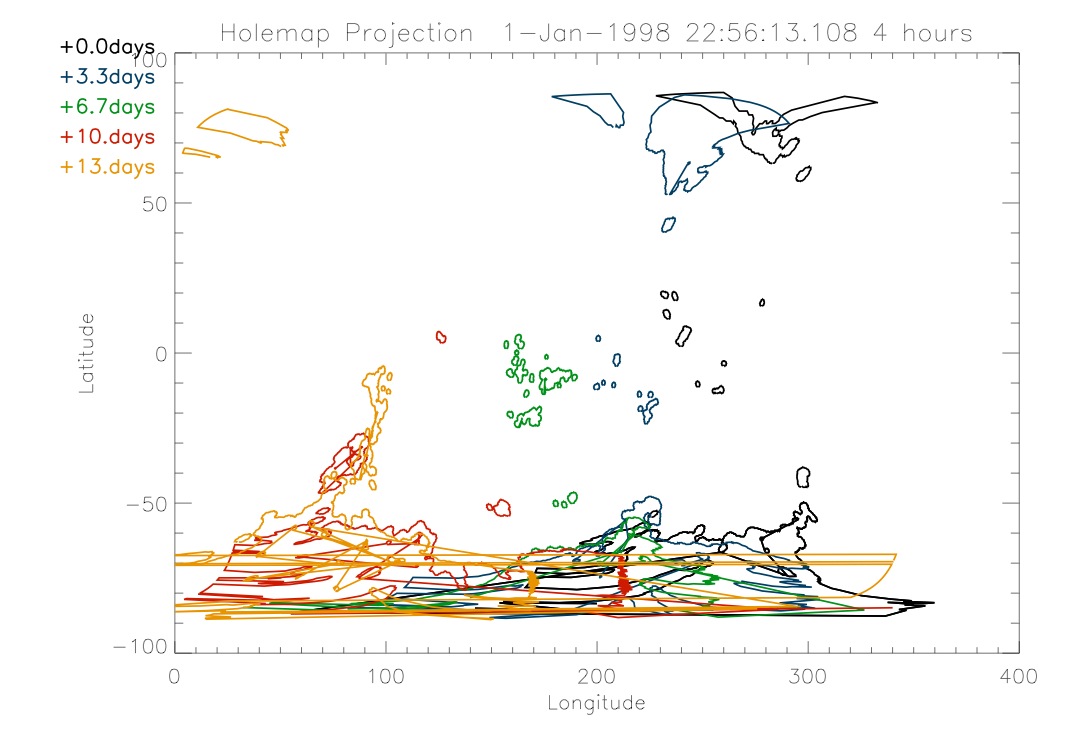
the sun. The plots below look at a time period that is half the time of
one rotation of the sun. I looked at this time period because in a time
period longer than that the coronal hole will then be on the other side
of sun so it won't be as meaningful.
|
|
|
|
I did this for the June and
August dates that I had been looking.
|
|
|
|
In looking at these I didn't
really gain any more useful information. Also, some of the coronal
holes will move out of view in this time period anyway. The only way
that the place where there is a hole will stay visible is if it is on
one edge of the sun at the beginning of the time period.
|
|
Thursday,
June 17
|
|
I spent a lot of my day today
going to various talks. We had one of our REU talks this morning. Today
was also one of the days of the XRT conference here so I went to a
bunch of the talks for that throughout the day. What I worked on
today was looking in more detail at some of the plots I produced
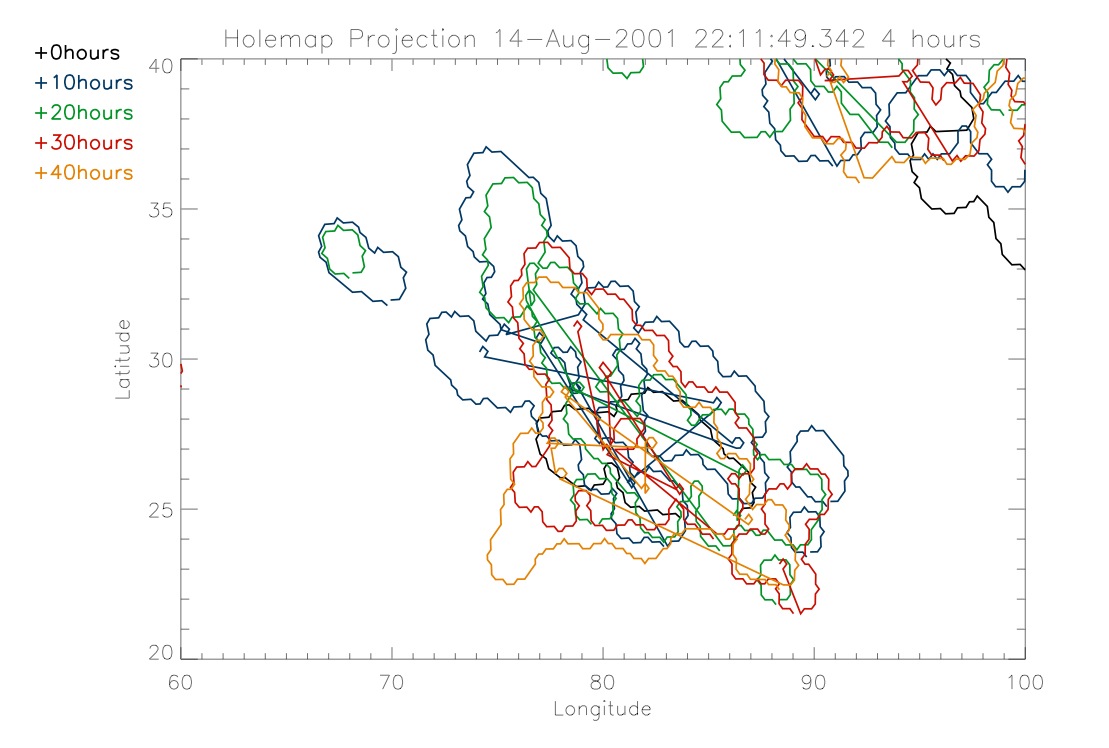
yesterday. I focused mostly on data from August 15. Below is a plot of
a zoomed in portion of the August 15 Carrington map.
|
|
|
|
The coronal hole that I zoomed
in on changes shape over 40 hours but it is definitely still there. I
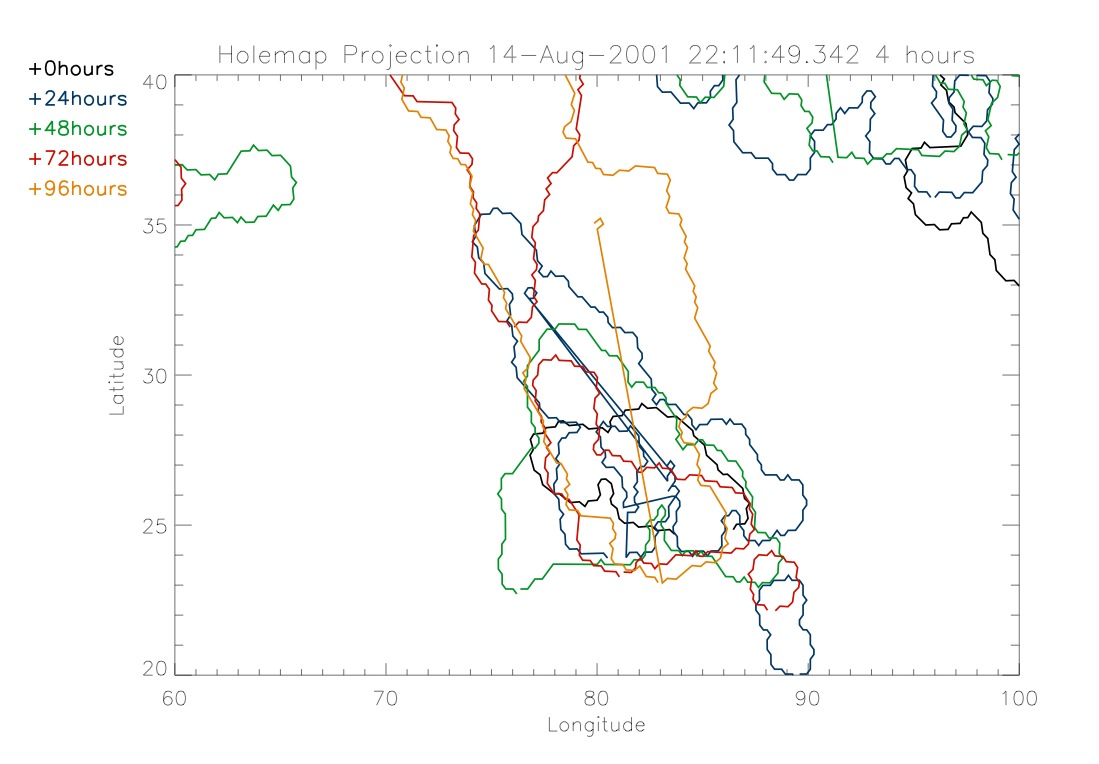
ran my program that looks at how the coronal holes change over 24
hour time spans. Below is the plot of that for this same date.
|
|
|
|
In this it can be seen that the
hole persists over a 96 hours. It is interesting to compare this to the
plot above it. In that plot the hole is shrinking over the given time
period so one may assume that it will continue to shrink and disappear.
When we look at the plot of 96 hours we see the coronal hole begins to
shrink but it then starts to grow again.
|
|
Wednesday,
June 16
|
|
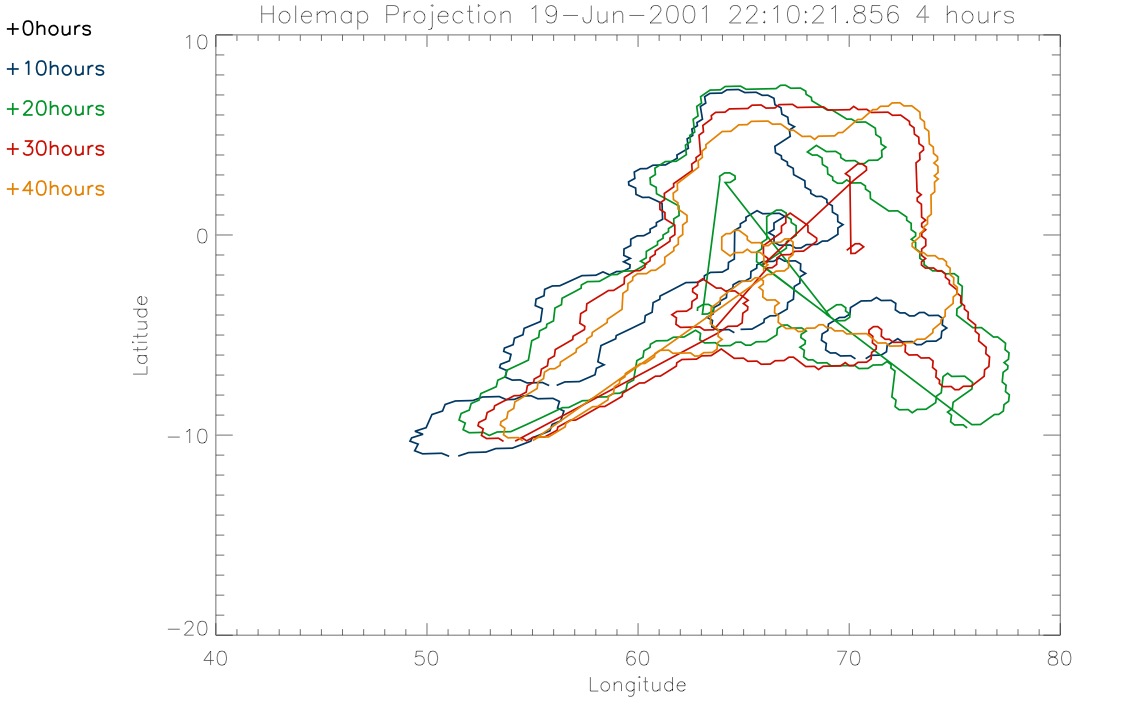
Today I continued working with
the data around June 20, 2001. I started by zooming in on an area of
interest around the equator. The plot below shows this area over 10
hour intervals.
|
|
|
|
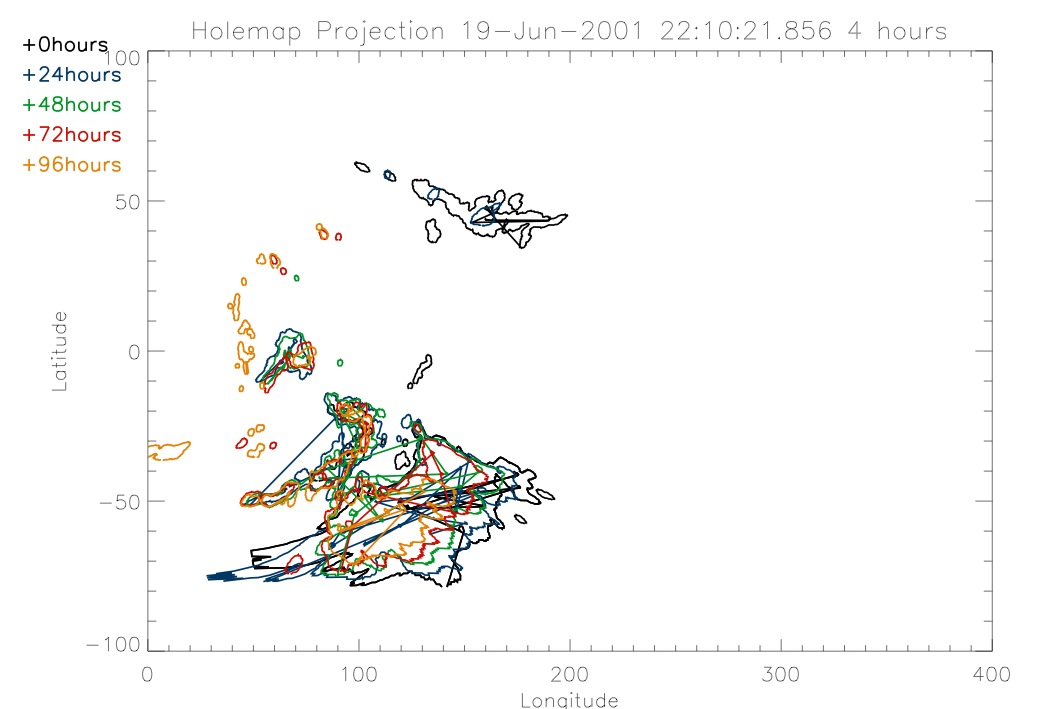
Although the coronal hole
appears to change shape and size over this 40 hour time span, it is
persisting. Thus, I decided to look at it in 24 hour intervals. The
plot below shows all the coronal holes starting at this time in 24 hour
intervals.
|
|
|
|
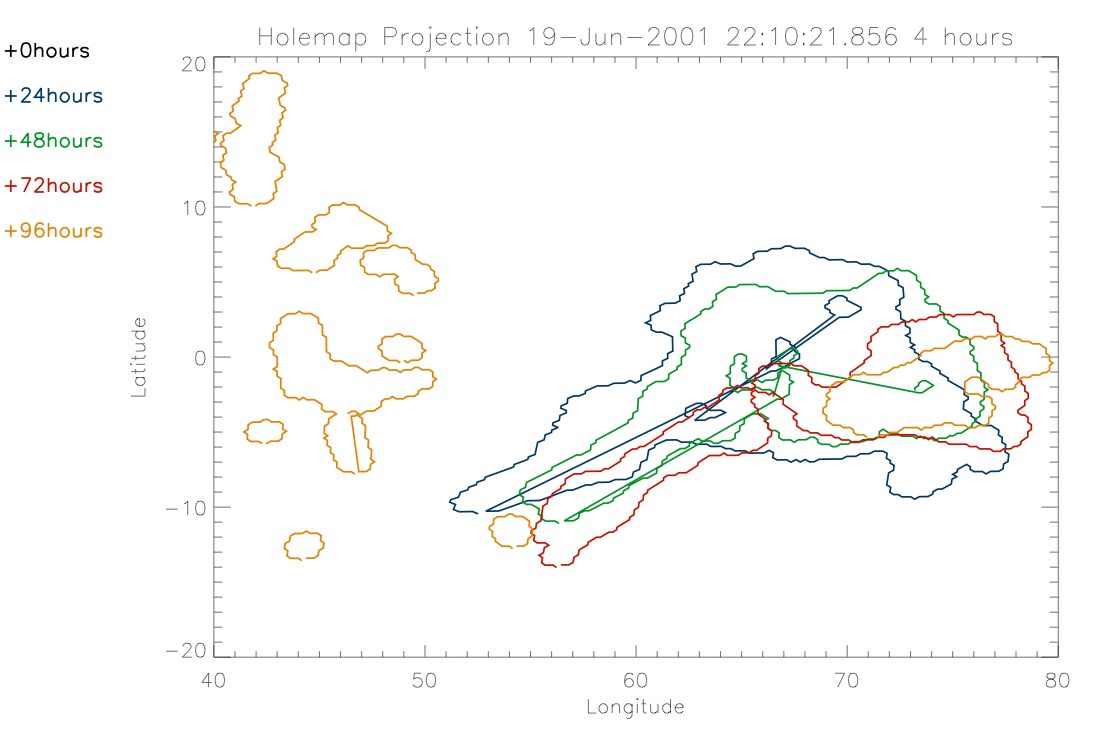
I once again zoomed in on the
area of interest in order to better see what's going on. We can see
that the hole persists for a few days and then as it starts to shrink,
more show up near it.
|
|
|
|
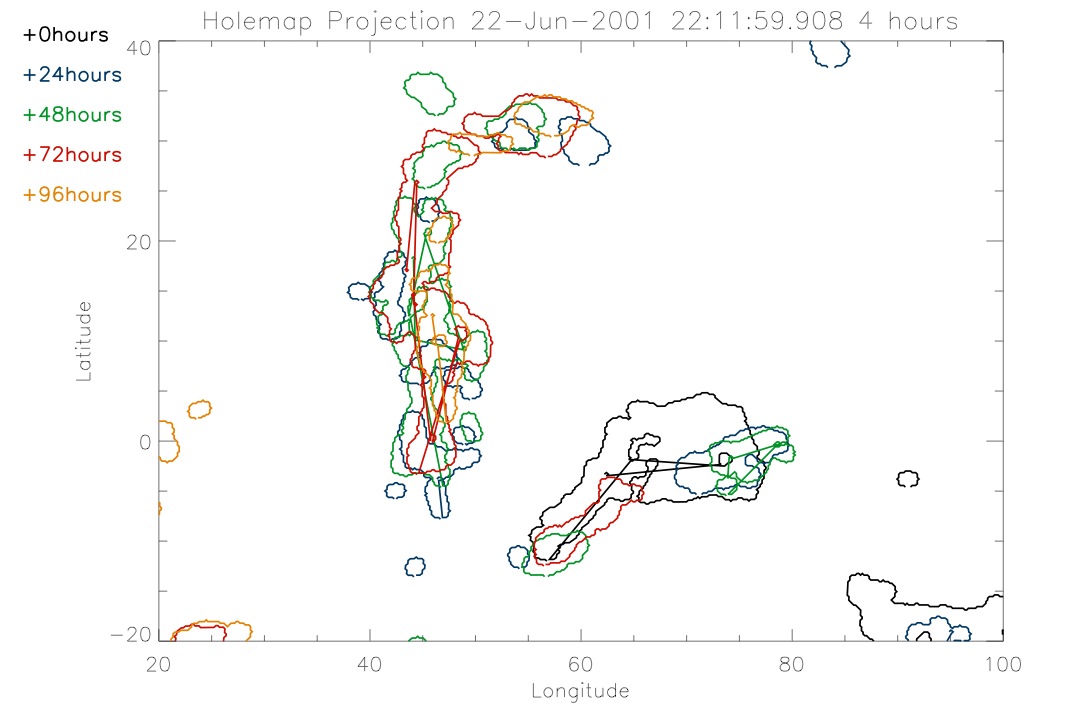
In order to keep looking at this
spot over time I changed the start time to be the beginning of the 23rd
of June. From this we can see the new holes developing as the others
shrink away.
|
|
|
|
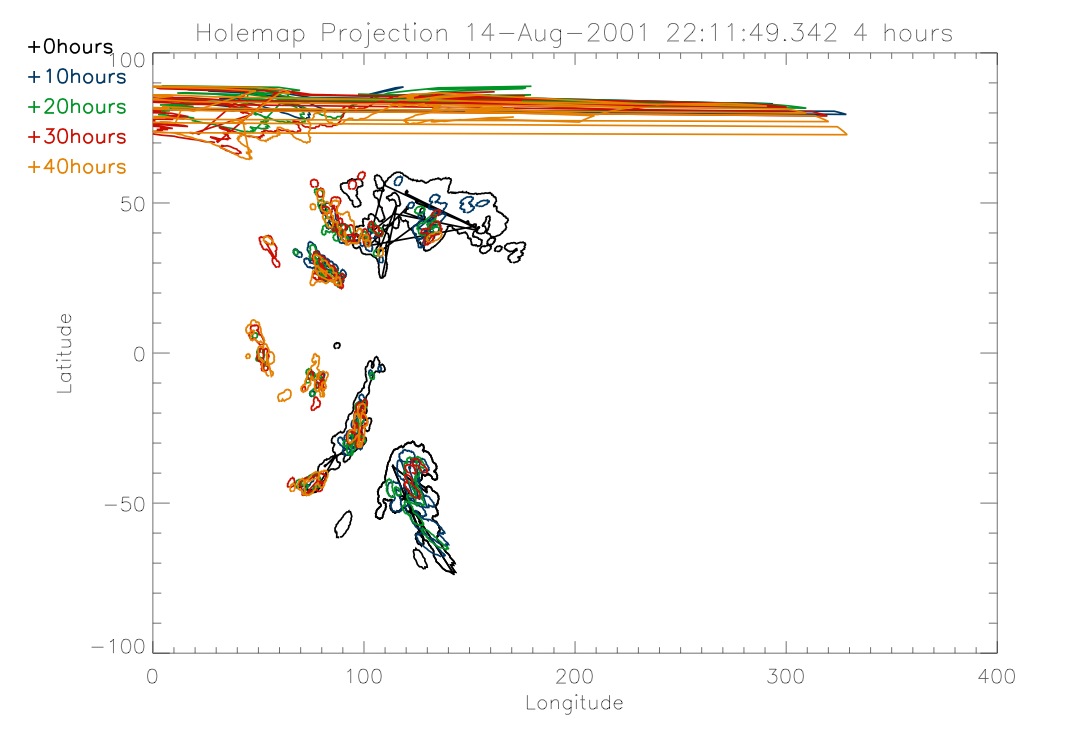
Another date that I found to be
of interest is August 15, 2001.
|
|
|
|
Tuesday,
June 15
|
|
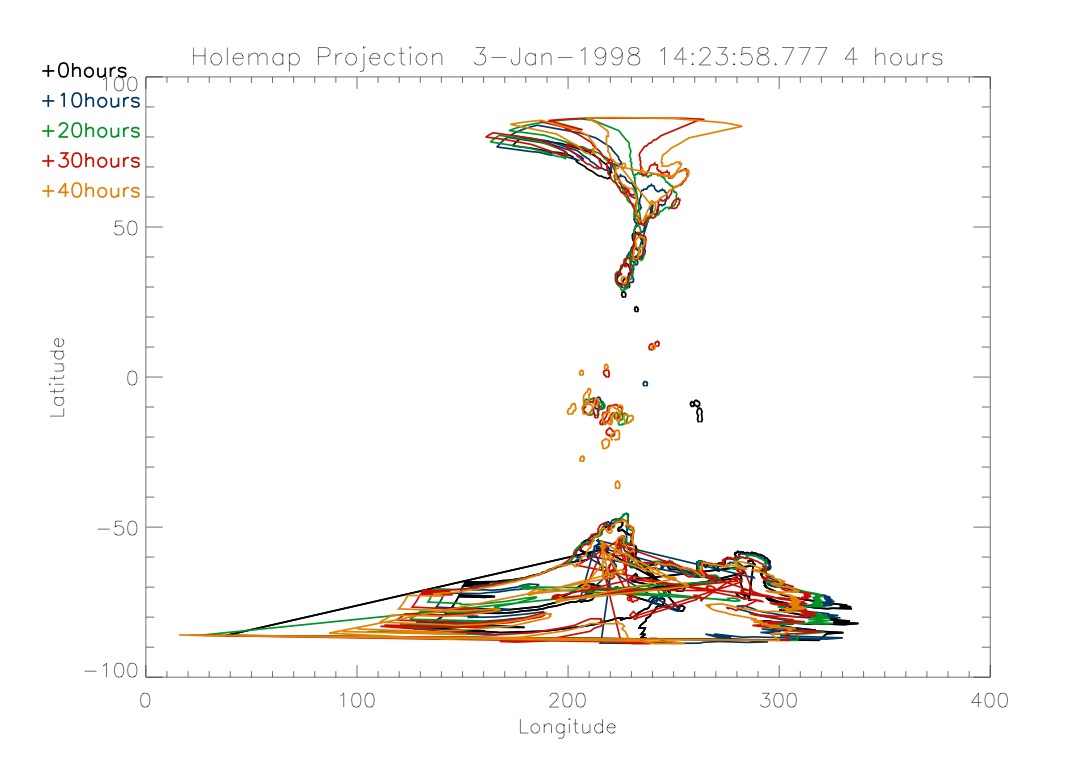
Today I looked at other dates to
get a better idea of how these coronal holes change over time. One of
the things I did was to start at the end time of the January 1, 1998
data. I wanted to see if the coronal holes persisted. The entire plot
is below.
|
|
|
|
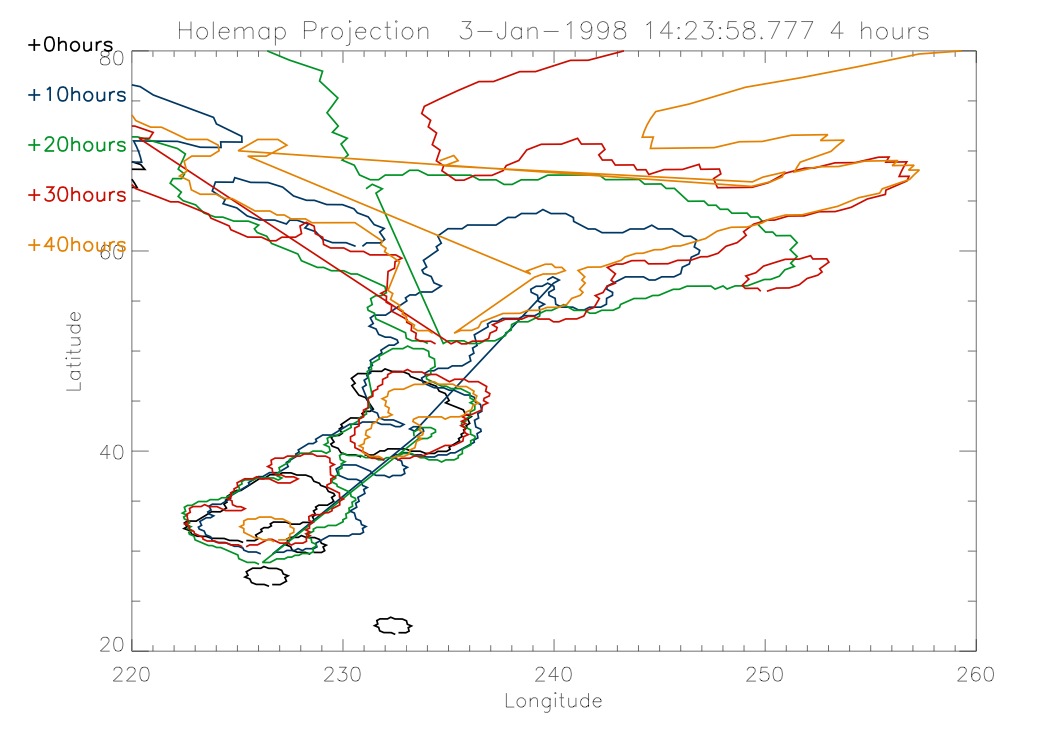
I then zoomed in on the same
area of interest that I looked at yesterday. I also made a plot of the
same area of 6 hours and again with 8 hours instead of 4 hours. There
really wasn't a discernible difference between the three of them.
|
|
|
|
By comparing this to the plot I
produced yesterday it can be seen that in the first 40 to 50 hours the
coronal hole is expanding and then it starts to shrink. After this I
searched around some dates during the solar maximum to see what kind of
plots I would get. I searched through a bunch of dates that I picked.
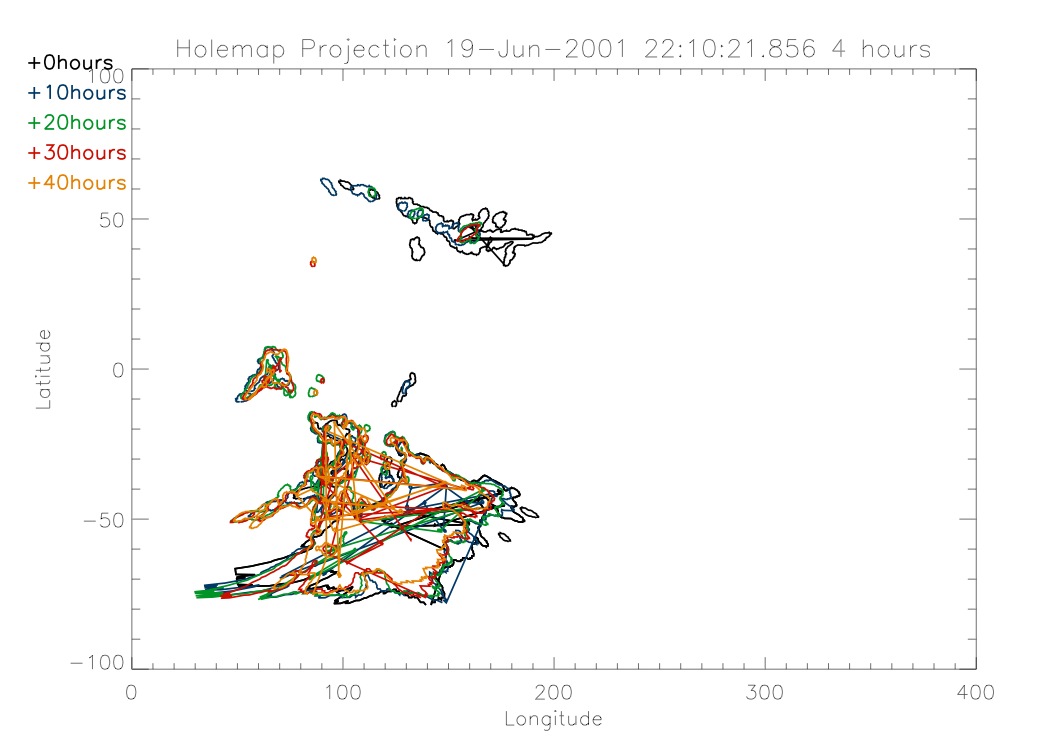
Most of the dates that I looked at had lots of interesting features.
One of the dates that I decided to focus on was June 20, 2001. The plot
below shows ten hour intervals starting on this date.
|
|
|
|
There are other dates that I
have looked at that I will explore in more detail tomorrow.
|
|
Monday,
June 14
|
|
Today I've
been trying to get more useful plots from the same information that I
used last week. One of the things I did was to zoom in on the area of
interest in the January 2nd graphs. This was very simple to do as it
only required me to change the range of the x and y axis. In addition
to this, I took the program I had been using, hlmap.pro, and created
two very similar programs from it. They do essentially the same thing
but each one has a specific task. The programs take the same inputs as
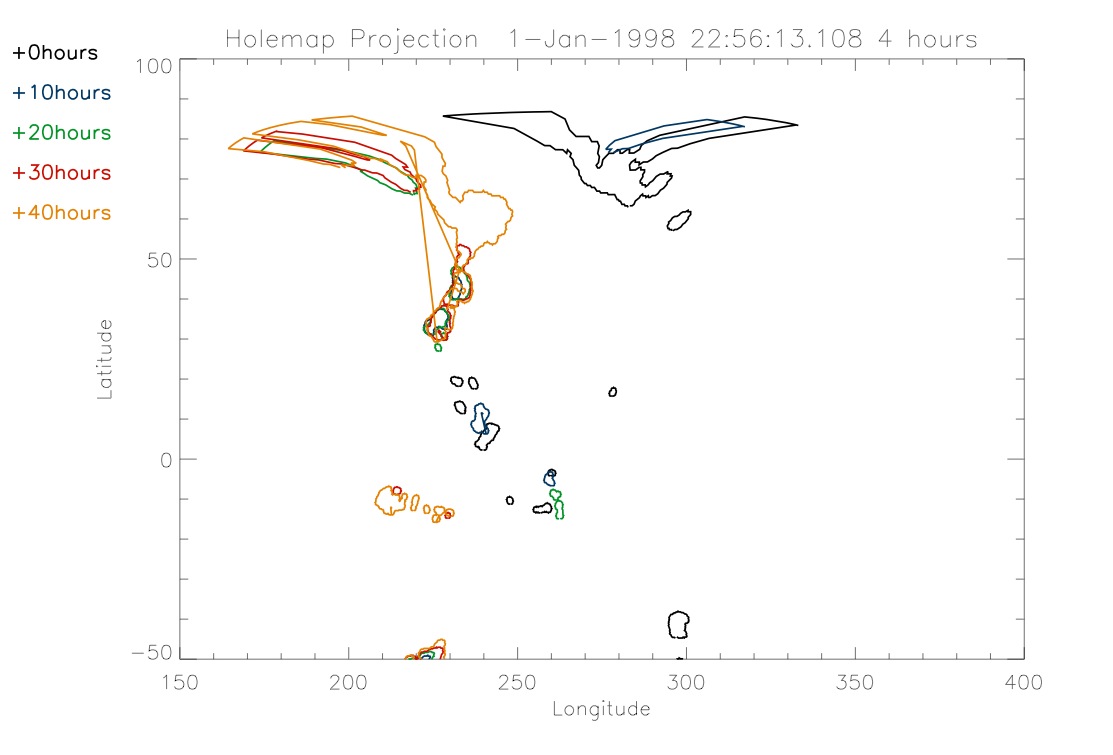
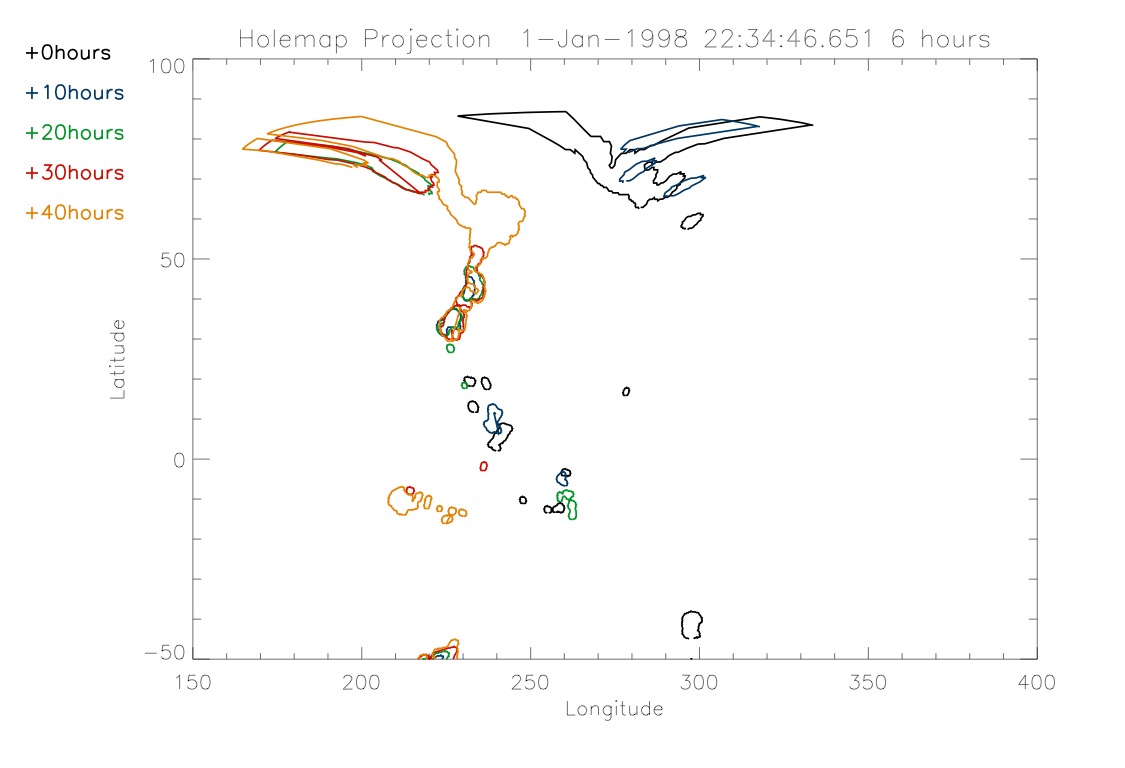
hlmap.pro. The two programs are hmpten.pro and hmp24.pro. The first
program creates a plot of 5 different hole maps with ten hours between
each. The second does the same thing, but with 24 hours between. Below
are 4 hour and 6 hour time spans with 10 hour intervals of the same
data from Friday. They are also zoomed in.
|
|
|
|
|
|
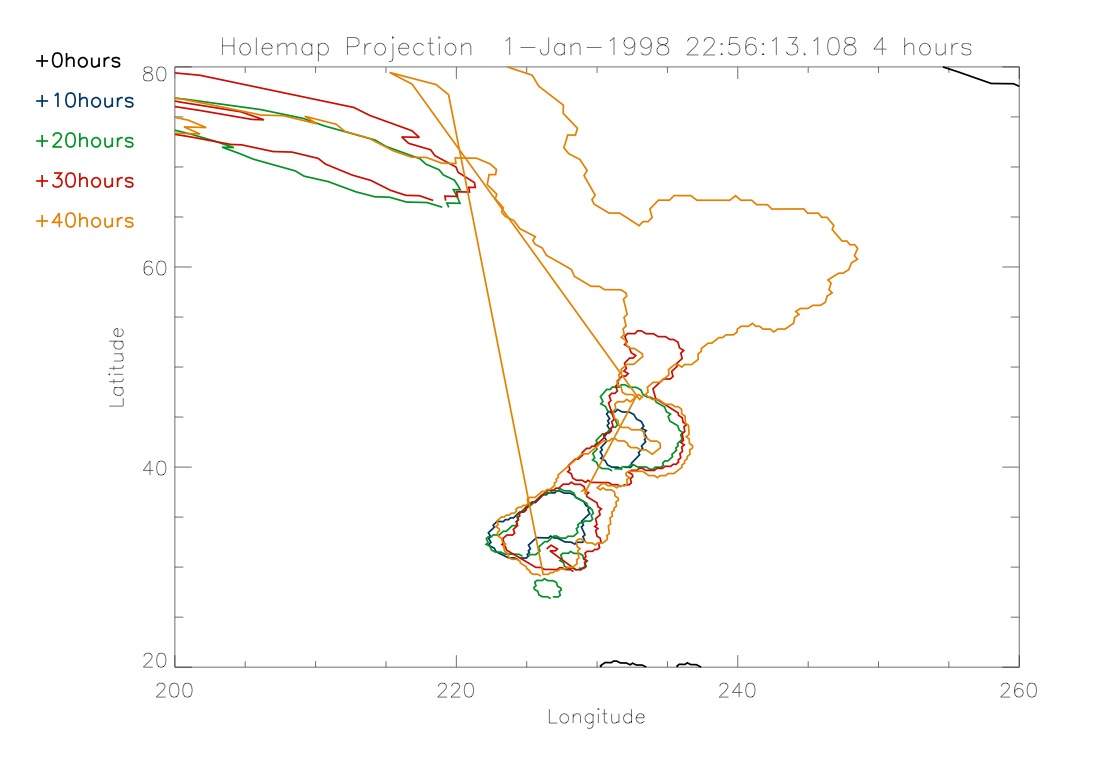
The picture below shows a more
zoomed in plot of the 4 hour one, in order to better show how the holes
evolve over time.
|
|
|