Week 8
HOME WEEK 1 WEEK 2 WEEK 3 WEEK 4 WEEK 5 WEEK 6 WEEK 7 WEEK 8 WEEK 9 WEEK 10
July 17-21
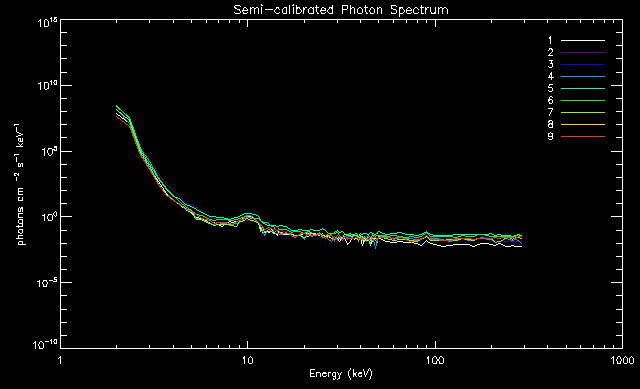
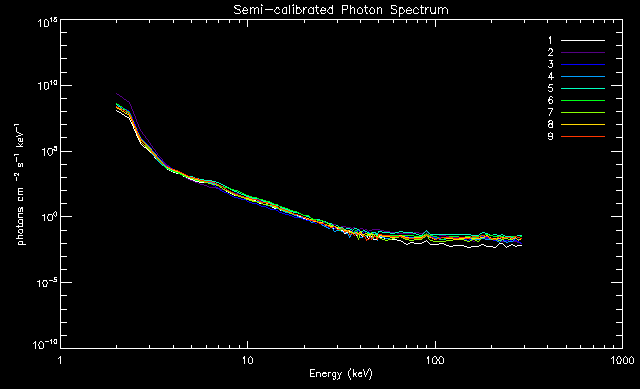
This week, I've tackled more spectral analysis, converting count rate to photon flux across a wide range of energy bands. Here I use examples from a flare taking place on 2011-04-22. The first image here depicts what the background noise might look like pre-flare, and the second image shows the photon flux as a flare begins to build.


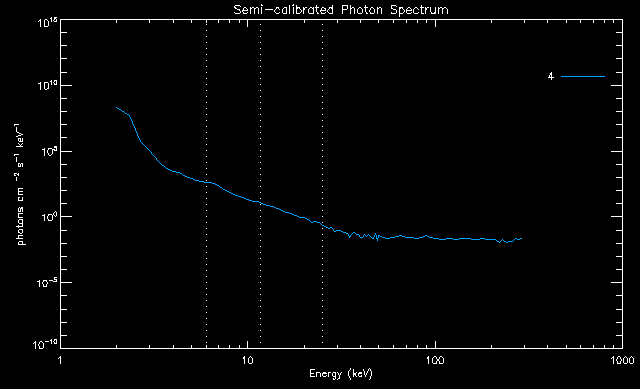
For this part of the analysis, Dr. Qiu and I decided to isolate one of the detectors. Detector 4 seemed like a safe choice, seeing as I've used its data in nearly all of the processing that I've done this summer! We'll specifically be looking at two of the energy bands I've been processing all along: 6-12 keV and 12-25 keV. By fitting a simple first order polynomial to each of these bands, we'll be able to analyze how the spectral properties of the flare change with time, and hopefully connect those to what we observe spatially.

As for the spatial analysis, an example of some of the processing Dr. Qiu and I have been working on (from the same date, 2011-04-22) can be accessed here. Another event from 2014-12-19 is notable for having resolved (what appear to be) foot points, even in energy bands as low as 6-12. The reconnection rates and ribbon/centroid motion can be found here.