Week 2
HOME WEEK 1 WEEK 2 WEEK 3 WEEK 4 WEEK 5 WEEK 6 WEEK 7 WEEK 8 WEEK 9 WEEK 10
June 5-6
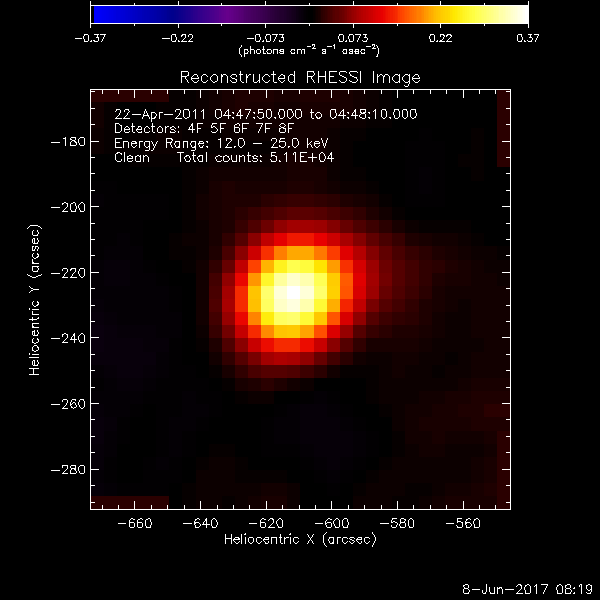
I started off the week with our first official lecture and my first meeting with Dr. Qiu! My main focus this week will be applying what I know about the RHESSI imaging process to a set of about 15 previously recorded solar flares between 2011 and 2014. I'm adapting an IDL procedure provided to me by Dr. Qiu to suit each event. The code itself seems fairly straightforward. It can take a long time to run depending on a number of factors, including how many images/frames are produced for each energy band (which in turn depends on the integration time) and how many iterations the clean algorithm runs through (up to 100, which translates to about 30 seconds per frame).
I was originally having some problems with banding and oversaturation. When I asked Dr. Qiu about these issues, she recommended that I double check my counts and positioning (xy-offset?). The RHESSI GUI used to read in my .FITS files was assigning a flare number to the time interval I requested, so I assumed it was the counts. Double checking those indeed produced better results. I still have a few oversaturated frames at the beginning of each interval. My guess is that this is caused by the program attempting to clean data in that region before the flare has actually begun, with the lower dynamic range leading to oversaturation even after the algorithm is applied.
I will be updating with mp4 or image files shortly.
June 7
Checked over what I've done so far this morning and found an error I've been making in adapting the code to each flare. Luckily it's an easy fix and might not have had much effect on the images, but I'm re-running one of the first flares just in case.
I'm still learning my way around the RHESSI interface and its corresponding code. Tested a few methods of exporting images and movies/gifs last night and today, but haven't made up my mind which I prefer. Might ask Dr. Qiu about it tomorrow.
June 8
Some frustrations. Images and videos for the lower energy bands (i.e. 12-25 keV) look decent on those that I've run so far, but higher energy bands (25-50, 50-100 keV) still appear highly oversaturated. I wonder if this is another issue with the dynamic range.
Take the first flare I'm examining as an example; dated 22-Apr-2011, beginning at about 04:35 AM. The RHESSI Browser time-based quicklook shows a significant range in count rates at lower energies, especially 12-25 keV (where I'm getting a reasonably good result). However, at higher energies, there is much less of a difference between the baseline and the peak of the flare. I've tried reducing the integration time for these energy bands to no avail. Some of the frames even glitch, and show up as zeroes; could be something to do with the clean algorithm?
Examining the RHESSI quicklooks for some of the other flares (another example: 12-Aug-2013, peaking around 10:35 AM) confirms that the largest peaks in count rate are shown at lower energies. The 12-Aug-2013 flare doesn't even change from the baseline pattern at 50-100 keV. I'll have to think on how to overcome this.
For now, I'm accumulating some .mp4 files of images at lower energies. Not exactly what we're interested in, but it's a start.

More like this, please.